. 2019 Jul 24;201(16):e00274-19.
doi: 10.1128/JB.00274-19. Print 2019 Aug 15.

Altered Stool Microbiota of Infants with Cystic Fibrosis Shows a Reduction in Genera Associated with Immune Programming from Birth

Affiliations

Altered Stool Microbiota of Infants with Cystic Fibrosis Shows a Reduction in Genera Associated with Immune Programming from Birth

Katherine M Antosca et al. J Bacteriol. .

Abstract

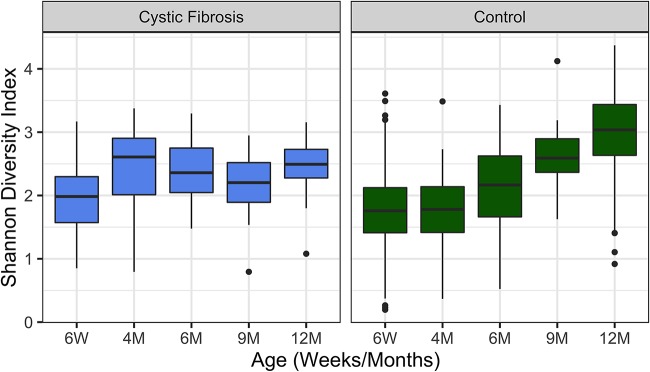
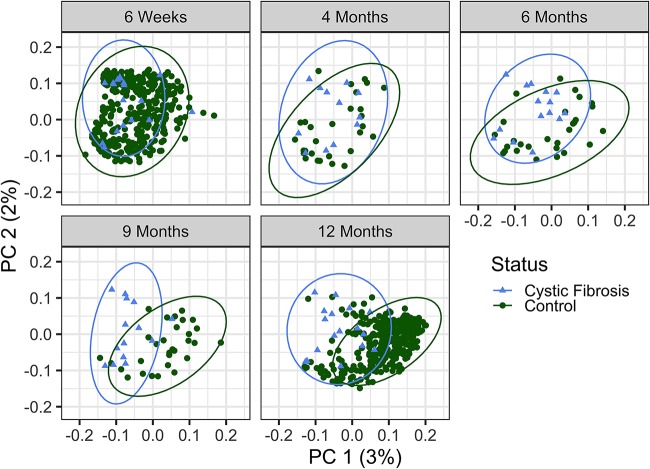
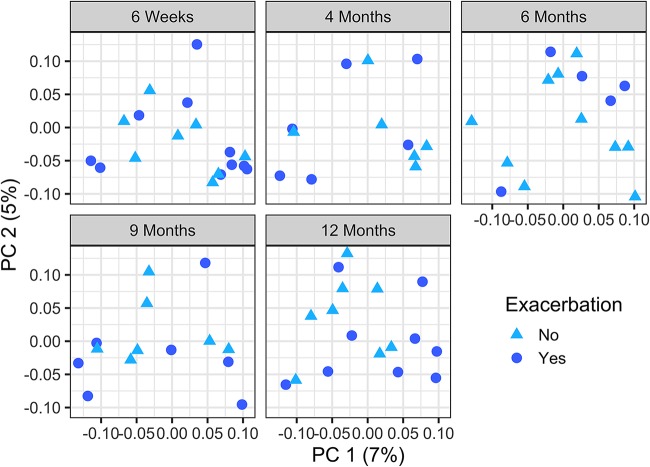
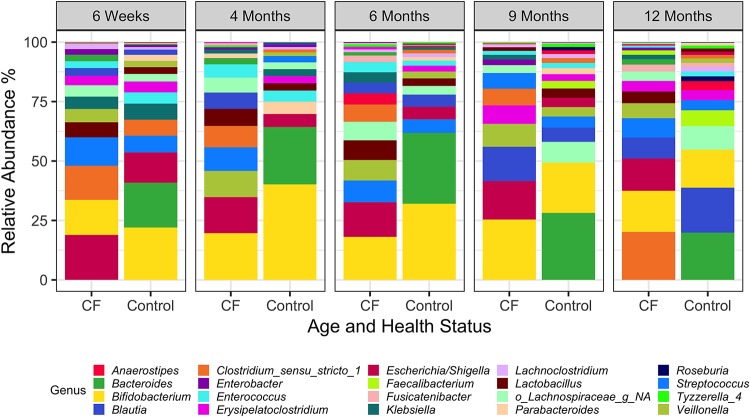
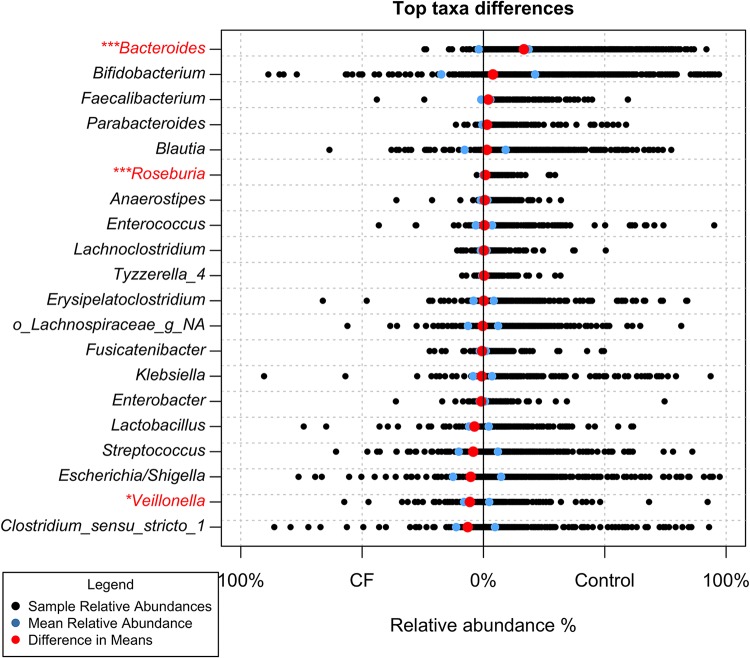
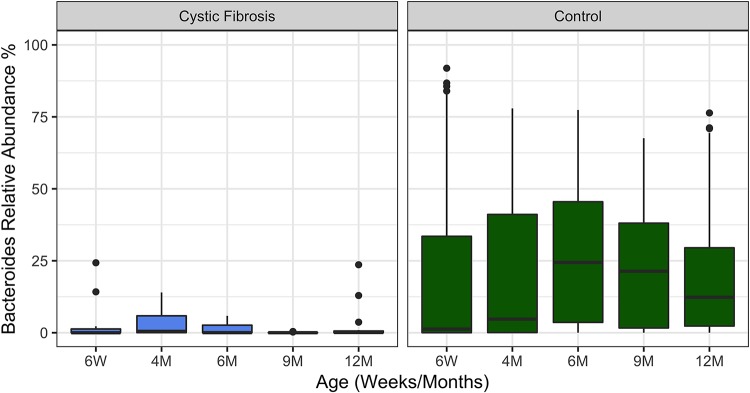
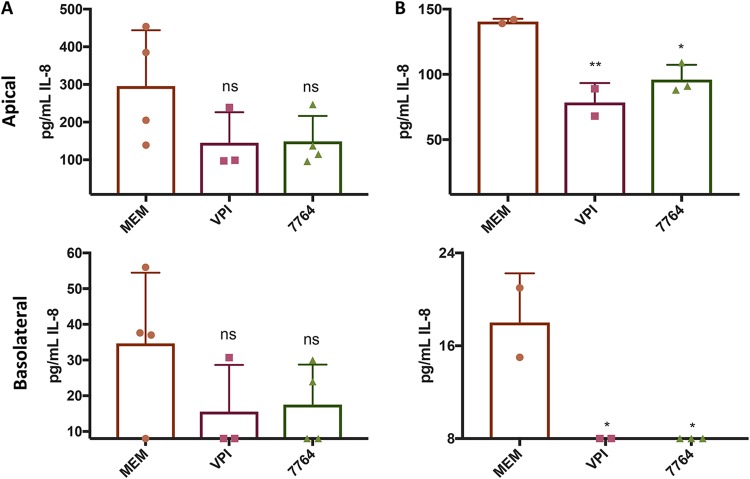
Previous work from our group indicated an association between the gastrointestinal microbiota of infants with cystic fibrosis (CF) and airway disease in this population. Here we report that stool microbiota of infants with CF demonstrates an altered but largely unchanging within-individual bacterial diversity (alpha diversity) over the first year of life, in contrast to the infants without CF (control cohort), which showed the expected increase in alpha diversity over the first year. The beta diversity, or between-sample diversity, of these two cohorts was significantly different over the first year of life and was statistically significantly associated with airway exacerbations, confirming our earlier findings. Compared with control infants, infants with CF had reduced levels of Bacteroides, a bacterial genus associated with immune modulation, as early as 6 weeks of life, and this significant reduction of Bacteroides spp. in the cohort with CF persisted over the entire first year of life. Only two other genera were significantly different across the first year of life: Roseburia was significantly reduced and Veillonella was significantly increased. Other genera showed differences between the two cohorts but only at selected time points. In vitro studies demonstrated that exposure of the apical face of polarized intestinal cell lines to Bacteroides species supernatants significantly reduced production of interleukin 8 (IL-8), suggesting a mechanism whereby changes in the intestinal microbiota could impact inflammation in CF. This work further establishes an association between gastrointestinal microbiota, inflammation, and airway disease in infants with CF and presents a potential opportunity for therapeutic interventions beginning in early life.IMPORTANCE There is growing evidence for a link between gastrointestinal bacterial communities and airway disease progression in CF. We demonstrate that infants with CF ≤1 year of age show a distinct stool microbiota versus that of control infants of a comparable age. We detected associations between the gut microbiome and airway exacerbation events in the cohort of infants with CF, and in vitro studies provided one possible mechanism for this observation. These data clarify that current therapeutics do not establish in infants with CF a gastrointestinal microbiota like that in healthy infants, and we suggest that interventions that direct the gastrointestinal microbiota closer to a healthy state may provide systemic benefits to these patients during a critical window of immune programming that might have implications for lifelong health.

Keywords: cystic fibrosis; cytokine; exacerbation; infant; intestine; microbiota; stool.


Figures

FIG 1
FIG 1
Alpha diversity varies between subjects with CF and control infants without CF. Shown are Shannon alpha diversity measures for the cohort of children with CF and the control cohort at the indicated times over the first year of life. The boxes span the first and third quartiles of the data, with the median value indicated as the central horizontal black line. Outliers are indicated as points beyond the span of the whiskers. The difference in alpha diversity between the two cohorts was not significant at 6 weeks of age (Shannon P = 0.18) but was significant at 4 months (Shannon P = 0.016), 9 months (Shannon P = 0.014), and 12 months (P < 0.001) of age. For the CF cohort, there was no significant difference in Shannon diversity index after false-discovery rate (FDR) correction between 6 weeks and 12 months; this difference was significant for the control cohort (P < 0.0001). The Wilcoxon rank sum was used for all comparisons, and FDR correction was applied for multiple-testing correction.
FIG 2
FIG 2
Beta diversity of CF and control cohorts over time. The beta diversity of CF samples, as measured by generalized UniFrac distances, is significantly different from that of controls at all time points. Each dot represents a unique sample, and the age and source of the samples are indicated by the color and shape of the dot as depicted in the key. By PERMANOVA, P = 0.015 at 6 weeks, P = 0.004 at 4 months, and P = 0.001 at the remaining time points of 6, 9, and 12 months of age. The percent variability for the total plot region (PC, principal coordinate) is indicated on the x and y axes; plots are subdivided by age for clarity.
FIG 3
FIG 3
Beta diversity is associated with airway exacerbation in infants with CF. The principal-coordinate analysis (PCoA) plots depict samples from CF patients at all 5 time points: 6 weeks, 4 months, 6 months, 9 months, and 12 months of age. As indicated in the key, circles indicate that this subject had an exacerbation event in the first year of life, while triangles indicate no such event in the first year. Adjusting for age to account for repeated measures, pulmonary exacerbations in the first year of life were significantly associated with beta diversity, as measured by generalized UniFrac distances (PERMANOVA P = 0.041). The percent variability for the total plot region (PC, principal coordinate) is indicated on the x and y axes; plots are subdivided by age for clarity.
FIG 4
FIG 4
Comparison of relative abundances of genera for subjects with CF and the control group over the first year of life. Relative abundance of the top 20 taxa present in stool samples is indicated for the CF and control cohorts. NA, not assigned. The data used to generate this figure are shown in Table S2.
FIG 5
FIG 5
Relative abundances of genera across the first year of life. Black points represent the relative abundance of each genus in the 76 individual CF samples and 802 individual control samples. The blue points represent the respective mean relative abundance for each genus in the CF and control cohorts. The red points represent the difference in the means (control mean relative abundance − CF mean relative abundance). *, P < 0.05; ***, P < 0.001; significance is marked based on Wilcoxon rank sum P values that were found to be significant after Benjamini-Hochburg multiple-testing correction. Genera significantly different across the first year of life are in red.
FIG 6
FIG 6
Relative abundance of Bacteroides in CF and healthy infants over the first year of life. Infants with CF have significantly lower levels of Bacteroides in their stool across all time points in their first year of life (Wilcoxon rank sum P < 0.001). The time points assessed are indicated. The boxes span the first and third quartiles of the data, with the median value indicated in black. Outliers are indicated as points beyond the span of the whiskers. We note that there are similar numbers of outliers in the CF and control cohort, despite the much larger numbers of control patients analyzed, which may be due the low abundance of Bacteroides in the CF cohort making such outliers more easily detected.
FIG 7
FIG 7
Modulation of cytokines by Bacteroides spp. Shown are the apical and basolateral levels of IL-8 for untreated control (MEM) and for the indicated strains: Bacteroides thetaiotaomicron VPI or a clinical Bacteroides isolate (7764). (A) Addition of cells of B. thetaiotaomicron VPI 5482 or the clinical isolate from a CF subject, SMC7764 (7764), to the apical compartment of the Transwell is compared to the untreated control (MEM). Under all conditions, the treatment was supplemented with 100 ng/ml of TNF-α. The filters were incubated anaerobically for 3 h after treatment, and then the added suspension of bacteria was removed and replaced with fresh medium. Filters were returned to anaerobic incubation overnight. Twenty-four hours after initial application of the bacteria, supernatants were collected and IL-8 levels measured via ELISA (PromoKine or Biolegend). To determine CFU, filters were scraped and plated (n = 6); at the end of the experiment there were ∼2 × 109 ± 4 × 108 CFU bacteria/well associated with the apical face of the monolayers, with no significant difference between the strains. (B) Cell-free supernatants (prepared as described in the supplemental material) or medium (MEM) was supplemented with 100 ng/ml of TNF-α and then applied to the apical face of the Caco-2 cells and the filters were incubated anaerobically for 3 h, the supernatant was removed, and then fresh cell-free supernatant supplemented with 100 ng/ml of TNF-α was added and the filters were returned to anaerobic incubation overnight. The exchange of medium at 3 h was performed to mirror the washing step used with cells, as outlined for panel A. Twenty-four hours after initial application of the bacterial supernatants, culture supernatants were collected and IL-8 levels measured via ELISA (PromoKine or Biolegend). For both panels, *, P < 0.05, and **, P < 0.01, by one-way analysis of variance (ANOVA) with Dunnett’s multiple-comparison posttest compared to the untreated (MEM) condition. The pH of the supernatants was ∼8.0 at the start of the experiment and unchanged at ∼8.0 after incubation with the Caco-2 cells.

Similar articles

Cited by

References

    1. Boucher RC. 2004. New concepts of the pathogenesis of cystic fibrosis lung disease. Eur Respir J 23:146–158. doi:10.1183/09031936.03.00057003. - DOI - PubMed
    1. Lyczak JB, Cannon CL, Pier GB. 2002. Lung infections associated with cystic fibrosis. Clin Microbiol Rev 15:194–222. doi:10.1128/cmr.15.2.194-222.2002. - DOI - PMC - PubMed
    1. Huang NN, Van Loon EL, Sheng KT. 1961. The flora of the respiratory tract of patients with cystic fibrosis of the pancreas. J Pediatr 59:512–521. doi:10.1016/S0022-3476(61)80234-5. - DOI - PubMed
    1. Deretic V, Martin DW, Schurr MJ, Mudd MH, Hibler NS, Curcic R, Boucher JC. 1993. Conversion to mucoidy in Pseudomonas aeruginosa. Nat Biotechnol 11:1133–1136. doi:10.1038/nbt1093-1133. - DOI - PubMed
    1. Govan JR, Nelson JW. 1992. Microbiology of lung infection in cystic fibrosis. Br Med Bull 48:912–930. doi:10.1093/oxfordjournals.bmb.a072585. - DOI - PubMed

Publication types

LinkOut - more resources