Establishment of a Protein Concentration Gradient in the Outer Membrane Requires Two Diffusion-Limiting Mechanisms
- PMID: 31209077
- PMCID: PMC6689296
- DOI: 10.1128/JB.00177-19
Establishment of a Protein Concentration Gradient in the Outer Membrane Requires Two Diffusion-Limiting Mechanisms
Abstract
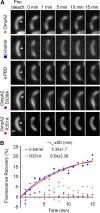
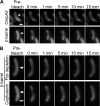
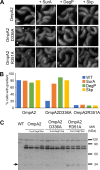
OmpA-like proteins are involved in the stabilization of the outer membrane, resistance to osmotic stress, and pathogenesis. In Caulobacter crescentus, OmpA2 forms a physiologically relevant concentration gradient that forms by an uncharacterized mechanism, in which the gradient orientation depends on the position of the gene locus. This suggests that OmpA2 is synthesized and translocated to the periplasm close to the position of the gene and that the gradient forms by diffusion of the protein from this point. To further understand how the OmpA2 gradient is established, we determined the localization and mobility of the full protein and of its two structural domains. We show that OmpA2 does not diffuse and that both domains are required for gradient formation. The C-terminal domain binds tightly to the cell wall and the immobility of the full protein depends on the binding of this domain to the peptidoglycan; in contrast, the N-terminal membrane β-barrel diffuses slowly. Our results support a model in which once OmpA2 is translocated to the periplasm, the N-terminal membrane β-barrel is required for an initial fast restriction of diffusion until the position of the protein is stabilized by the binding of the C-terminal domain to the cell wall. The implications of these results on outer membrane protein diffusion and organization are discussed.IMPORTANCE Protein concentration gradients play a relevant role in the organization of the bacterial cell. The Caulobacter crescentus protein OmpA2 forms an outer membrane polar concentration gradient. To understand the molecular mechanism that determines the formation of this gradient, we characterized the mobility and localization of the full protein and of its two structural domains an integral outer membrane β-barrel and a periplasmic peptidoglycan binding domain. Each domain has a different role in the formation of the OmpA2 gradient, which occurs in two steps. We also show that the OmpA2 outer membrane β-barrel can diffuse, which is in contrast to what has been reported previously for several integral outer membrane proteins in Escherichia coli, suggesting a different organization of the outer membrane proteins.
Keywords: Caulobacter crescentus; FRAP; cell wall; limited diffusion; outer membrane; protein concentration gradient.
Copyright © 2019 American Society for Microbiology.
Figures


Similar articles
-
Localization of the outer membrane protein OmpA2 in Caulobacter crescentus depends on the position of the gene in the chromosome.J Bacteriol. 2014 Aug;196(15):2889-900. doi: 10.1128/JB.01516-14. Epub 2014 Jun 2. J Bacteriol. 2014. PMID: 24891444 Free PMC article.
-
A Multiprotein Complex Anchors Adhesive Holdfast at the Outer Membrane of Caulobacter crescentus.J Bacteriol. 2019 Aug 22;201(18):e00112-19. doi: 10.1128/JB.00112-19. Print 2019 Sep 15. J Bacteriol. 2019. PMID: 31061167 Free PMC article.
-
The B12 receptor BtuB alters the membrane integrity of Caulobacter crescentus.Microbiology (Reading). 2019 Mar;165(3):311-323. doi: 10.1099/mic.0.000753. Epub 2019 Jan 16. Microbiology (Reading). 2019. PMID: 30628887
-
Molecular mechanism of ferricsiderophore passage through the outer membrane receptor proteins of Escherichia coli.Biometals. 2007 Jun;20(3-4):263-74. doi: 10.1007/s10534-006-9060-9. Epub 2006 Dec 22. Biometals. 2007. PMID: 17186377 Review.
-
The β-Barrel Assembly Machinery Complex.Methods Mol Biol. 2015;1329:1-16. doi: 10.1007/978-1-4939-2871-2_1. Methods Mol Biol. 2015. PMID: 26427672 Review.
Cited by
-
Similarly slow diffusion of BAM and SecYEG complexes in live E. coli cells observed with 3D spt-PALM.Biophys J. 2023 Nov 21;122(22):4382-4394. doi: 10.1016/j.bpj.2023.10.017. Epub 2023 Oct 17. Biophys J. 2023. PMID: 37853695 Free PMC article.
-
The Fluidity of the Bacterial Outer Membrane Is Species Specific: Bacterial Lifestyles and the Emergence of a Fluid Outer Membrane.Bioessays. 2020 Aug;42(8):e1900246. doi: 10.1002/bies.201900246. Epub 2020 May 4. Bioessays. 2020. PMID: 32363627 Free PMC article.
-
Outer Membrane Vesicles from Caulobacter crescentus: A Platform for Recombinant Antigen Presentation.ACS Nano. 2025 Jun 10;19(22):20526-20538. doi: 10.1021/acsnano.4c17885. Epub 2025 May 28. ACS Nano. 2025. PMID: 40434063 Free PMC article.
References
Publication types
MeSH terms
Substances
LinkOut - more resources
Full Text Sources
Miscellaneous

