

Estimating Relatedness Between Malaria Parasites
- PMID: 31209105
- PMCID: PMC6707449
- DOI: 10.1534/genetics.119.302120
Estimating Relatedness Between Malaria Parasites
Abstract
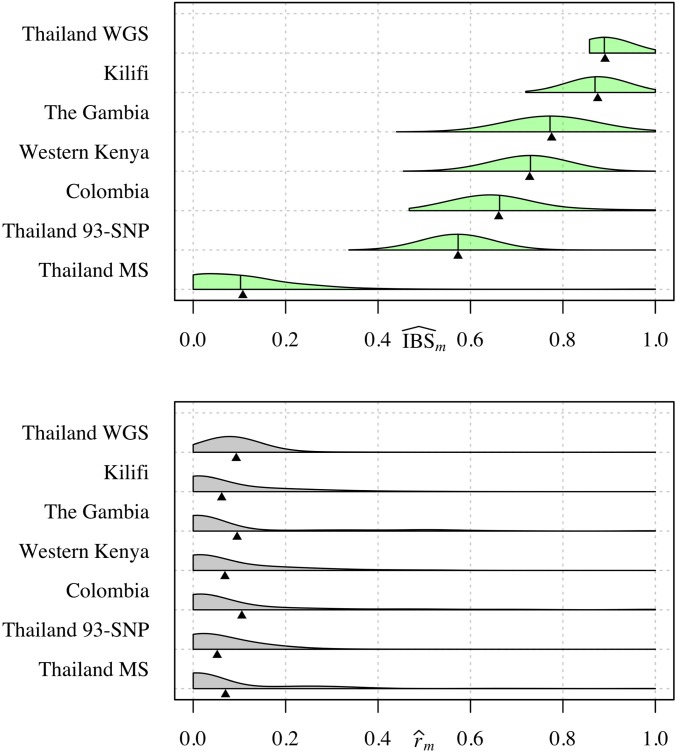
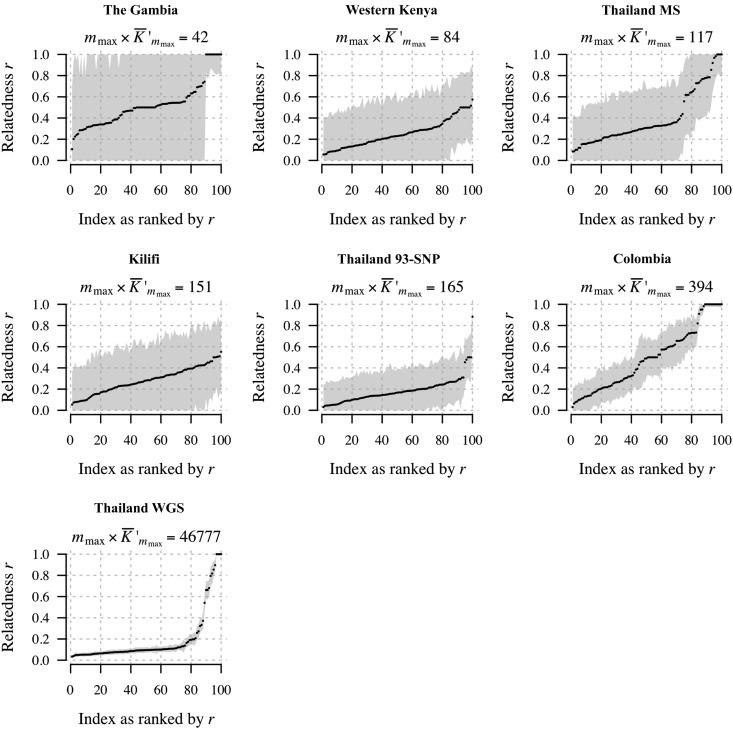
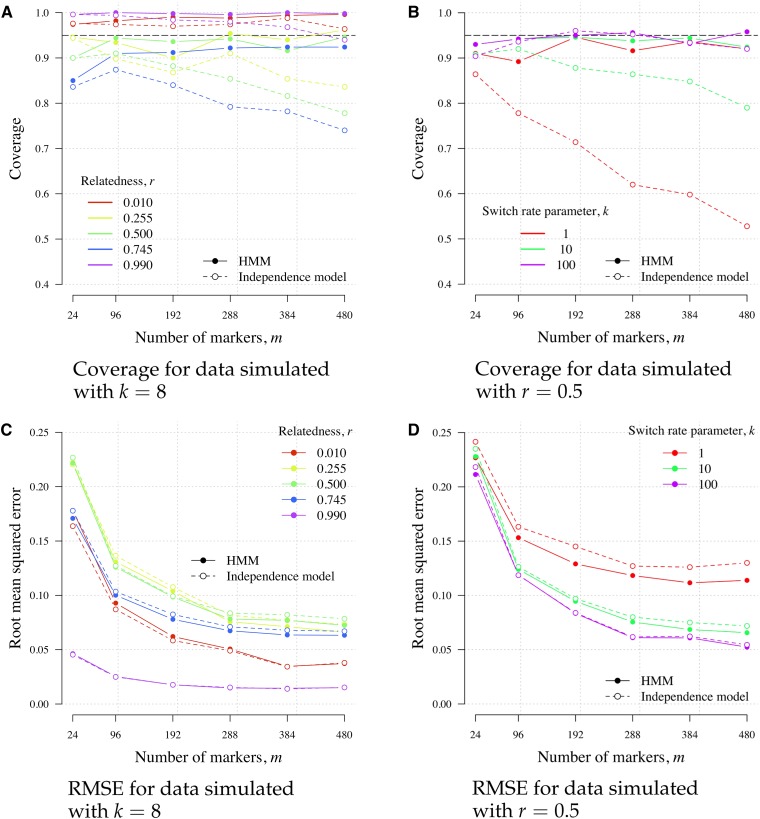
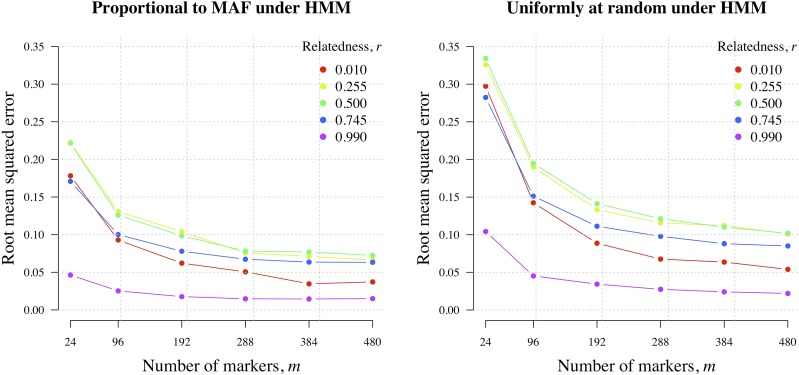
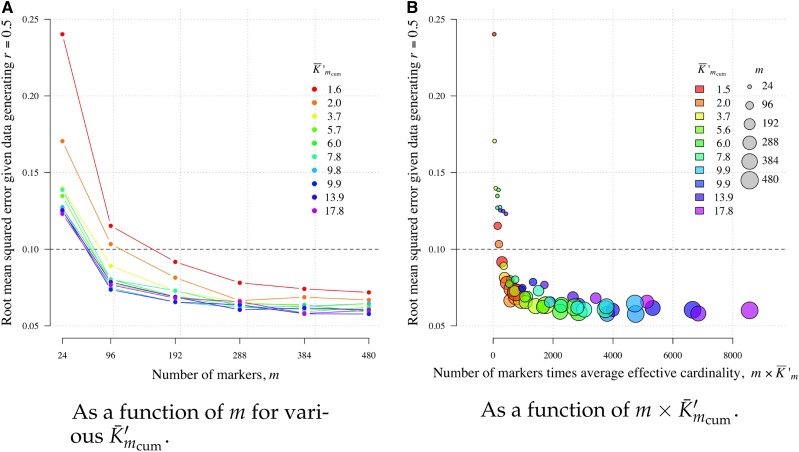
Understanding the relatedness of individuals within or between populations is a common goal in biology. Increasingly, relatedness features in genetic epidemiology studies of pathogens. These studies are relatively new compared to those in humans and other organisms, but are important for designing interventions and understanding pathogen transmission. Only recently have researchers begun to routinely apply relatedness to apicomplexan eukaryotic malaria parasites, and to date have used a range of different approaches on an ad hoc basis. Therefore, it remains unclear how to compare different studies and which measures to use. Here, we systematically compare measures based on identity-by-state (IBS) and identity-by-descent (IBD) using a globally diverse data set of malaria parasites, Plasmodium falciparum and P. vivax, and provide marker requirements for estimates based on IBD. We formally show that the informativeness of polyallelic markers for relatedness inference is maximized when alleles are equifrequent. Estimates based on IBS are sensitive to allele frequencies, which vary across populations and by experimental design. For portability across studies, we thus recommend estimates based on IBD. To generate estimates with errors below an arbitrary threshold of 0.1, we recommend ∼100 polyallelic or 200 biallelic markers. Marker requirements are immediately applicable to haploid malaria parasites and other haploid eukaryotes. C.I.s facilitate comparison when different marker sets are used. This is the first attempt to provide rigorous analysis of the reliability of, and requirements for, relatedness inference in malaria genetic epidemiology. We hope it will provide a basis for statistically informed prospective study design and surveillance strategies.
Keywords: Plasmodium falciparum; Plasmodium vivax; genetic epidemiology; hidden Markov model; identity-by-descent; identity-by-state; independence model; malaria; relatedness.
Copyright © 2019 Taylor et al.
Figures
Similar articles
-
Identity-by-descent with uncertainty characterises connectivity of Plasmodium falciparum populations on the Colombian-Pacific coast.PLoS Genet. 2020 Nov 16;16(11):e1009101. doi: 10.1371/journal.pgen.1009101. eCollection 2020 Nov. PLoS Genet. 2020. PMID: 33196661 Free PMC article.
-
Quantifying connectivity between local Plasmodium falciparum malaria parasite populations using identity by descent.PLoS Genet. 2017 Oct 27;13(10):e1007065. doi: 10.1371/journal.pgen.1007065. eCollection 2017 Oct. PLoS Genet. 2017. PMID: 29077712 Free PMC article.
-
Genotype comparison of Plasmodium vivax and Plasmodium falciparum clones from pregnant and non-pregnant populations in North-west Colombia.Malar J. 2012 Nov 26;11:392. doi: 10.1186/1475-2875-11-392. Malar J. 2012. PMID: 23181896 Free PMC article.
-
Out of Africa: origins and evolution of the human malaria parasites Plasmodium falciparum and Plasmodium vivax.Int J Parasitol. 2017 Feb;47(2-3):87-97. doi: 10.1016/j.ijpara.2016.05.008. Epub 2016 Jul 2. Int J Parasitol. 2017. PMID: 27381764 Free PMC article. Review.
-
Comparative evolutionary genomics of human malaria parasites.Trends Parasitol. 2008 Dec;24(12):545-50. doi: 10.1016/j.pt.2008.09.003. Epub 2008 Oct 18. Trends Parasitol. 2008. PMID: 18938107 Review.
Cited by
-
Sensitive and modular amplicon sequencing of Plasmodium falciparum diversity and resistance for research and public health.bioRxiv [Preprint]. 2025 Feb 19:2024.08.22.609145. doi: 10.1101/2024.08.22.609145. bioRxiv. 2025. Update in: Sci Rep. 2025 Mar 28;15(1):10737. doi: 10.1038/s41598-025-94716-5. PMID: 39229023 Free PMC article. Updated. Preprint.
-
Microhaplotype deep sequencing assays to capture Plasmodium vivax infection lineages.Nat Commun. 2025 Aug 5;16(1):7192. doi: 10.1038/s41467-025-62357-x. Nat Commun. 2025. PMID: 40764298 Free PMC article. Clinical Trial.
-
Antimalarial Drug Resistance and Implications for the WHO Global Technical Strategy.Curr Epidemiol Rep. 2021;8(2):46-62. doi: 10.1007/s40471-021-00266-5. Epub 2021 Mar 14. Curr Epidemiol Rep. 2021. PMID: 33747712 Free PMC article. Review.
-
Dcifer: an IBD-based method to calculate genetic distance between polyclonal infections.Genetics. 2022 Sep 30;222(2):iyac126. doi: 10.1093/genetics/iyac126. Genetics. 2022. PMID: 36000888 Free PMC article.
-
Comparison of molecular surveillance methods to assess changes in the population genetics of Plasmodium falciparum in high transmission.Front Parasitol. 2023;2:1067966. doi: 10.3389/fpara.2023.1067966. Epub 2023 Apr 3. Front Parasitol. 2023. PMID: 38031549 Free PMC article.
References
-
- Aydemir O., Janko M., Hathaway N. J., Verity R., Mwandagalirwa M. K., et al. , 2018. Drug-resistance and population structure of plasmodium falciparum across the democratic Republic of Congo using high-throughput molecular inversion probes. J. Infect. Dis. 218: 946–955. 10.1093/infdis/jiy223 - DOI - PMC - PubMed
Publication types
MeSH terms
Grants and funding
LinkOut - more resources
Full Text Sources
