. 2019 Aug 9;294(32):12020-12039.
doi: 10.1074/jbc.RA118.007020. Epub 2019 Jun 17.

Acetyl-CoA carboxylase 1-dependent lipogenesis promotes autophagy downstream of AMPK

Affiliations

Acetyl-CoA carboxylase 1-dependent lipogenesis promotes autophagy downstream of AMPK

Angelina S Gross et al. J Biol Chem. .

Abstract

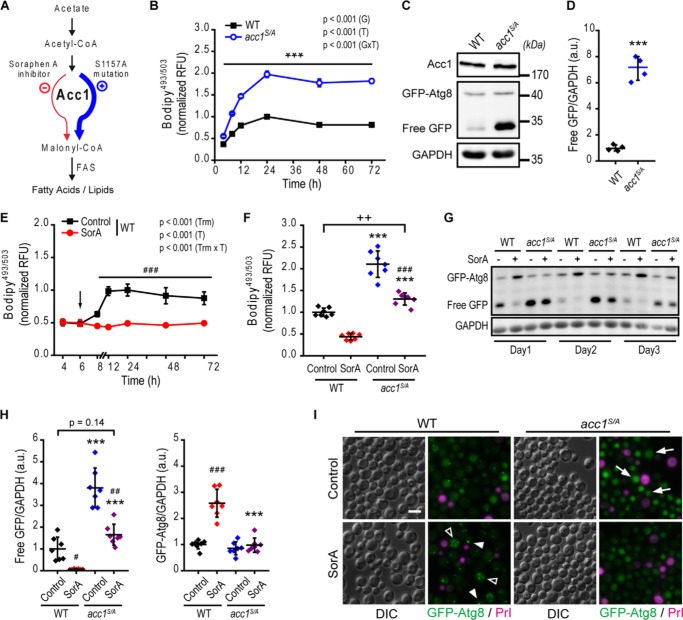
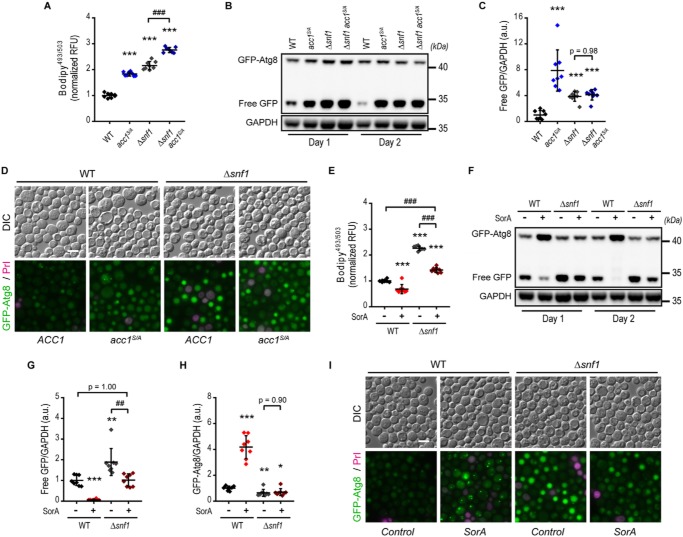
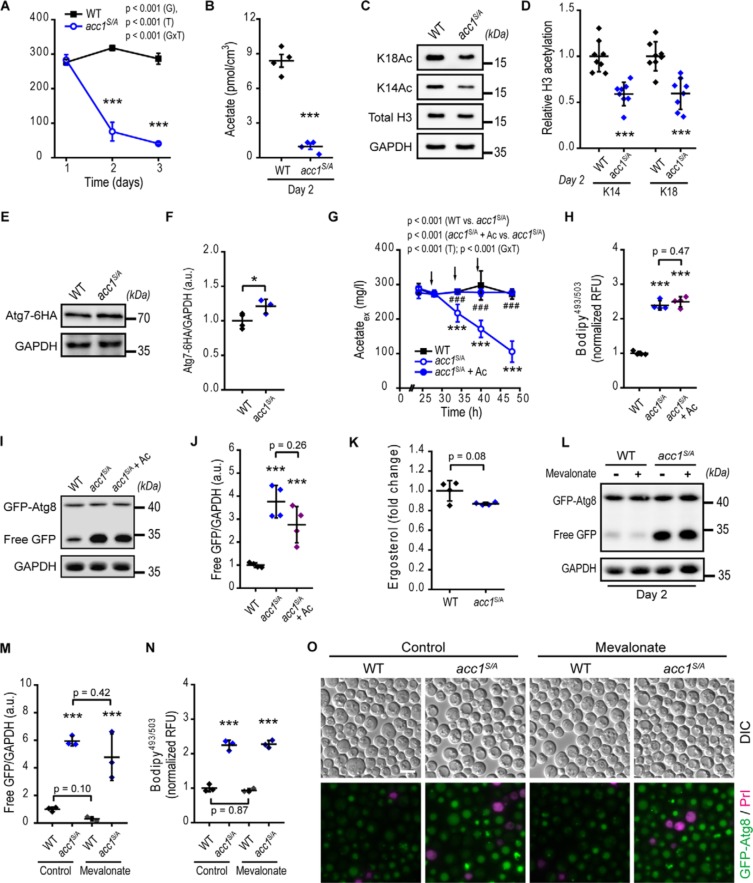
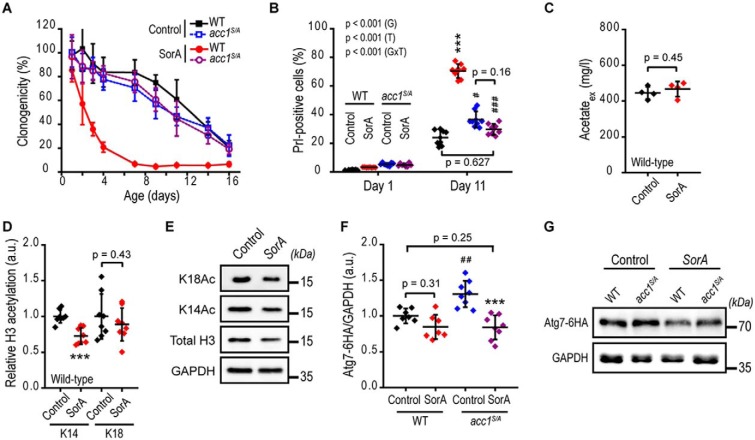
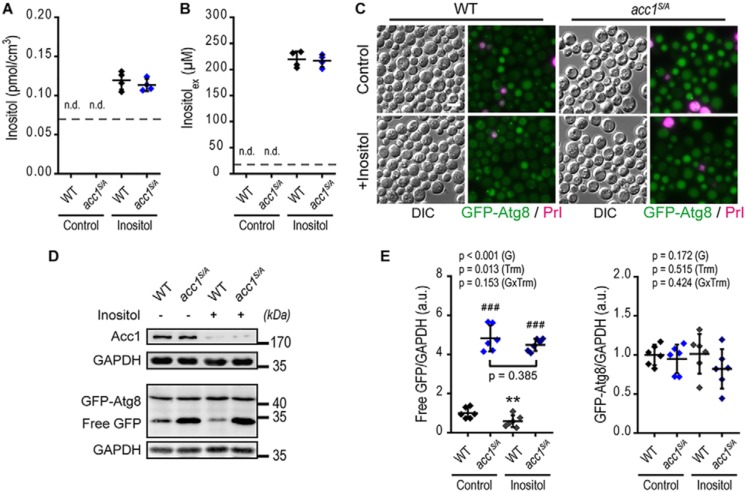
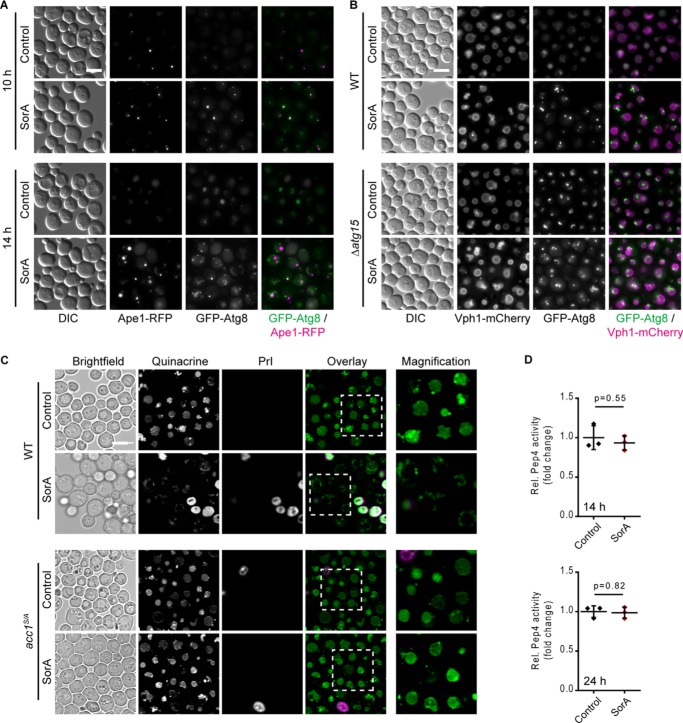
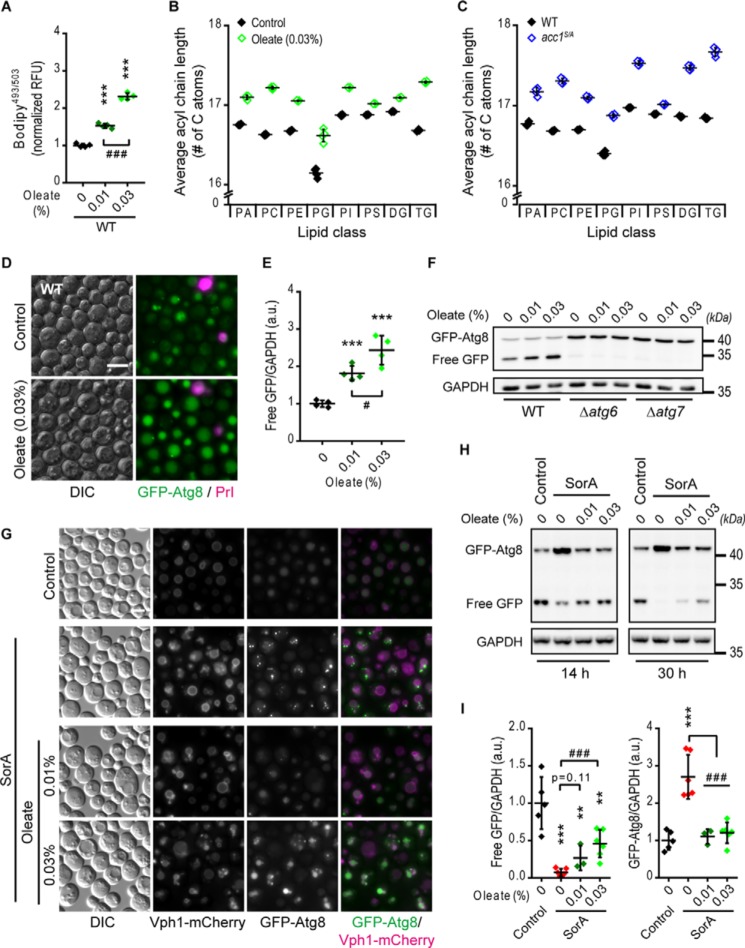
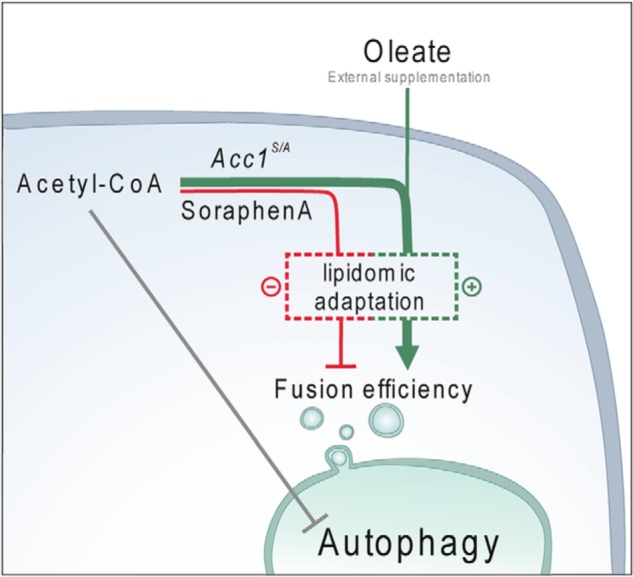
Autophagy, a membrane-dependent catabolic process, ensures survival of aging cells and depends on the cellular energetic status. Acetyl-CoA carboxylase 1 (Acc1) connects central energy metabolism to lipid biosynthesis and is rate-limiting for the de novo synthesis of lipids. However, it is unclear how de novo lipogenesis and its metabolic consequences affect autophagic activity. Here, we show that in aging yeast, autophagy levels highly depend on the activity of Acc1. Constitutively active Acc1 (acc1S/A ) or a deletion of the Acc1 negative regulator, Snf1 (yeast AMPK), shows elevated autophagy levels, which can be reversed by the Acc1 inhibitor soraphen A. Vice versa, pharmacological inhibition of Acc1 drastically reduces cell survival and results in the accumulation of Atg8-positive structures at the vacuolar membrane, suggesting late defects in the autophagic cascade. As expected, acc1S/A cells exhibit a reduction in acetate/acetyl-CoA availability along with elevated cellular lipid content. However, concomitant administration of acetate fails to fully revert the increase in autophagy exerted by acc1S/A Instead, administration of oleate, while mimicking constitutively active Acc1 in WT cells, alleviates the vacuolar fusion defects induced by Acc1 inhibition. Our results argue for a largely lipid-dependent process of autophagy regulation downstream of Acc1. We present a versatile genetic model to investigate the complex relationship between acetate metabolism, lipid homeostasis, and autophagy and propose Acc1-dependent lipogenesis as a fundamental metabolic path downstream of Snf1 to maintain autophagy and survival during cellular aging.

Keywords: AMPK; Acc1; Snf1; acetate; acetyl coenzyme A (acetyl-CoA); acetyl-CoA carboxylase 1; aging; autophagy; lipid metabolism; lipogenesis; oleate; yeast.


Conflict of interest statement

The authors declare that they have no conflicts of interest with the contents of this article

Figures

Figure 1.
Figure 1.
Acc1 activity correlates with autophagy levels. WT and acc1-S1157A mutant (acc1S/A) yeast cells were aged until the indicated time points on 2% glucose minimal medium. SorA or the solvent DMSO was applied 6 h after inoculation where indicated. A, schematic overview of the Acc1-regulated metabolic pathway. Acc1 activity can be modulated by SorA treatment (inhibition, red color) or the S1157A point mutation (activation, blue color). B, flow cytometric quantification of neutral lipids after BODIPY staining in a time course experiment. Relative fluorescence units were normalized to the WT at 24 h (n = 4). C and D, representative immunoblots (C) and quantification of free GFP/GAPDH (D), indicating autophagic flux (GFP liberation assay) of GFP-Atg8–expressing cells after 2 days of aging. Blots were probed with Acc1-, GFP-, or GAPDH-specific antibodies, and immunoblot signals were normalized to the WT. (n = 4). E and F, flow cytometric quantification of neutral lipids after BODIPY staining in a time course experiment (E) or after 24 h of incubation (day 1 of aging) (F). The arrow in E indicates the time of SorA application. Relative fluorescence units were normalized to the WT control at 24 h (n = 4 in E; n = 7 in F). G and H, representative immunoblots (G) and densitometric quantification of free GFP/GAPDH (H, left) or full-length GFP-Atg8/GAPDH levels (H, right) of GFP-Atg8–expressing cells at the indicated age (G) or after 2 days of aging (H). (n = 7). I, representative micrographs of 3-day-old cells according to G and H, demonstrating vacuolar localization of GFP indicative of autophagy (arrows show examples of autophagic cells) or punctate structures of GFP-Atg8. The arrowheads depict examples of cells with presumably enlarged pre-autophagosomal structures (1 fluorescence dot/cell), whereas open arrowheads show cells with accumulated autophagosomes (≥2 fluorescence puncta). Staining with PrI served to exclude dead cells from analysis. Bar, 5 μm. Dot plots show all data points along with the mean (line) ± S.D. (error bar). Line graphs show the mean ± S.D. p values indicate main effects (G, genotype; T, time; GxT, interaction between genotype and time) of a two-way mixed-model ANOVA, with time as repeated measures in B and E, Welch's t test in D, Welch's ANOVA post hoc Games–Howell in H, and ANOVA post hoc Tukey test in F. ***, p < 0.001 (compared with the respective WT); ##, p < 0.01; ###, p < 0.001 (compared with the respective untreated control, Control). FAS, fatty acid synthase; RFU, relative fluorescence units; a.u., arbitrary units.
Figure 2.
Figure 2.
Acc1 mediates autophagy regulation by AMPK under chronological aging conditions. WT or yeast AMPKα subunit SNF1-deleted cells (Δsnf1) combined with or without the acc1-S1157A mutation (acc1S/A) were aged for 2 days on inositol-supplemented 2% glucose minimal medium. SorA or the solvent DMSO was applied to cultures 6 h after inoculation where indicated. A, flow cytometric quantification of neutral lipids after BODIPY staining. Relative fluorescence units were normalized to the WT (n = 8). B and C, representative immunoblots (B) and densitometric quantification of free GFP/GAPDH (C) of GFP-Atg8–expressing cells. (n = 8). D, representative micrographs of GFP-Atg8–expressing cells according to A–C demonstrating vacuolar localization of GFP indicative of autophagy. Staining with PrI served to exclude dead cells from analysis. Bar, 5 μm. E, flow cytometric quantification of neutral lipids after BODIPY staining of cells with or without SorA treatment. Relative fluorescence units were normalized to the WT control (n = 8). F–H, representative immunoblots (F) and densitometric quantification of free GFP/GAPDH (G) or full-length GFP-Atg8/GAPDH levels (H) of GFP-Atg8–expressing cells with or without treatment with SorA (n = 8). I, representative micrographs of cells according to E–H. PrI served to exclude dead cells from analysis. Bar, 5 μm. Dot plots show all data points along with the mean (line) ± S.D. (error bar) ANOVA post hoc Tukey test is shown in A, C, E, G, and H. *, p < 0.05; **, p < 0.01; ***, p < 0.001 (compared with the respective WT); ##, p < 0.01; ###, p < 0.001 (comparison as indicated). RFU, relative fluorescence units; a.u., arbitrary units.
Figure 3.
Figure 3.
Acc1 activation stimulates autophagy in concert with changes in acetate/acetyl-CoA metabolism. WT or acc1-S1157A mutant (acc1S/A) yeast cells with or without supplementation of acetate or mevalonate as indicated were aged to the indicated time points. A and B, extracellular (A) and intracellular (B) acetate quantified by NMR from medium samples and cell extracts, respectively (n = 4). C and D, representative immunoblots (C) and densitometric quantification (D) of histone H3 lysine acetylation after 2 days of aging. Blots were probed with acetylated lysine 14 (K14Ac) or 18 (K18Ac) specific antibodies or antibodies reacting to total H3 or GAPDH, which served as loading control (n = 11–12 for K14Ac, n = 8 for K18Ac). E and F, representative immunoblots (E) and quantification (F) of C-terminally 6×HA-tagged Atg7 (Atg7-HA) using HA-specific antibodies. GAPDH served as loading control (n = 3–4). G and H, extracellular (culture supernatant) acetate (G) and flow cytometric quantification of neutral lipids after BODIPY staining (H), obtained from cultures receiving three consecutive additions of 100 mg/liter acetate to the medium (+ Ac). Arrows depict the times of acetate supplementation at 28, 34, and 40 h of incubation (n = 4). I and J, representative immunoblots of GFP-Atg8–expressing cells (I) and quantification of free GFP/GAPDH levels (J) by densitometry, after 2 days of aging according to G and H (n = 4). K, relative ergosterol levels (WT-normalized) quantified from shotgun MS-based lipidomics of lipid cell extracts (n = 4). L–N, representative immunoblots (L), densitometric quantification of free GFP/GAPDH (M), and neutral lipids after BODIPY staining (N) of GFP-Atg8–expressing cells after 2 days of aging and treatment with mevalonate (n = 8). O, representative micrographs of 2-day-old GFP-Atg8–expressing cells after mevalonate treatment. Staining with PrI served to exclude dead cells from analysis. Bar, 5 μm. Line graphs show means ± S.D. (error bars). Dot plots show all data points along with the mean (line) ± S.D. p values indicate main effects (genotype (G), time (T), and interaction between genotype and time (GxT)) of a two-way mixed-model ANOVA, with time as repeated measures in A and G. Welch's t test is used in B, D, F, and K, and ANOVA post hoc Tukey test is used in H, J, M, and N. *, p < 0.05; ***, p < 0.001 (compared with the WT); ###, p < 0.001 (compared with acc1S/A). RFU, relative fluorescence units; a.u., arbitrary units.
Figure 4.
Figure 4.
Inhibition of Acc1 accelerates aging without alterations in acetate/acetyl-CoA metabolism. WT and acc1-S1157A mutant (acc1S/A) yeast cells with or without SorA treatment were aged until the indicated time points on 2% glucose minimal medium. A, survival analysis of chronologically aging yeast assessed by cfu (clonogenicity) (n = 8). B, cell death assessed by PrI staining (PrI-positive cells) of cells according to A and quantified using flow cytometry (n = 8). C, extracellular acetate quantified enzymatically from culture supernatants (n = 4). D and E, densitometry-based quantification (D) and representative immunoblots (E) of histone H3 lysine 14 (K14) or 18 (K18) acetylation in WT cells (with and without SorA treatment) after 2 days of aging (n = 8). F and G, quantification (F) of C-terminally 6×HA-tagged Atg7 (Atg7–6HA) after 2 days of aging normalized to GAPDH by densitometry of immunoblots representatively shown in G (n = 7–8). Line graphs show means ± S.D. (error bars). Dot plots show all data points along with the mean (line) ± S.D. p values indicate main effects (time (T), genotype (G), and respective interactions (GxT)) of a two-way mixed-model ANOVA with time as repeated measures in B. ANOVA post hoc Tukey test is used in F, and Welch's t test is used in C and D. ***, p < 0.001 (compared with the respective untreated control; Control); #, p < 0.05; ##, p < 0.01; ###, p < 0.001 (compared with the respective WT). a.u., arbitrary units.
Figure 5.
Figure 5.
Acc1 promotes autophagy independent of inositol availability. WT or acc1-S1157A mutant (acc1S/A) yeast cells were aged on 2% glucose minimal medium and supplemented with extra 750 μm inositol (Inositol) or the solvent water (Control). A and B, intracellular (A) and extracellular (B) inositol quantified by NMR from cell extracts and culture supernatants, respectively, after 2 days of aging. (n = 4). C–E, representative micrographs (C), immunoblots (D), and densitometric quantification of free GFP (E, left) or full-length GFP-Atg8 (E, right) normalized to GAPDH of GFP-Atg8–expressing cells after 2 days of aging. Bar, 5 μm (n = 6). Dot plots show all data points along with the mean (line) ± S.D. (error bar). Dashed lines depict the lower limit of detection in A and B. p values indicate main effects (genotype (G), treatment (Trm), and interaction between genotype and treatment (GxTrm)) of a two-way ANOVA in E. **, p < 0.01 (compared with the respective untreated control; Control); ###, p < 0.001 (compared with the respective WT). n.d., not detectable. a.u., arbitrary units.
Figure 6.
Figure 6.
Acc1 inhibition disrupts autophagosome–vacuole fusion and vacuolar acidification. WT and acc1-S1157A mutant (acc1S/A) yeast cells were aged until the indicated time points on 2% glucose minimal medium. SorA or the solvent DMSO was applied to cultures 6 h after inoculation. A, representative micrographs of WT cells expressing GFP-Atg8 and the PAS marker Ape1-RFP after 10 or 14 h of incubation with SorA. Bar, 5 μm. B, representative micrographs of WT or ATG15 deletion mutant (Δatg15) cells expressing GFP-Atg8 and the vacuolar membrane marker Vph1-mCherry after 14 h of incubation with SorA. Bar, 5 μm. C, representative micrographs of cells stained with the vacuolar acidity indicator quinacrine after 24 h of incubation (day 1). Staining with PrI served to exclude dead cells from analysis. Bar, 5 μm. D, in vitro activity of the vacuolar protease Pep4 in whole-cell extracts at 14 h (top) or 24 h (bottom) after inoculation. Relative Pep4 activity was normalized to the WT (n = 3). Dot plots show all data points along with the mean (line) ± S.D. (error bar). Welch's t test is used in D.
Figure 7.
Figure 7.
Supplementation of oleic acid partly mimics acc1S/A mutation and overrides SorA treatment. WT yeast cells were supplemented with 0.01 or 0.03% (w/v) oleate or the solvent tergitol (Control) 6 h after inoculation and aged until the indicated time points on 2% glucose minimal medium. SorA or the solvent DMSO was applied to cultures 6 h after inoculation where indicated. A, flow cytometric quantification of neutral lipids after BODIPY staining of 2-day-old WT cells supplemented with oleate. Relative fluorescence units (RFU) were normalized to the WT control (n = 4). B and C, average acyl chain length of different classes of glycerolipids calculated from the lipidomic profiles according to Fig. S7 (A and B). B and C, the effects of 0.03% (w/v) oleate treatment (Oleate) (B) and of the acc1-S1157A mutation (acc1S/A) (C) compared with the respective solvent-treated (Control) or WT controls, respectively (n = 4). D, representative micrographs of 2-day-old GFP-Atg8–expressing WT cells supplemented with 0.03% (w/v) oleate. Bar, 5 μm. E, quantification of free GFP/GAPDH in WT cells from immunoblots representatively shown in E. Data were normalized to the solvent control (n = 4). F, representative immunoblots of 2-day-old GFP-Atg8–expressing WT, Δatg6, or Δatg7 cells. G, representative micrographs of cells expressing GFP-Atg8 and the vacuolar membrane marker Vph1-mCherry 30 h after inoculation (day 1). Bar, 5 μm. H and I, representative immunoblots (H) and densitometric quantification of free GFP/GAPDH (I, left) or full-length GFP-Atg8/GAPDH levels (I, right) of GFP-Atg8–expressing cells at 8 or 30 h after inoculation (n = 8). Dot plots show all data points along with the mean (line) ± S.D. (error bar). ANOVA post hoc Tukey test is used in A, E, and I. ***, p < 0.001 (compared with the respective untreated control); #, p < 0.05; ###, p < 0.001 (comparison as indicated). a.u., arbitrary units.
Figure 8.
Figure 8.
Metabolic alterations orchestrate Acc1-dependent autophagy. A scheme depicts a working model of how Acc1-dependent lipogenesis drives autophagy in aging cells. Upon Acc1 activation (or after supplementation of oleic acid), increased production of fatty acids and associated lipidomic alterations result in increased autophagic flux. In addition, autophagic activity may be co-regulated by acetate/acetyl-CoA availability upstream of Acc1's metabolic reaction. Mechanistically, Acc1-dependent metabolic consequences provide a cellular lipid profile that facilitates vacuolar fusion capacity and thus allows completion of the autophagic cascade.

Similar articles

Cited by

References

    1. Mercken E. M., Carboneau B. A., Krzysik-Walker S. M., and de Cabo R. (2012) Of mice and men: the benefits of caloric restriction, exercise, and mimetics. Ageing Res. Rev. 11, 390–398 10.1016/j.arr.2011.11.005 - DOI - PMC - PubMed
    1. de Cabo R., Carmona-Gutierrez D., Bernier M., Hall M. N., and Madeo F. (2014) The search for antiaging interventions: from elixirs to fasting regimens. Cell 157, 1515–1526 10.1016/j.cell.2014.05.031 - DOI - PMC - PubMed
    1. Rubinsztein D. C., Mariño G., and Kroemer G. (2011) Autophagy and aging. Cell 146, 682–695 10.1016/j.cell.2011.07.030 - DOI - PubMed
    1. López-Otín C., Galluzzi L., Freije J. M. P., Madeo F., and Kroemer G. (2016) Metabolic control of longevity. Cell 166, 802–821 10.1016/j.cell.2016.07.031 - DOI - PubMed
    1. Madeo F., Zimmermann A., Maiuri M. C., and Kroemer G. (2015) Essential role for autophagy in life span extension. J. Clin. Invest. 125, 85–93 10.1172/JCI73946 - DOI - PMC - PubMed

Publication types

MeSH terms