. 2019 Jun 28;6(3):ENEURO.0364-18.2019.
doi: 10.1523/ENEURO.0364-18.2019. Print 2019 May/Jun.

Cyfip1 Haploinsufficiency Does Not Alter GABAA Receptor δ-Subunit Expression and Tonic Inhibition in Dentate Gyrus PV+ Interneurons and Granule Cells

Affiliations

Cyfip1 Haploinsufficiency Does Not Alter GABAA Receptor δ-Subunit Expression and Tonic Inhibition in Dentate Gyrus PV+ Interneurons and Granule Cells

Simon Trent et al. eNeuro. .

Abstract

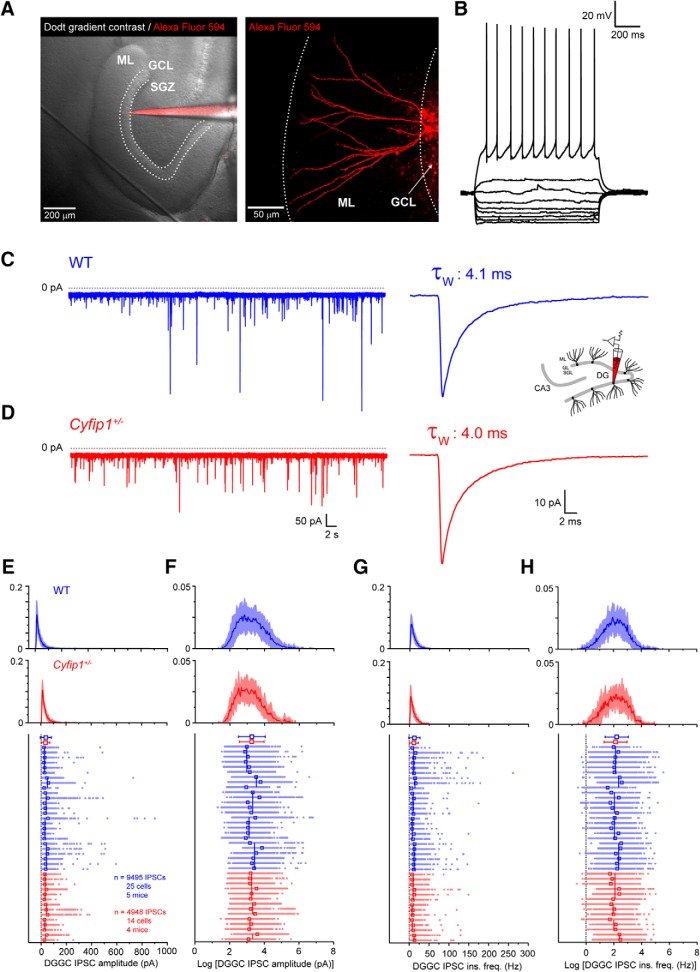
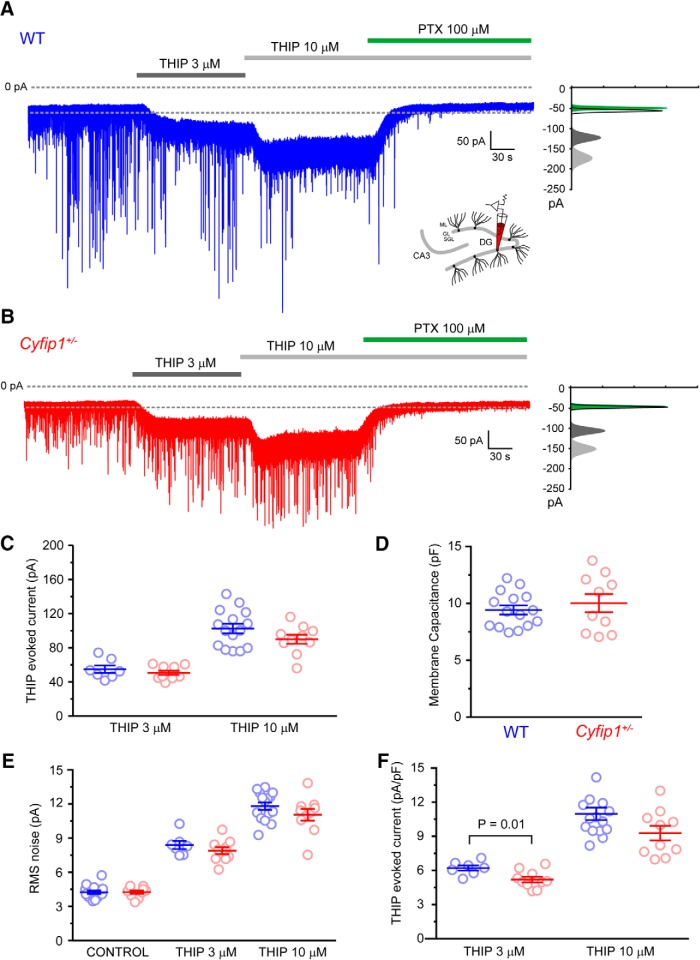
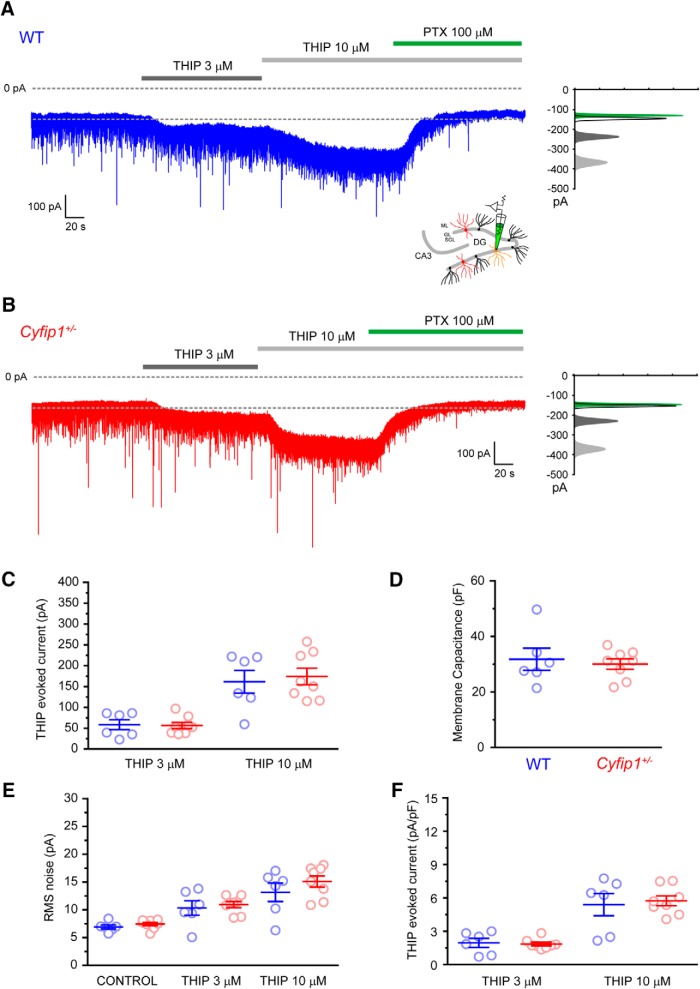
Copy number variation (CNV) at chromosomal region 15q11.2 is linked to increased risk of neurodevelopmental disorders including autism and schizophrenia. A significant gene at this locus is cytoplasmic fragile X mental retardation protein (FMRP) interacting protein 1 (CYFIP1). CYFIP1 protein interacts with FMRP, whose monogenic absence causes fragile X syndrome (FXS). Fmrp knock-out has been shown to reduce tonic GABAergic inhibition by interacting with the δ-subunit of the GABAA receptor (GABAAR). Using in situ hybridization (ISH), qPCR, Western blotting techniques, and patch clamp electrophysiology in brain slices from a Cyfip1 haploinsufficient mouse, we examined δ-subunit mediated tonic inhibition in the dentate gyrus (DG). In wild-type (WT) mice, DG granule cells (DGGCs) responded to the δ-subunit-selective agonist THIP with significantly increased tonic currents. In heterozygous mice, no significant difference was observed in THIP-evoked currents in DGGCs. Phasic GABAergic inhibition in DGGC was also unaltered with no difference in properties of spontaneous IPSCs (sIPSCs). Additionally, we demonstrate that DG granule cell layer (GCL) parvalbumin-positive interneurons (PV+-INs) have functional δ-subunit-mediated tonic GABAergic currents which, unlike DGGC, are also modulated by the α1-selective drug zolpidem. Similar to DGGC, both IPSCs and THIP-evoked currents in PV+-INs were not different between Cyfip1 heterozygous and WT mice. Supporting our electrophysiological data, we found no significant change in hippocampal δ-subunit mRNA expression or protein level and no change in α14-subunit mRNA expression. Thus, Cyfip1 haploinsufficiency, mimicking human 15q11.2 microdeletion syndrome, does not alter hippocampal phasic or tonic GABAergic inhibition, substantially differing from the Fmrp knock-out mouse model.

Keywords: CYFIP1; GABA; dentate gyrus; neurodevelopmental; tonic inhibition.


Figures

Figure 1.
Figure 1.
IPSCs in DGGCs of WT and Cyfip1+/– mice. A, Dodt gradient contrast image of a horizontal section of the hippocampus. Dashed lines illustrate the border between the ML, GCL, and subgranular zone (SGZ). Patch pipette filled with Alexa Fluor 594 (left) illustrates the position of a mature DGGC (right), imaged by two-photon microscopy, with dendrites projecting to the edge of the ML. B, Traces depicting typical electrophysiological properties of a mature DGGC. C, A typical voltage clamp recording showing IPSCs from DGGC of WT mouse and the averaged IPSC from this cell. Inset schematic shown here and elsewhere signifies data recorded DGGC. D, A typical voltage clamp recording showing IPSCs from DGGC of Cyfip1+/– mouse and the mean IPSC from this cell. E, Histograms showing the mean (red/blue lines) and standard deviation (light blue/red shading) of the log–normal distribution of all IPSC amplitudes recorded in WT and Cyfip1+/– DGGC. Scatter plot shows the amplitude of individual IPSCs grouped by cell, mouse, and genotype. Individual IPSCs from each cell are shown as aligned dots (light blue/red) with the mean IPSC amplitude for each cell shown as an unfilled superimposed square (red/blue). Varying length vertical lines (blue/red) represent the mean IPSC amplitude for each animal with the length of the bar illustrating the number of recorded neurons from each mouse. Red/blue symbols (top) are the arithmetic mean and standard deviation of the complete dataset for each genotype. F, As in E but for log-transformed IPSC amplitude data. G, As in E but for IPSC instantaneous frequency data. H, As in E but for log-transformed IPSC frequency data.
Figure 2.
Figure 2.
THIP-evoked currents in DGGC of WT and Cyfip1+/– mice. A, Trace showing PTX-sensitive concentration-dependent THIP-evoked currents in a DGGC from a WT mouse. All-points histogram illustrates the shift in holding current and RMS noise induced by THIP and PTX. B, As in A for DGGC in Cyfip1+/– mouse. C, Scatter plot summarizing the THIP-evoked currents in WT (blue) and Cyfip1+/– DGGC. D, Scatter plot summarizing membrane capacitance of WT (blue) and Cyfip1+/– DGGC. E, Scatter plot summarizing the THIP-evoked changes in RMS noise in WT (blue) and Cyfip1+/– DGGC. F, Scatter plot summarizing the normalized (pA/PF) THIP-evoked current in WT (blue) and Cyfip1+/– DGGC.
Figure 3.
Figure 3.
IPSCs in GCL PV+-INs of WT and Cyfip1+/– mice. A, Dodt gradient contrast image of a horizontal section of the hippocampus. Dashed lines illustrate the border between the ML, GCL, and SGZ. An example of PV+-INs in the DG GCL identified by expression of the red fluorescent protein tdTomato filled via the recording electrode with Alexa Fluor 488 (right). B, Traces depicting typical electrophysiological properties of a GCL PV+-INs. Inset shows the shorter half-width of a typical PV+-IN action potential compared to that of a typical DGGC. C, Voltage clamp recording showing IPSCs from PV+-INs of WT mouse and the averaged IPSC from this cell. Inset schematic shown here and elsewhere signifies data recorded PV+-INs. D, A typical voltage clamp recording showing IPSCs from PV+-INs of Cyfip1+/– mouse and the mean IPSC from this cell. E, Histograms showing the mean (red/blue lines) and standard deviation (light blue/red shading) of the log –normal distribution of all IPSC amplitudes recorded in WT and Cyfip1+/– PV+-INs. Scatter plot shows the amplitude of individual IPSCs group by cell, mouse, and genotype. Individual IPSCs from each cell are shown as aligned dots (light blue/red) with the mean IPSC amplitude for each cell shown as an unfilled superimposed square (red/blue). Varying length vertical lines (blue/red) represent the mean IPSC amplitude for each animal with the length of the bar illustrating the number of recorded neurons from each mouse. Red/blue symbols (top) are the arithmetic mean and standard deviation of the complete dataset for each genotype. F, As in E but for log-transformed IPSC amplitude data. G, As in E but for IPSC instantaneous frequency data. H, As in E but for log-transformed IPSC frequency data.
Figure 4.
Figure 4.
THIP-evoked currents in PV+-INs of WT and Cyfip1+/– mice. A, Trace showing PTX-sensitive concentration-dependent THIP-evoked currents in a PV+-IN from a WT mouse. All-points histogram illustrates the shift in holding current and RMS noise induced by THIP and PTX. B, As in A for PV+-INs in Cyfip1+/– mouse. C, Scatter plot summarizing the THIP-evoked currents in WT (blue) and Cyfip1+/– PV+-INs. D, Scatter plot summarizing membrane capacitance of WT (blue) and Cyfip1+/– PV+-INs. E, Scatter plot summarizing the THIP-evoked changes in RMS noise in WT (blue) and Cyfip1+/– DGGC. F, Scatter plot summarizing the normalized (pA/PF) THIP-evoked current in WT (blue) and Cyfip1+/– DGGC.
Figure 5.
Figure 5.
Molecular assessment of δ and other key GABAA subunits in WT and Cyfip1+/– mice. A, mRNA expression of δ GABAA subunit (Gabrd) in hippocampal subfields (CA1, CA3, DG) of WT and Cyfip1+/– adult mice were measured by ISH and given as absolute mean optical density values ± SEM (n = 6 per genotype). Once ANOVA revealed a main effect for brain region, Dunnett’s test was used for post hoc analysis to determine the sources of significance (DG vs CA1 and DG vs CA3, ***p < 0.0001). Representative autoradiographs show two coronal WT mouse brain sections hybridized with an oligonucleotide probe targeting Gabrd. B, Expression of GABAA δ-, α4-, and α1-subunits (equivalent to Gabrd, Gabra4, and Gabra1 genes) were measured by qRT-PCR mRNA expression in adult whole hippocampus and given as mean delta Ct values ± SD relative to two housekeeping genes, Gapdh and Hprt (n = 14 per genotype, 1 outlier removed in Gabra4 data). C, As in B, qRT-PCR was used to measure Gabrd mRNA expression in juvenile WT and Cyfip1+/– mice (n = 10 per genotype). D, Hippocampal protein levels of δ GABAA were measured by immunofluorescent Western blotting in WT and Cyfip1+/– mice. Cyfip1+/– densitometric data given relative to the average of all WT samples (100%) and normalized to protein loading control, calnexin (WT: n = 9, Cyfip1+/–: n = 8). Representative immunofluorescent blot shows Gabrd and calnexin bands in WT and Cyfip1+/– mouse samples.
Figure 6.
Figure 6.
Tonic inhibition in PV+-INs is sensitive to extracellular GABA concentration and modulated by the α1-selective ligand zolpidem. A, Example traces showing the ∼3-fold larger basal tonic GABA current in PV+-INs compared to DGGCs revealed by application of the GABAA antagonist PTX. B, Example traces showing the modulation of tonic inhibition in PV+-INs and DGGCs by the elevation of extracellular GABA concentration using NNC711 (10 μM) and GABA (5 μM). C, Example traces showing the modulation of tonic inhibition in PV+-INs, but not DGGCs, by the α1-selective ligand zolpidem. D, Scatter plots summarizing the changes in holding current (ΔIhold) in DGGCs and PV+-INs reflecting the basal tonic GABAergic inhibition, the current induced by NNC/GABA, the tonic GABA current in NNC/GABA and the current induced by zolpidem. E, As in D for normalized currents (pA/pF). F, As in D for changes in RMS noise.

Similar articles

Cited by

References

    1. Aimone JB, Li Y, Lee SW, Clemenson GD, Deng W, Gage FH (2014) Regulation and function of adult neurogenesis: from genes to cognition. Physiol Rev 94:991–1026. 10.1152/physrev.00004.2014 - DOI - PMC - PubMed
    1. Ascano M Jr, Mukherjee N, Bandaru P, Miller JB, Nusbaum JD, Corcoran DL, Langlois C, Munschauer M, Dewell S, Hafner M, Williams Z, Ohler U, Tuschl T (2012) FMRP targets distinct mRNA sequence elements to regulate protein expression. Nature 492:382–386. 10.1038/nature11737 - DOI - PMC - PubMed
    1. Bartos M, Vida I, Frotscher M, Geiger JR, Jonas P (2001) Rapid signaling at inhibitory synapses in a dentate gyrus interneuron network. J Neurosci 21:2687–2698. 10.1523/JNEUROSCI.21-08-02687.2001 - DOI - PMC - PubMed
    1. Bartos M, Vida I, Frotscher M, Meyer A, Monyer H, Geiger JR, Jonas P (2002) Fast synaptic inhibition promotes synchronized gamma oscillations in hippocampal interneuron networks. Proc Natl Acad Sci USA 99:13222–13227. 10.1073/pnas.192233099 - DOI - PMC - PubMed
    1. Bassell GJ, Warren ST (2008) Fragile X syndrome: loss of local mRNA regulation alters synaptic development and function. Neuron 60:201–214. 10.1016/j.neuron.2008.10.004 - DOI - PMC - PubMed

Publication types

LinkOut - more resources