. 2019 Jun 17;10(1):2669.
doi: 10.1038/s41467-019-10502-8.

Mediator complex interaction partners organize the transcriptional network that defines neural stem cells

Affiliations

Mediator complex interaction partners organize the transcriptional network that defines neural stem cells

Marti Quevedo et al. Nat Commun. .

Erratum in

Abstract

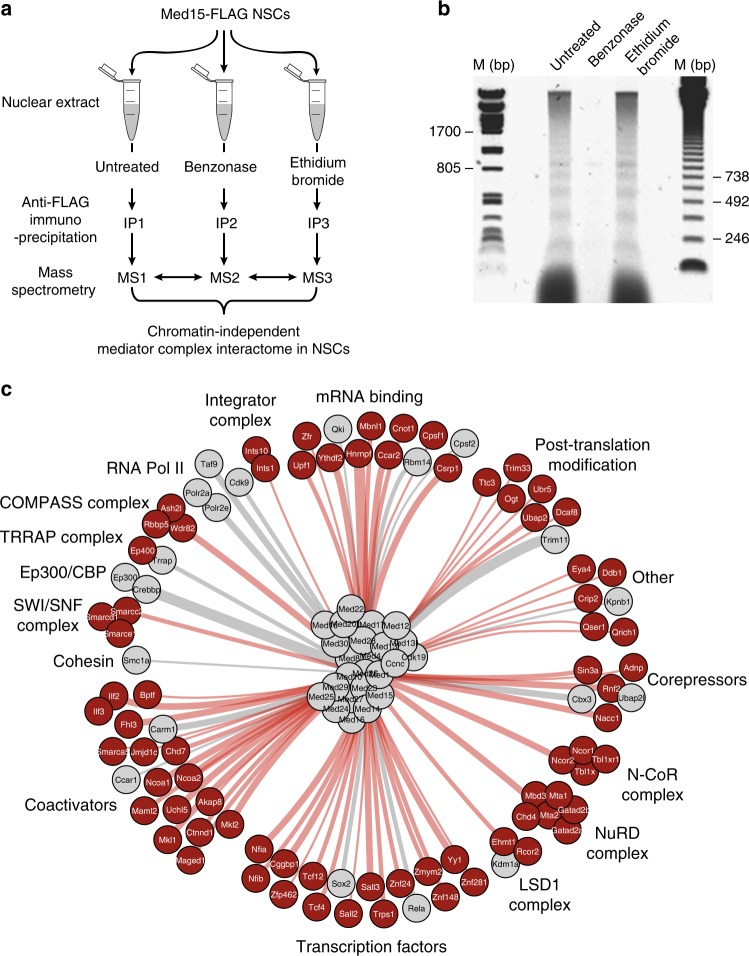
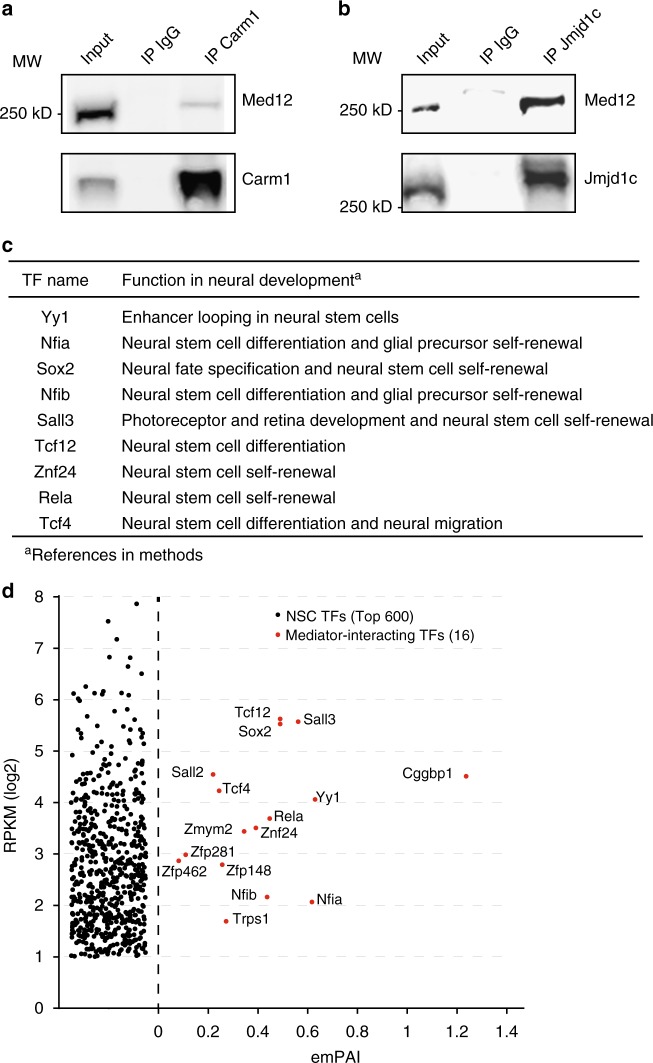
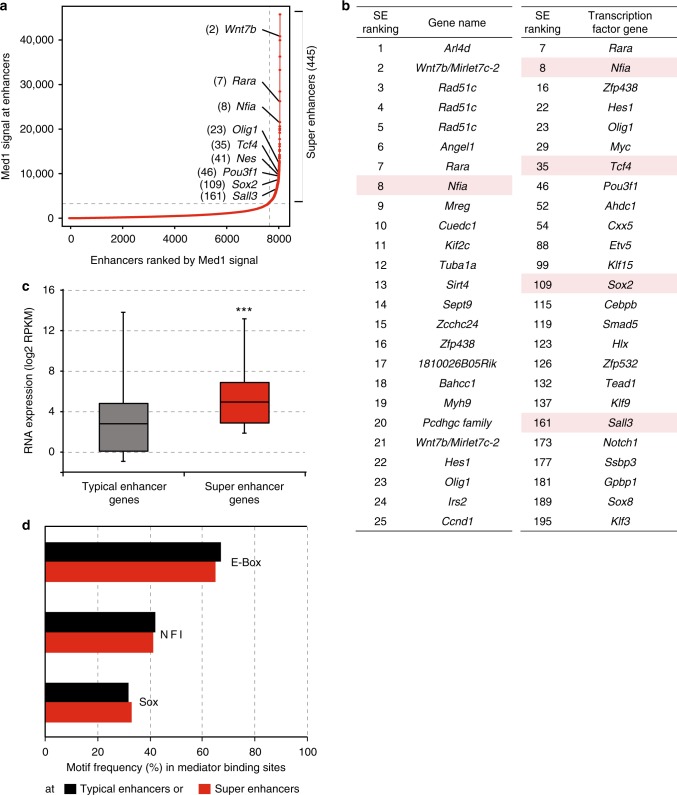
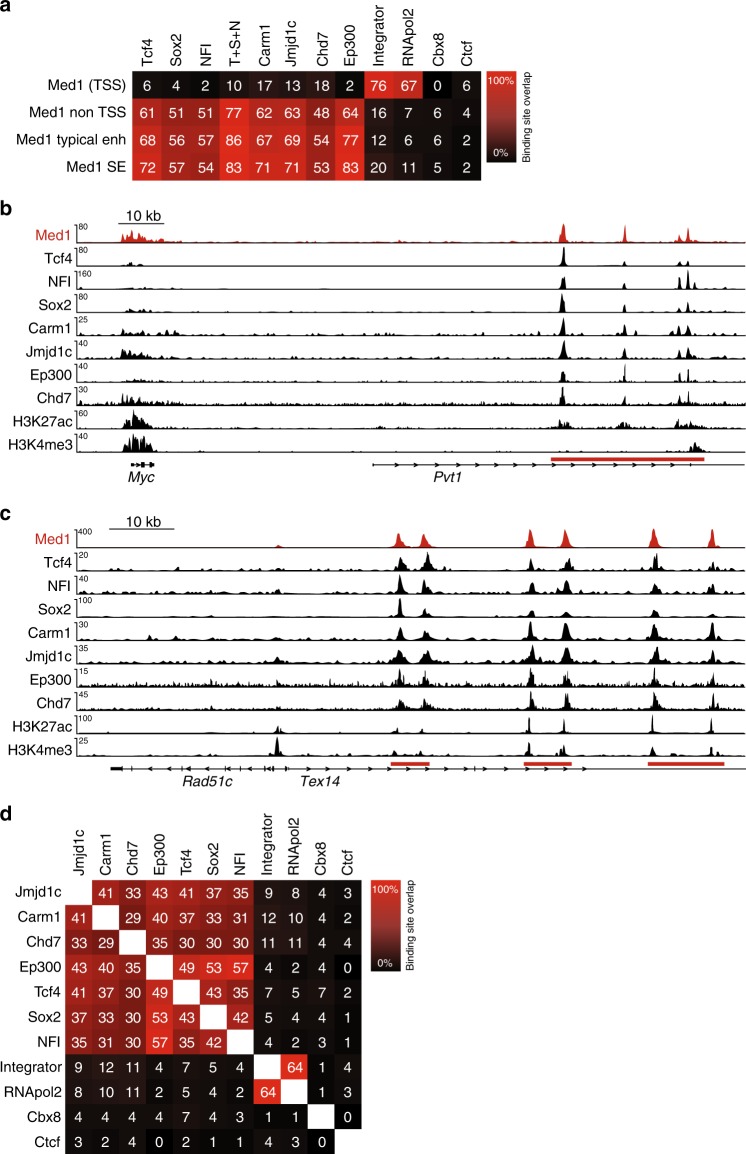
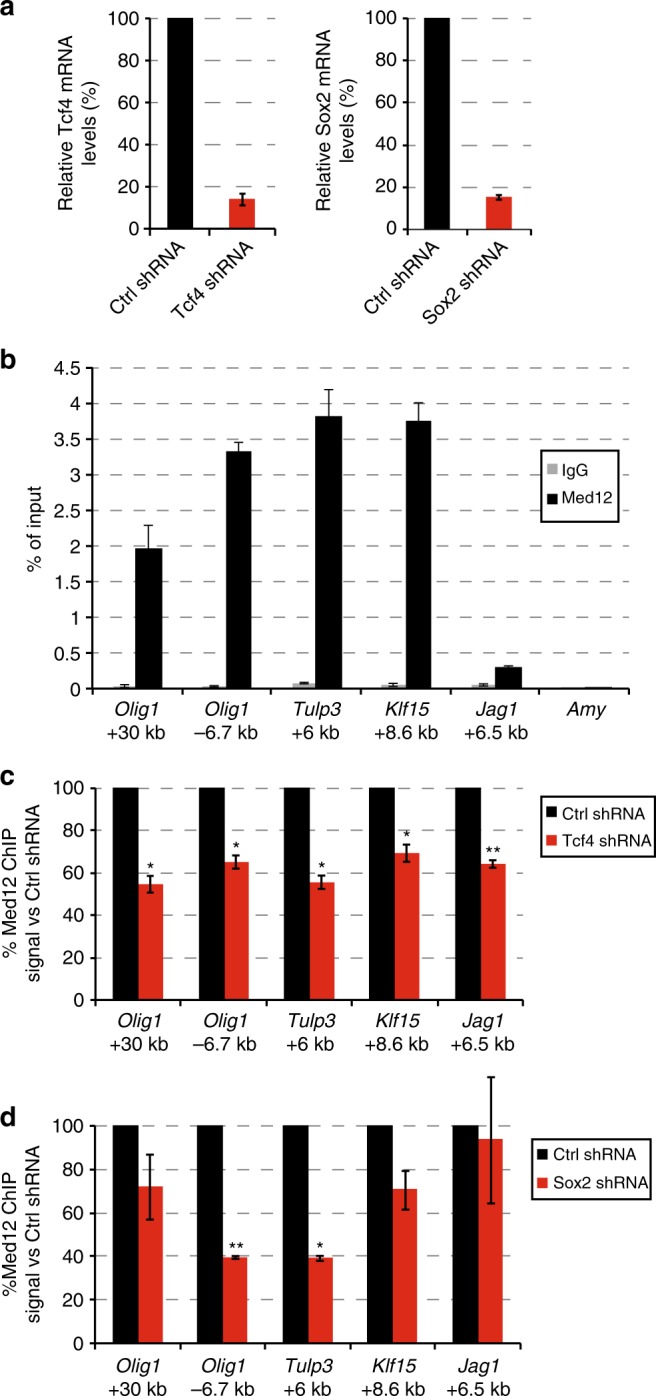
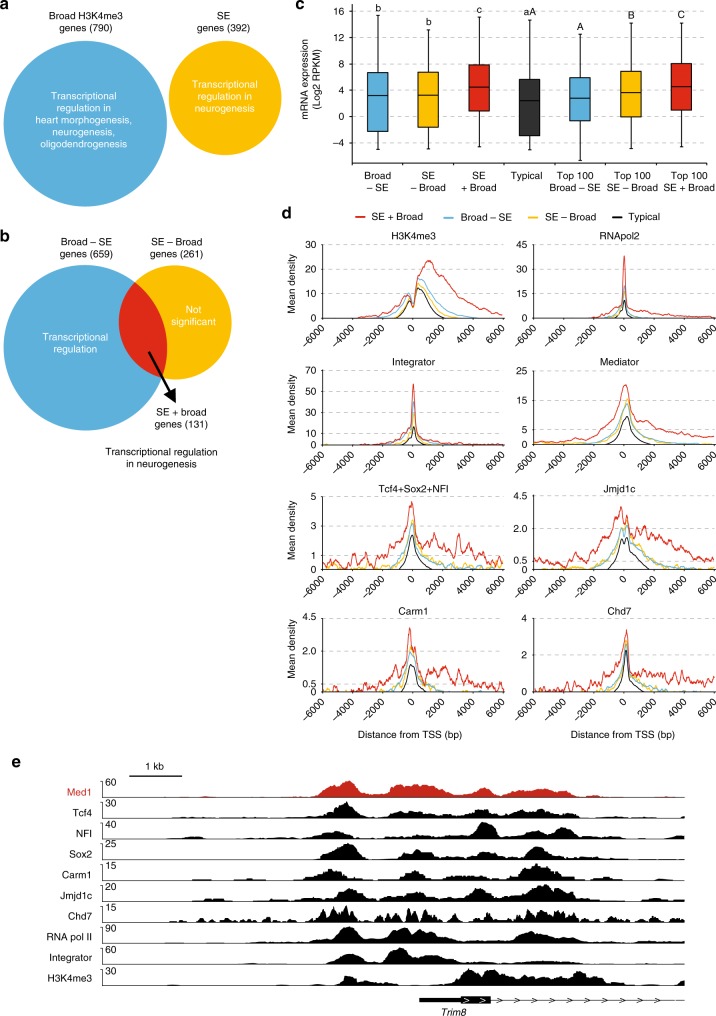
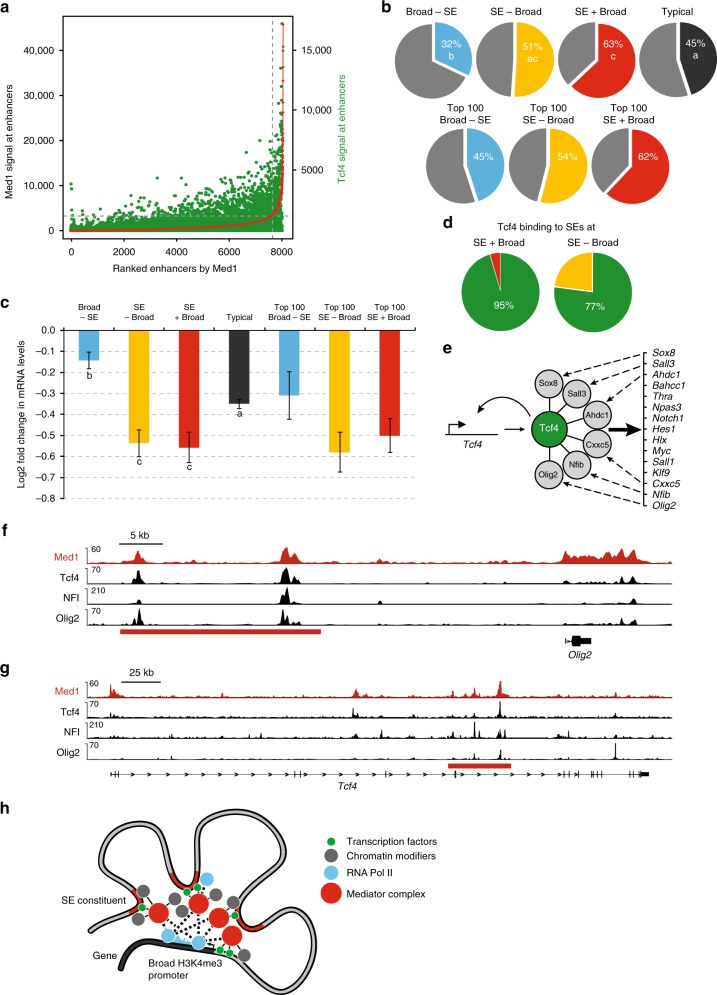
The Mediator complex regulates transcription by connecting enhancers to promoters. High Mediator binding density defines super enhancers, which regulate cell-identity genes and oncogenes. Protein interactions of Mediator may explain its role in these processes but have not been identified comprehensively. Here, we purify Mediator from neural stem cells (NSCs) and identify 75 protein-protein interaction partners. We identify super enhancers in NSCs and show that Mediator-interacting chromatin modifiers colocalize with Mediator at enhancers and super enhancers. Transcription factor families with high affinity for Mediator dominate enhancers and super enhancers and can explain genome-wide Mediator localization. We identify E-box transcription factor Tcf4 as a key regulator of NSCs. Tcf4 interacts with Mediator, colocalizes with Mediator at super enhancers and regulates neurogenic transcription factor genes with super enhancers and broad H3K4me3 domains. Our data suggest that high binding-affinity for Mediator is an important organizing feature in the transcriptional network that determines NSC identity.


Conflict of interest statement

The authors declare no competing interests.

Figures

Fig. 1
Fig. 1
Mediator complex interactome in neural stem cells. a Schematic representation of Mediator complex purifications from neural stem cells (NSCs) expressing Med15-FLAG. Mass spectrometry results of the three conditions were compared to select proteins that do not decrease in abundance upon treatments as chromatin-independent Mediator complex interactors. IP immunoprecipitation, MS Mass spectrometry. b Agarose gel with DNA from untreated NSC nuclear extract or nuclear extract treated with Benzonase or Ethidium Bromide, as indicated. DNA size markers (M) are indicated. Source data are provided as a Source Data file. c Interactome of the Mediator complex in NSCs. Novel Mediator interaction partners are in red, known Mediator interaction partners are in grey. Thickness of the edges gives an indication of the relative molar protein quantity observed in the purified Mediator complex samples
Fig. 2
Fig. 2
Mediator complex interactor validation. a Immunoprecipitation (IP) of Carm1 and Med12 by a Carm1 antibody from NSC nuclear extract. Western blots are probed with the indicated antibodies. Control IP by rabbit IgG and 5% input are also shown. Source data are provided as a Source Data file. b Immunoprecipitation (IP) of Jmjd1c and Med12 by Jmjd1c antibody from NSC nuclear extract. Western blots are probed with the indicated antibodies. Control IP by rabbit IgG and 5% input are also shown. Source data are provided as a Source Data file. c Function in neural development of identified Mediator-interacting transcription factors in NSCs. References are provided in the Methods. d mRNA levels in NSCs of Mediator-interacting transcription factors (TFs) and the Top 600 highest expressed TFs in NSCs. The average emPAI scores, a semi-quantitative mass spectrometry-based measure of molar amounts, in the four Mediator complex purifications is shown for Mediator–interacting TFs
Fig. 3
Fig. 3
Super enhancers in neural stem cells. a Distribution of Med1 ChIP-seq signal (total reads) in enhancer regions in NSCs. 445 enhancers regions in the right upper quadrant are postulated as super enhancers. Examples of genes near super enhancers and the super enhancer rank are indicated. Source data are provided as a Source Data file. b Top 25 super enhancers (SEs) in NSCs, ranked by Mediator content, and their nearest active gene (left panel). Top 25 active transcription factor genes nearest to SEs (Right panel). SE rank is indicated. Genes encoding transcription factors that we identified as Mediator interactors are red-shaded. c Distribution of mRNA expression in NSCs of active genes nearest to SEs and active genes nearest to typical enhancers, but not nearest to SEs. Whiskers represent ultimate range. Significance of the difference in mRNA levels between two gene categories was assessed by Student t-test (***p < 0.001). Source data are provided as a Source Data file. d Most frequent transcription factor DNA motifs in Mediator-binding sites at typical enhancers and SEs. Motif frequency is indicated as the percentage of all Mediator-binding sites at typical enhancers or SEs that harbour this motif
Fig. 4
Fig. 4
Binding site overlap of Mediator complex and its interactors. a Percentage overlap of genome-wide binding sites of Mediator (Med1) with Mediator-interactors Tcf4, Sox2, NFI (Nfia + Nfib), Carm1, Jmjd1c, Chd7, Ep300, Integrator complex (Ints11 subunit), and RNApol2 in NSCs. Cbx8 and Ctcf were not identified as Mediator interactors and serve as negative controls. Percentages overlap of binding sites, as determined by ChIP-seq, are indicated. T + S + N, sum of the binding sites of Tcf4, Sox2, and NFI. TSS, within 1 kb of a transcription start site. b Overlap of binding sites of Mediator (Med1) with binding sites of Mediator interactors at the Myc locus in NSCs. ChIP-seq tracks for the indicated proteins and histone modifications at the Myc gene are shown. The Myc SE in the adjacent (inactive) Pvt gene is indicated with a red bar. Range of reads per million per base pair is indicated on the y-axis. Scale bar is indicated. c Overlap of binding sites of Mediator (Med1) with binding sites of Mediator interactors at the Rad51c locus in NSCs. ChIP-seq tracks for the indicated proteins and histone modifications at the Rad51c gene are shown. The Rad51c SEs in the adjacent (inactive) Tex10 gene are indicated with red bars. Range of reads per million per base pair is indicated on the y-axis. Scale bar is indicated. d Overlap of genome-wide binding sites of Mediator interactors and Cbx8 and Ctcf in NSCs. Percentages overlap of binding sites, as determined by ChIP-seq, are indicated
Fig. 5
Fig. 5
Mediator genome recruitment upon knock-down of Tcf4 or Sox2. a Relative mRNA levels of Tcf4 48 h after transfection with pSuper-Tcf4-shRNA or pSuper-control-shRNA (left panel), Relative mRNA levels of Sox2 46 h after transfection with pSuper-Sox2-shRNA or pSuper-control-shRNA (right panel). Source data are provided as a Source Data file. b Mediator ChIP signal on selected enhancers at the indicated distances from the TSS of the indicated genes. RT-PCR signals on the indicated genome areas of Med12 ChIP (Med12) and control rabbit IgG ChIP (IgG) are indicated as percentage of chromatin input. Amylase (Amy) functions as a negative control genomic region. S.e.m. is indicated of two independent experiments. Source data are provided as a Source Data file. c Mediator ChIP signal at selected enhancers upon knock-down of Tcf4. Med12 ChIP RT-PCR signals on the indicated genome areas in NSCs transfected with a plasmid expressing Tcf4-shRNA are indicated as percentage of the ChIP signal of NSCs transfected with a plasmid expressing control shRNA. S.e.m. is indicated of two independent experiments. Significance of the difference in Med12 ChIP signal between Tcf4-depleted NSCs and control NSCs was assessed by an unpaired Student t-test (*p < 0.05, **p < 0.01). Source data are provided as a Source Data file. d Mediator ChIP signal at selected enhancers upon knock-down of Sox2. Med12 ChIP RT-PCR signals on the indicated genome areas in NSCs transfected with a plasmid expressing Sox2-shRNA are indicated as percentage of the ChIP signal of NSCs transfected with a plasmid expressing control shRNA. S.e.m. is indicated of two independent experiments. Significance of the difference in Med12 ChIP signal between Sox2-depleted NSCs and control NSCs was assessed by an unpaired Student t-test (*p < 0.05, **p < 0.01). Source data are provided as a Source Data file
Fig. 6
Fig. 6
Mediator complex and its interactors at promoters. a Predominant Gene Ontology terms for genes with broad H3k4me3 promoters and for active genes nearest to SEs (SE genes) in NSCs. Numbers of genes in each category are indicated between brackets. b Overlap of genes with broad H3K4me3 promoters and SE genes in NSCs. Venn diagram with the two categories of genes, their overlap and their predominant Gene Ontology terms is shown. Numbers of genes in each category are indicated between brackets. c Distribution of mRNA levels in NSCs of the different categories of active genes. Box plots based on RNA-seq triplicate data are shown. Broad-SE, broad H3K4me3 promoter genes not nearest to SE. SE-Broad, SE genes without broad H3K4me3 promoter. SE + Broad, SE genes with broad H3K4me3 promoter. Typical, genes nearest to a typical enhancer but not nearest to an SE and without a broad H3K4me3 promoter. mRNA levels of all genes and top 100 genes within each category are shown. Statistically significant differences between groups are indicated as separate letters above the box plots, as assessed by Student t-tests comparing all gene subsets (lower case letters) or top 100 subsets (upper case letters). p < 0.001 except for B, p < 0.05. If the letters are the same, the difference between these groups is not significant. Source data are provided as a Source Data file. d ChIP-seq density plots around promoters of the different categories of genes for the indicated factors and histone modifications. Mean ChIP-seq density (y-axis) and distance to TSS (x-axis) are shown. e Overlap of binding sites of Med1 with binding sites of Mediator interactors at the Trim8 broad H3K4me3 promotor area in NSCs. ChIP-seq tracks for the indicated proteins and histone modifications at the Trim8 gene are shown. Range of reads per million per base pair is indicated on the y-axis. Scale bar is indicated
Fig. 7
Fig. 7
Tcf4 regulates neurogenic transcription factor genes with super enhancers and broad H3K4me3 promoters. a Tcf4 signal at enhancers ranked by Med1 content. Tcf4 ChIP-seq read content is in green, enhancers ranked by Med1 ChIP-seq read content is in red. b Percentages of downregulated genes in the different categories upon Tcf4 knock-down in NSCs. Percentages of down-regulated genes in all genes and top 100 genes within each category are shown. Statistically significant differences between groups are indicated as separate letters in the pie charts, p < 0.001 as assessed by Student t-tests. c Changes in mRNA levels of the different categories of genes upon Tcf4 knock-down in NSCs. Log2 fold change, based on RNA-seq data, is shown. Error bars indicate S.e.m., based on the RNA-seq triplicates. Statistically significant differences between groups are indicated as separate letters below the box plots, p < 0.001 as assessed by Student t-tests. Source data are provided as a Source Data file. d Percentage of Tcf4-bound SEs in SE + Broad genes or SE-Broad genes in NSCs. SEs nearest to SE + Broad genes or SE-Broad genes with or without significant Tcf4 binding sites, as determined by ChIP-seq, were counted. e Model of Tcf4-driven feed-forward transcriptional circuit of SE + Broad TF genes in NSCs. Fifteen15 SE + Broad TF genes bound at their SE and activated by Tcf4 are indicated. Tcf4 also binds its own SE. TF proteins encoded by six target genes also interact with Tcf4 protein and may aid in transcriptional regulation by Tcf4. f, g Overlap of binding sites of Tcf4 and Med1 with Tcf4-interactors Olig2 and NFI at the Olig2 gene (f) or Tcf4 gene (g) in NSCs. ChIP-seq tracks for the indicated proteins are shown. SE is indicated with a red bar. Range of reads per million per base pair is indicated on the y-axis. Scale bar is indicated. h Model of SE-Broad H3K4me3 promoter assemblies. TFs at SE constituents and the Broad H3K4me3 promoter recruit high levels of Mediator complex into SE-Broad assemblies. In turn, Mediator recruits high levels of protein–protein interaction partners such as the RNApol2 complex, Integrator, and chromatin modifiers. This would result in efficient pause-release of RNApol2 and high but TF-regulated levels of transcription

Similar articles

Cited by

References

    1. Jeronimo C, Robert F. The mediator complex: at the nexus of RNA polymerase II transcription. Trends Cell Biol. 2017;27:765–783. doi: 10.1016/j.tcb.2017.07.001. - DOI - PubMed
    1. Poss ZC, Ebmeier CC, Taatjes DJ. The Mediator complex and transcription regulation. Crit. Rev. Biochem. Mol. Biol. 2013;48:575–608. doi: 10.3109/10409238.2013.840259. - DOI - PMC - PubMed
    1. Malik S, Roeder RG. The metazoan Mediator co-activator complex as an integrative hub for transcriptional regulation. Nat. Rev. Genet. 2010;11:761–772. doi: 10.1038/nrg2901. - DOI - PMC - PubMed
    1. Conaway RC, Conaway JW. Function and regulation of the Mediator complex. Curr. Opin. Genet. Dev. 2011;21:225–230. doi: 10.1016/j.gde.2011.01.013. - DOI - PMC - PubMed
    1. Borggrefe T, Yue X. Interactions between subunits of the Mediator complex with gene-specific transcription factors. Semin. Cell. Dev. Biol. 2011;22:759–768. doi: 10.1016/j.semcdb.2011.07.022. - DOI - PubMed

Publication types

MeSH terms

Substances