. 2019 Jun 17;6(1):96.
doi: 10.1038/s41597-019-0103-9.

Multitask learning and benchmarking with clinical time series data

Affiliations

Multitask learning and benchmarking with clinical time series data

Hrayr Harutyunyan et al. Sci Data. .

Abstract

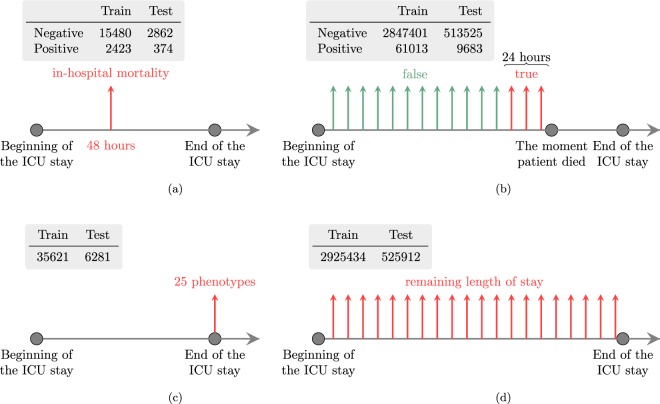
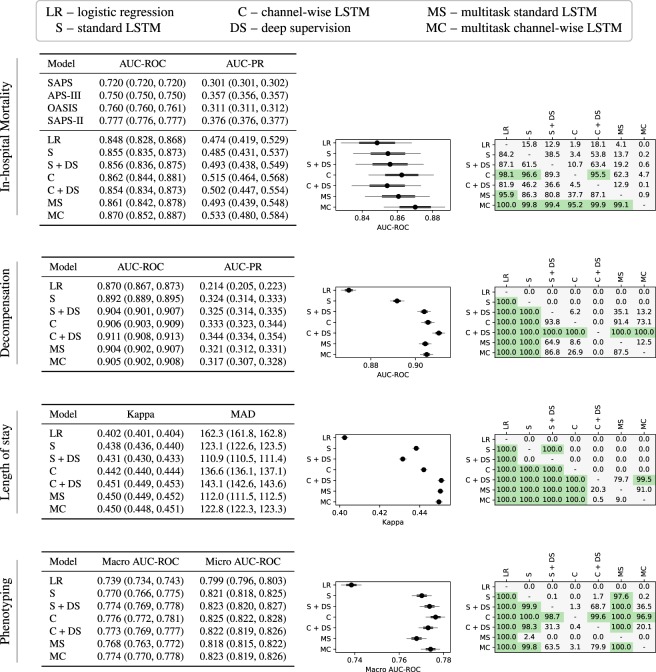
Health care is one of the most exciting frontiers in data mining and machine learning. Successful adoption of electronic health records (EHRs) created an explosion in digital clinical data available for analysis, but progress in machine learning for healthcare research has been difficult to measure because of the absence of publicly available benchmark data sets. To address this problem, we propose four clinical prediction benchmarks using data derived from the publicly available Medical Information Mart for Intensive Care (MIMIC-III) database. These tasks cover a range of clinical problems including modeling risk of mortality, forecasting length of stay, detecting physiologic decline, and phenotype classification. We propose strong linear and neural baselines for all four tasks and evaluate the effect of deep supervision, multitask training and data-specific architectural modifications on the performance of neural models.


Conflict of interest statement

The authors declare no competing interests.

Figures

Fig. 1
Fig. 1
Summaries of the four benchmark tasks. Each subfigure consists of two parts. The table lists number of prediction instances for the corresponding task. The timeline shows when the predictions are done. Note that in the decompensation and length-of-stay prediction tasks predictions are done hourly, and each vertical arrow corresponds to one prediction instance. (a) In-hospital mortality. (b) Decompensation. (c) Phenotyping. (d) Length of stay.
Fig. 2
Fig. 2
Results for in-hospital mortality, decompensation, length-of-stay, and phenotype prediction tasks. A subfigure corresponding to a benchmark task has three parts. The first part is a table that lists the values of the metrics for all models along with 95% confidence intervals obtained by resampling the test set K times with replacement (K = 10000 for in-hospital mortality and phenotype prediction task, while for decompensation and length-of-stay prediction tasks K = 1000). For all metrics except MAD, larger values are better. The second part visualizes the confidence intervals for the main metric of the corresponding task. The black circle corresponds to the mean value of K iterations. The thick black line shows standard deviation and narrow grey line shows 95% confidence interval. The third part shows the significance of the difference between the models. We count the number of resampled tests sets on which the i-th model performed better than the j-th model (denoted by ci,j). The cell at the i-th row and the j-th column of the table shows the percentage of ci,j in K. We say that the i-th model is significantly better than the j-th model if ci,j/K > 0.95 and highlight the corresponding cell of the table.
Fig. 3
Fig. 3
Calibration of in-hospital mortality and decompensation prediction by the best linear, non-multitask and multitask LSTM-based models. The plots show predicted probability computed by creating decile bins of predictions and then taking the mean value within each bin vs. actual probability (the rate of mortality within each bin). (a) In-hospital mortality. (b) Decompensation.
Fig. 4
Fig. 4
Receiver operating characteristic curves for the best linear, non-multitask and multitask LSTM-based models. (a) In-hospital mortality. (b) Decompensation.
Fig. 5
Fig. 5
In-hospital mortality and phenotype prediction performance vs. length-of-stay. The plots show the performance of the best non-multitask prediction baselines on the test data of different length-of-stay buckets. The confidence intervals and standard deviations are estimated with bootstrapping on the data of each bucket. (a) In-hospital mortality. (b) Phenotype.
Fig. 6
Fig. 6
Prediction of channel-wise LSTM baseline with deep supervision for decompensation prediction over time. Each row shows the last 100 hours of a single ICU stay. Darker colors mean high probability predicted by the model. Red and blue colors indicate the ground-truth label is negative and positive, respectively. Ideally, the right image should be all white, and the left image should be all white except the right-most 24 hours, which should be all dark blue.
Fig. 7
Fig. 7
Benchmark generation process.
Fig. 8
Fig. 8
Distribution of length of stay (LOS). (a) The distribution of LOS for full ICU stays and remaining LOS per hour. The rightmost 5% of both distributions are not shown to keep the plot informative. (b) Histogram of bucketed patient and hourly remaining LOS (less than one day, one each for 1–7 days, between 7 and 14 days, and over 14 days).
Fig. 9
Fig. 9
Correlations between task labels.
Fig. 10
Fig. 10
LSTM-based network architecture for multitask learning.

References

    1. Introduction to the HCUP National Inpatient Sample (NIS) 2012. (Agency for Healthcare Research and Quality, 2014).
    1. Henry, J., Pylypchuk, Y., Talisha Searcy, M. & Patel, V. Adoption of electronic health record systems among US non-federal acute care hospitals: 2008–2015. ONCData Brief35 (Office of the National Coordinator for Health Information Technology, Washington DC, USA, 2015).
    1. Bates DW, Saria S, Ohno-Machado L, Shah A, Escobar G. Big data in health care: using analytics to identify and manage high-risk and high-cost patients. Health Affairs. 2014;33:1123–1131. doi: 10.1377/hlthaff.2014.0041. - DOI - PubMed
    1. Zimmerman JE, Kramer AA, McNair DS, Malila FM. Acute physiology and chronic health evaluation (apache) iv: hospital mortality assessment for today’s critically ill patients. Crit. Care Med. 2006;34:1297–1310. doi: 10.1097/01.CCM.0000215112.84523.F0. - DOI - PubMed
    1. Williams, B. et al. National Early Warning Score (NEWS): Standardising the assessment of acute-illness severity in the NHS. (London: The Royal College of Physicians, 2012).

Publication types