. 2019 Jun 17;10(1):2675.
doi: 10.1038/s41467-019-10590-6.

Native top-down mass spectrometry provides insights into the copper centers of membrane-bound methane monooxygenase

Affiliations

Native top-down mass spectrometry provides insights into the copper centers of membrane-bound methane monooxygenase

Soo Y Ro et al. Nat Commun. .

Abstract

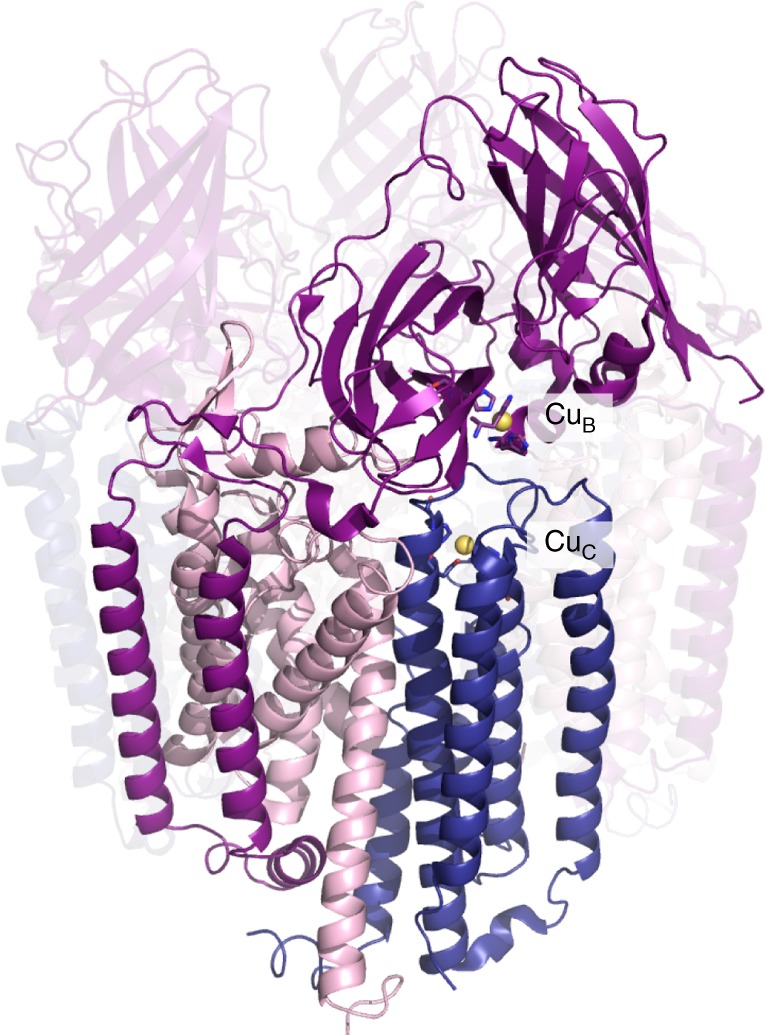
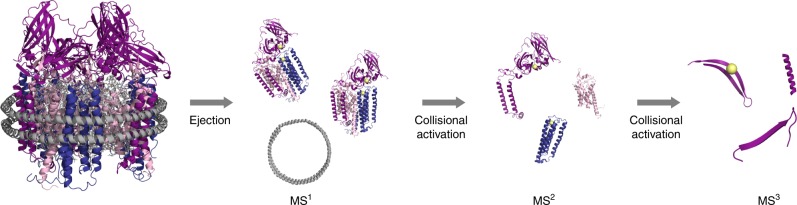
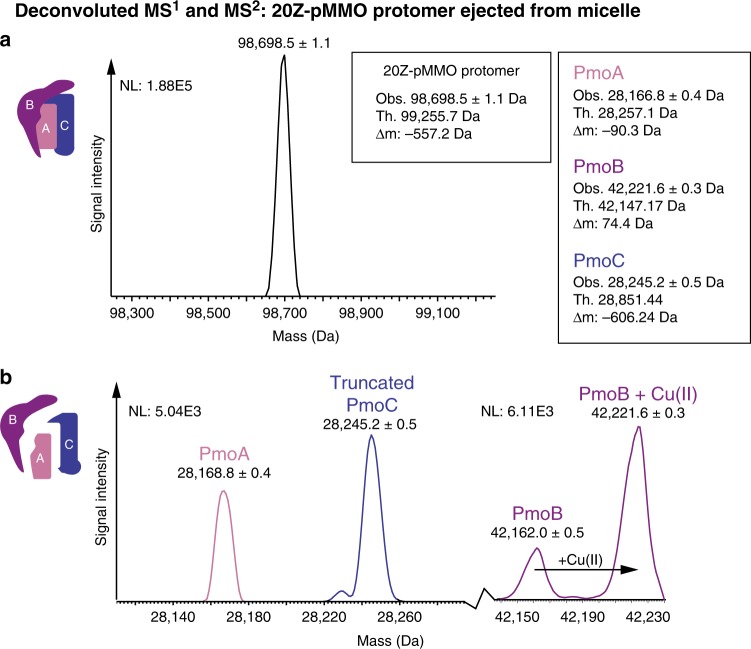
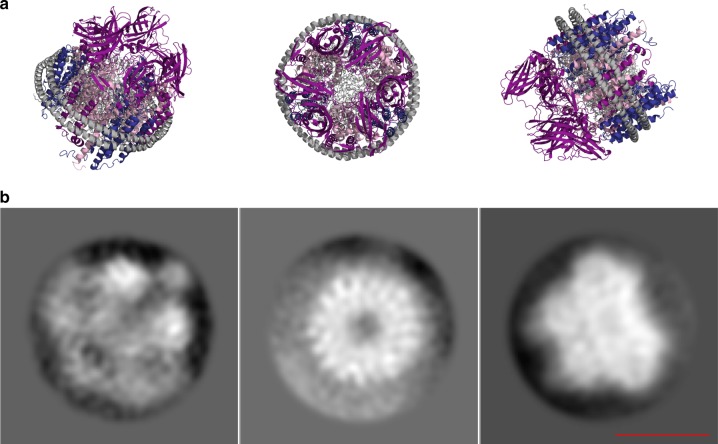
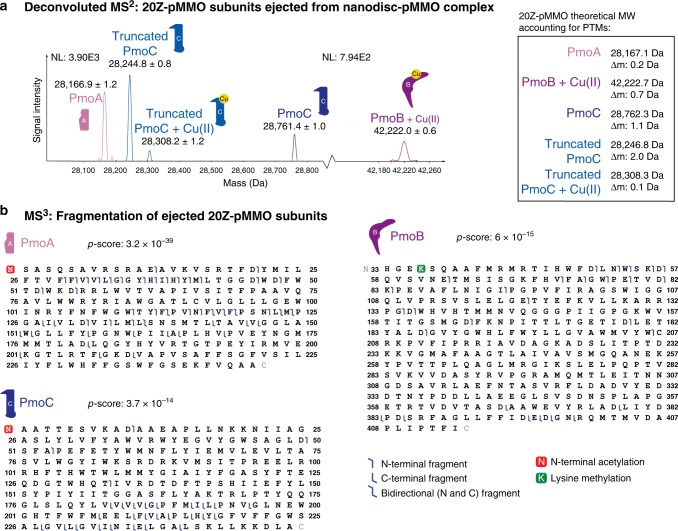
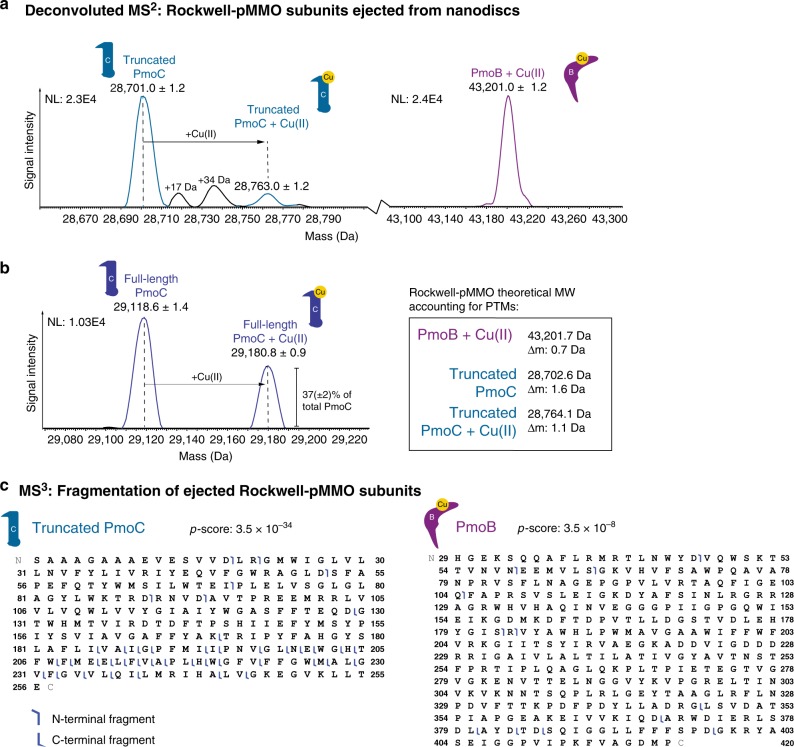
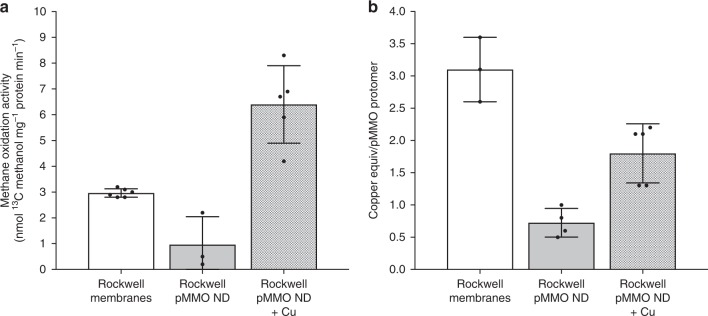
Aerobic methane oxidation is catalyzed by particulate methane monooxygenase (pMMO), a copper-dependent, membrane metalloenzyme composed of subunits PmoA, PmoB, and PmoC. Characterization of the copper active site has been limited by challenges in spectroscopic analysis stemming from the presence of multiple copper binding sites, effects of detergent solubilization on activity and crystal structures, and the lack of a heterologous expression system. Here we utilize nanodiscs coupled with native top-down mass spectrometry (nTDMS) to determine the copper stoichiometry in each pMMO subunit and to detect post-translational modifications (PTMs). These results indicate the presence of a mononuclear copper center in both PmoB and PmoC. pMMO-nanodisc complexes with a higher stoichiometry of copper-bound PmoC exhibit increased activity, suggesting that the PmoC copper site plays a role in methane oxidation activity. These results provide key insights into the pMMO copper centers and demonstrate the ability of nTDMS to characterize complex membrane-bound metalloenzymes.


Conflict of interest statement

N.L.K. is a consultant for Thermo Fisher Scientific. The remaining authors declare no competing interests.

Figures

Fig. 1
Fig. 1
The pMMO structure and location of the metal centers. In the crystal structure of Methylocystis sp. strain Rockwell-pMMO (4PHZ), there is a monocopper center in PmoB coordinated by residues His 29, His 133, and His 135 (CuB), and a monocopper center in PmoC coordinated by Asp 129, His 133, and His 146 (CuC). PmoA, PmoB, and PmoC are shown in pink, purple, and blue, respectively, with one of the three protomers highlighted. Copper ions are shown as yellow spheres
Fig. 2
Fig. 2
The nTDMS platform for pMMO characterization. The pMMO-nanodisc complex is subjected to ejection from the nanodisc using collision-induced dissociation (CID) at the source resulting in the stabilization of the pMMO protomer species (MS1). Increasing collisional activation breaks up the protomer into individual pMMO subunits (MS2). Further collisional activation enables backbone fragmentation of each subunit using higher energy collisional dissociation (HCD) in the HCD cell of the instrument (MS3)
Fig. 3
Fig. 3
nTDMS analysis of 20Z-pMMO in Triton X-100 micelles. a Deconvoluted MS1 of 20Z-pMMO protomer upon ejection from a Triton X-100 micelle. Charge state deconvolution of the major species yields a mass of 98,696.5 ± 1.1 Da. The theoretical mass is derived from the unmodified subunits of pMMO and accounts for the cleavage of a known signal peptide in PmoB. b Deconvoluted MS2 of 20Z-pMMO subunits ejected from the 16+ charge state of the protomer after activation by collisions with neutral gas. The spectrum shows detection of three species, labeled pink, purple, and blue and assigned to PmoA, PmoB, and PmoC, respectively. Adding the measured masses of the ejected subunits yields 98,633.6 Da, which is 62.4 Da smaller than the major protomer mass measured in the MS1. NL values reflect maximum signal intensity in the spectrum
Fig. 4
Fig. 4
Cryo-EM 2D class averages of 20Z-pMMO in MSP2N2 nanodiscs. a A model of a pMMO nanodisc complex generated from the crystal structures of Methyloccocus capsulatus (Bath) pMMO (PDB accession code 3RGB) and MSP1D1 (from PDB accession code 6CC9). This model is for illustrative purposes and is not from 2D class averages. b Tilted, top, and side views of 2D class averages of 20Z-pMMO reconstituted in nanodiscs. A representative scale bar is shown as a 10 nm red line
Fig. 5
Fig. 5
nTDMS analysis of 20Z-pMMO in MSP2N2 nanodiscs. a Deconvoluted MS2 showing detection of 20Z-pMMO subunit masses upon ejection from the nanodisc-pMMO complex. The panel on the right contains the theoretical masses of the subunits, accounting for the modifications characterized by tandem MS. b Graphical fragment maps of pMMO subunits derived from the MS3 step in the nTDMS platform. Fragments are depicted as blue flags in the graphical fragment maps, indicating which regions of the protein sequence can be accounted for in mass by the fragments. The pMMO subunits were found to be modified by N-terminal acetylation (PmoA and PmoC), N-terminal truncation (PmoC), and lysine methylation (PmoB). The graphical fragment map of PmoB begins at residue His 33, showing cleavage of the known N-terminal signal peptide
Fig. 6
Fig. 6
nTDMS analysis of Rockwell-pMMO in MSP1E3D1 nanodiscs. a Deconvoluted MS2 demonstrating detection of Rockwell-pMMO subunit masses upon ejection from the nanodisc without or b with copper supplementation during nanodisc reconstitution. The panel on the right contains the theoretical masses of the subunits, accounting for the modifications characterized by tandem MS. The two species shifted in mass from PmoC by + 17 and + 34 Da likely correspond to the replacement of one and two protons by ammonium adducts (Th. 17.03 Da and 34.06 Da, respectively) on PmoC commonly observed in nESI. c The MS3 of truncated PmoC and PmoB yielded fragment ions, depicted as blue flags in the graphical fragment maps that indicate which regions of the protein sequence can be accounted for in mass by the fragments. Truncated PmoC lacks the first five residues of the N-terminus (MSSTT), and its graphical fragment map begins at residue Ser 6. The graphical fragment map of PmoB begins at residue His 29, consistent with the cleavage of the known N-terminal signal peptide
Fig. 7
Fig. 7
Activity and metal content of Rockwell-pMMO in nanodiscs. a 13C methane oxidation activity of Rockwell-pMMO in membranes and in nanodiscs (ND) without or with copper supplementation. Values are shown in nmol 13C methanol•mg−1 protein•min−1. Error bars represent standard deviation of individual measurements (black dots) of n = 6, 3, and 5, respectively. b Copper equivalents per pMMO protomer for Rockwell-pMMO in membranes and in nanodiscs without or with copper supplementation. Error bars represent standard deviation of individual measurements (black dots) of n = 3, 4, and 5, respectively. Source data are provided as a Source Data file

References

    1. Sirajuddin S, Rosenzweig AC. Enzymatic oxidation of methane. Biochemistry. 2015;54:2283–2294. doi: 10.1021/acs.biochem.5b00198. - DOI - PMC - PubMed
    1. Hanson RS, Hanson TE. Methanotrophic bacteria. Microbiol. Rev. 1996;60:439–471. - PMC - PubMed
    1. Sirajuddin S, et al. Effects of zinc on particulate methane monooxygenase activity and structure. J. Biol. Chem. 2014;289:21782–21794. doi: 10.1074/jbc.M114.581363. - DOI - PMC - PubMed
    1. Ro SY, et al. From micelles to bicelles: effect of the membrane on particulate methane monooxygenase activity. J. Biol. Chem. 2018;293:10457–10465. doi: 10.1074/jbc.RA118.003348. - DOI - PMC - PubMed
    1. Smith SM, et al. Crystal structure and characterization of particulate methane monooxygenase from Methylocystis species strain M. Biochemistry. 2011;50:10231–10240. doi: 10.1021/bi200801z. - DOI - PMC - PubMed

Publication types

MeSH terms