. 2019 Jun 17;9(1):8670.
doi: 10.1038/s41598-019-45054-w.

Simulating human exposure to indoor airborne microplastics using a Breathing Thermal Manikin

Affiliations

Simulating human exposure to indoor airborne microplastics using a Breathing Thermal Manikin

Alvise Vianello et al. Sci Rep. .

Abstract

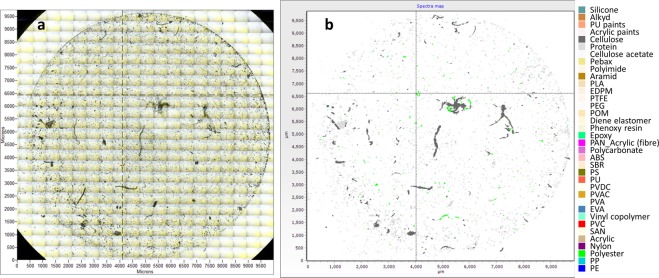
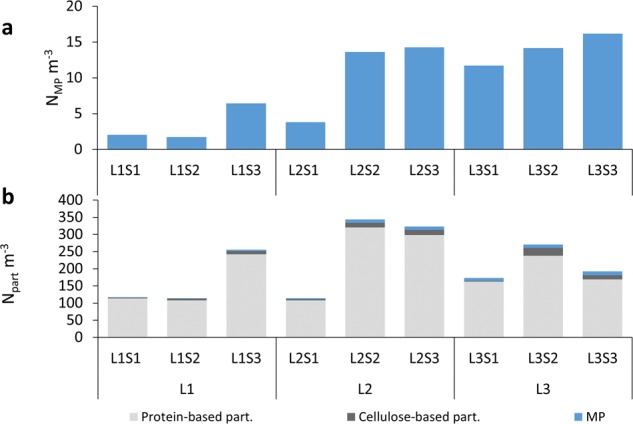
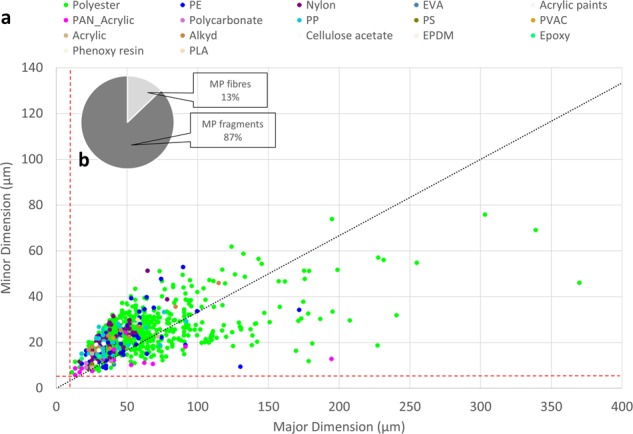
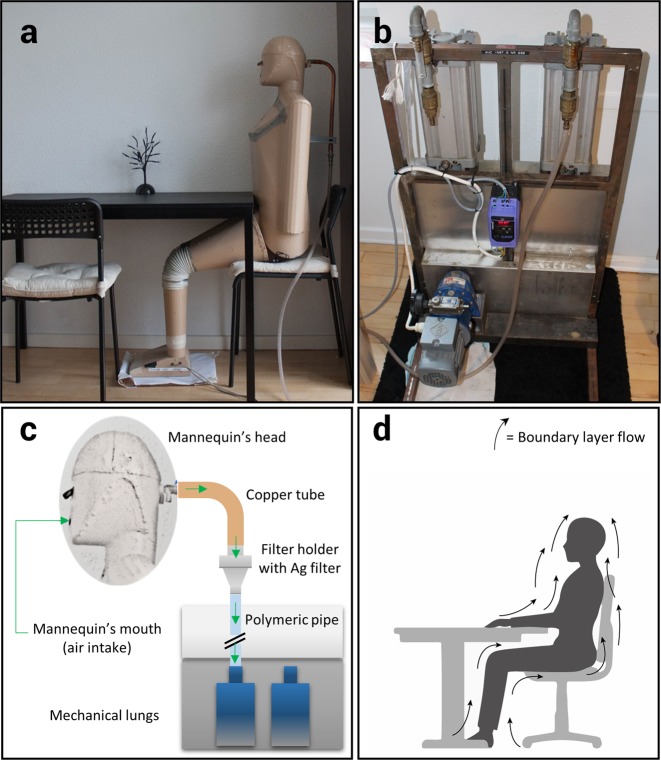
Humans are potentially exposed to microplastics through food, drink, and air. The first two pathways have received quite some scientific attention, while little is known about the latter. We address the exposure of humans to indoor airborne microplastics using a Breathing Thermal Manikin. Three apartments were investigated, and samples analysed through FPA-µFTIR-Imaging spectroscopy followed by automatic analyses down to 11 µm particle size. All samples were contaminated with microplastics, with concentrations between 1.7 and 16.2 particles m-3. Synthetic fragments and fibres accounted, on average, for 4% of the total identified particles, while nonsynthetic particles of protein and cellulose constituted 91% and 4%, respectively. Polyester was the predominant synthetic polymer in all samples (81%), followed by polyethylene (5%), and nylon (3%). Microplastics were typically of smaller size than nonsynthetic particles. As the identified microplastics can be inhaled, these results highlight the potential direct human exposure to microplastic contamination via indoor air.


Conflict of interest statement

The authors (A.V., R.L.J., L.L. and J.V.) have no competing financial interests as defined by Nature Research, or other interests that might be perceived to influence the results and/or discussion reported in this paper. The authors (A.V., R.L.J., L.L., and J.V.) have no competing non-financial interests as defined by Nature Research, or other interests that might be perceived to influence the results and/or discussion reported in this paper.

Figures

Figure 1
Figure 1
(a) Visual stitched image of a sample (L3S3) and (b) corresponding MPhunter map. Each polymer group is highlighted by a different colour. Cellulose and protein-based fragments and fibres are shown in grey colours.
Figure 2
Figure 2
(a) Microplastic particle exposure; (b) Total particle exposure (MP and nonsynthetic particles) (light grey column – protein-based particles; dark grey column – cellulose-based particles; blue column – MP).
Figure 3
Figure 3
Relative polymer distribution. The category “Other polymers” groups the polymers present in lower percentages (polystyrene - PS, acrylic/acrylates polymers, polyurethane/polyether-urethane - PU, ethylene-propylene-diene-monomer - EPDM, polyvinyl acetate - PVAC, ethylene vinyl acetate - EVA, epoxy resin, phenoxy resin, cellulose acetate and triacetate, polylactic acid - PLA, polycarbonate - PC, acrylic paints, polyurethane paints, alkyd).
Figure 4
Figure 4
(a) MP minor dimension vs major dimension scatter plot. The black dashed line indicates the threshold for fibre classification (length to width ratio of 3); the vertical and horizontal red dashed lines indicate the limit of detection concerning size for major (11 µm) and minor (5.5 µm) dimension (2 × 1 pixels). (b) Percentage of MP fibres and fragments for the total analysed samples.
Figure 5
Figure 5
Size distribution for the total amount of MP (a,c) and nonsynthetic particles (b,d) identified in all analysed samples for major dimension (a,b) and minor dimension (c,d). Bin intervals were selected as 0.1 on a logarithmic scale. Light and dark grey bars on histograms indicate abundance; the red dotted line is the relative cumulative frequency (secondary axis).
Figure 6
Figure 6
Sampling device setup: (a) manikin in seated position ready for sampling; (b) twin adjustable pistons connected to the motor to simulate breathing in and out; (c) sampling setup diagram; (d) Illustration of human boundary layer flow.

References

    1. Thompson RC. Lost at Sea: Where Is All the Plastic? Science (80-.). 2004;304:838–838. doi: 10.1126/science.1094559. - DOI - PubMed
    1. Waring RH, Harris RM, Mitchell SC. Plastic contamination of the food chain: A threat to human health? Maturitas. 2018;115:64–68. doi: 10.1016/j.maturitas.2018.06.010. - DOI - PubMed
    1. Barnes DKa, Galgani F, Thompson RC, Barlaz M. Accumulation and fragmentation of plastic debris in global environments. Philos. Trans. R. Soc. Lond. B. Biol. Sci. 2009;364:1985–1998. doi: 10.1098/rstb.2008.0205. - DOI - PMC - PubMed
    1. Villarrubia-Gómez Patricia, Cornell Sarah E., Fabres Joan. Marine plastic pollution as a planetary boundary threat – The drifting piece in the sustainability puzzle. Marine Policy. 2018;96:213–220. doi: 10.1016/j.marpol.2017.11.035. - DOI
    1. Browne MA, et al. Accumulation of microplastic on shorelines woldwide: Sources and sinks. Environ. Sci. Technol. 2011;45:9175–9179. doi: 10.1098/rstb.2008.0205. - DOI - PubMed