. 2019 Jun 17;10(1):2666.
doi: 10.1038/s41467-019-10570-w.

Ran promotes membrane targeting and stabilization of RhoA to orchestrate ovarian cancer cell invasion

Affiliations

Ran promotes membrane targeting and stabilization of RhoA to orchestrate ovarian cancer cell invasion

Kossay Zaoui et al. Nat Commun. .

Abstract

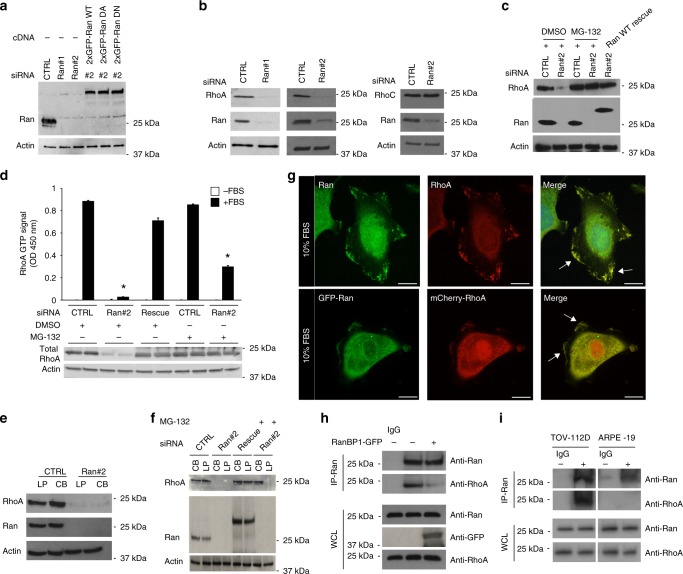
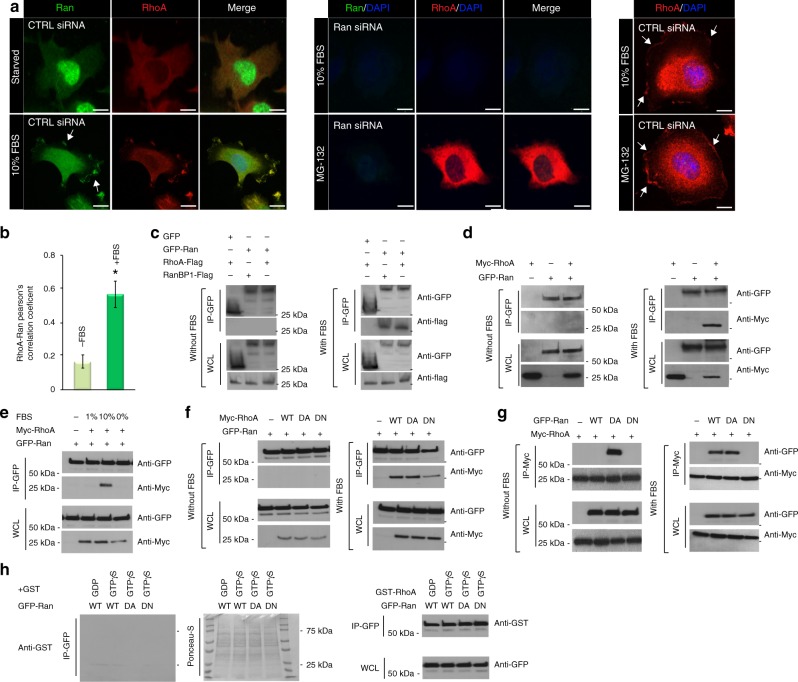
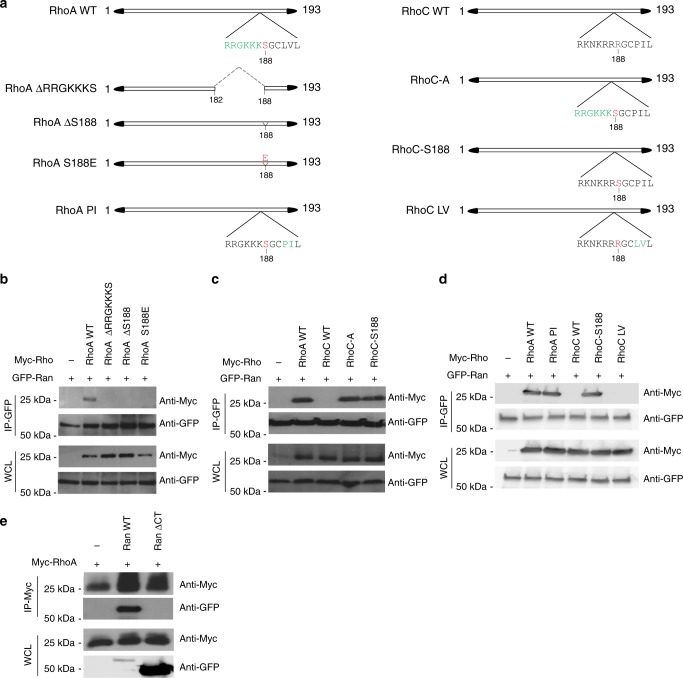
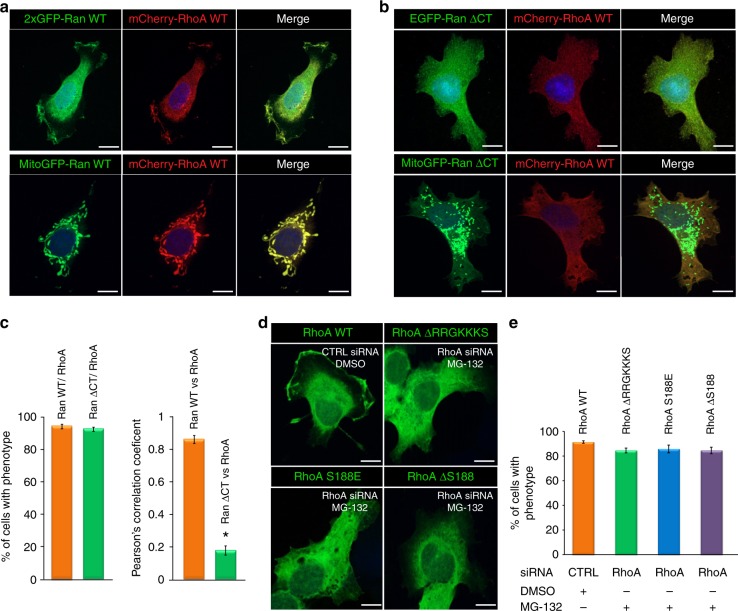
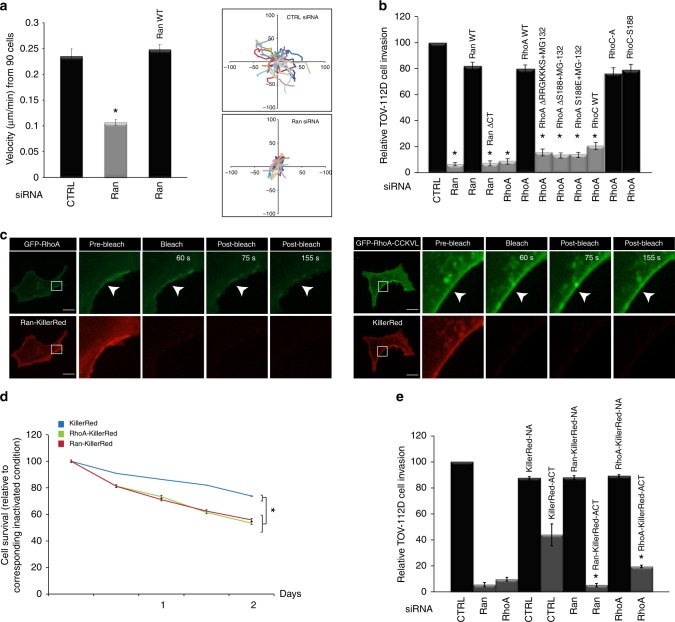
Ran is a nucleocytoplasmic shuttle protein that is involved in cell cycle regulation, nuclear-cytoplasmic transport, and cell transformation. Ran plays an important role in cancer cell survival and cancer progression. Here, we show that, in addition to the nucleocytoplasmic localization of Ran, this GTPase is specifically associated with the plasma membrane/ruffles of ovarian cancer cells. Ran depletion has a drastic effect on RhoA stability and inhibits RhoA localization to the plasma membrane/ruffles and RhoA activity. We further demonstrate that the DEDDDL domain of Ran is required for the interaction with serine 188 of RhoA, which prevents RhoA degradation by the proteasome pathway. Moreover, the knockdown of Ran leads to a reduction of ovarian cancer cell invasion by impairing RhoA signalling. Our findings provide advanced insights into the mode of action of the Ran-RhoA signalling axis and may represent a potential therapeutic avenue for drug development to prevent ovarian tumour metastasis.


Conflict of interest statement

The authors declare no competing interests.

Figures

Fig. 1
Fig. 1
Ran GTPase stabilizes and co-localizes with RhoA at the plasma membrane of TOV-112D cells. a Western blot of Ran knockdown (KD) with siRNA (CTRL, Ran #1 or 2) and rescue levels with different RNAi-resistant 2xGFP constructs of Ran as wild-type (WT), dominant active (DA), and dominant-negative (DN) in TOV-112D. Actin served as a loading control for all blots. b Western blot showing RhoA and RhoC protein expression levels after Ran KD in cells. c Western blot showing RhoA protein level after re-expression of 2xGFP-Ran WT (Ran WT rescue) or treatment for 2 h with 20 µM MG-132 in cells transfected with CTRL or Ran #2 siRNA. d Active RhoA was examined in cell lysates of control (CTRL), Ran KD or Ran KD with Ran WT rescued. All values are means ± SEM from three independent experiments. P-values are based on comparisons with CTRL using the t test: *P < 0.05 was considered statistically significant. Western blot showing total RhoA. e, f Cell body (CB) and lamellipodia (LP) of CTRL and Ran KD cells (with or without Ran WT rescued) were fractionated and treated with or without 20 µM MG-132 for 2 h. Equal amounts of proteins were immunoblotted to show RhoA expression in the respective fractions. RhoA was decreased in CB and LP in Ran KD cells, but unchanged in CTRL. RhoA expression is only rescued in CB fractions after treatment with MG-132. g Top, TOV-112D cells were fixed, permeabilized, and subjected to immunofluorescence using Ran and RhoA antibodies and DAPI (Merge). Bottom, TOV-112D cells transfected with 2xGFP-Ran and mCherry-RhoA were visualized by spinning disk microscopy. Arrows show Ran and RhoA colocalization at the plasma membrane. h TOV-112D cells were transfected with RanBP1-GFP. Protein lysates were subjected to IP with Ran or control IgG antibodies. Proteins were separated by SDS-PAGE and immunoblotted for endogenous RhoA and Ran. i Protein lysates from TOV-112D and ARPE-19 cells were subjected to IP with Ran or control IgG antibodies. Proteins were separated by SDS-PAGE and immunoblotted for endogenous RhoA and Ran. Scale bars, 10 µm
Fig. 2
Fig. 2
Ran GTPase promotes RhoA recruitment to the plasma membrane by direct interaction. a TOV-112D cells were either starved or incubated with 10% FBS, treated with or without 20 µM MG-132 for 2 h, and transfected with CTRL or Ran siRNA as indicated. Cells were then fixed, permeabilized, and subjected to immunofluorescence using Ran and RhoA antibodies and DAPI (Merge). Cells were visualized by spinning disk microscopy. Arrows show Ran and RhoA colocalization at the plasma membrane. Scale bars, 10 µm. b Colocalization between RhoA (red) and Ran (green) was represented as Pearson’s correlation coefficient and measured in individual TOV-112D starved cells or with 10% FBS. All values are means ± SEM from three independent experiments. P-values are based on comparisons with CTRL using the t test: *P < 0.05 was considered statistically significant. c TOV-112D cells co-transfected with RanBP1-Flag or RhoA-Flag and GFP alone or 2xGFP-Ran (WT) were starved or incubated with 10% FBS, as indicated. Cell lysates were subjected to immunoprecipitation (IP) with an anti-GFP or an anti-Flag antibody and western blotted as shown. GFP alone was used as a negative control and RanBP1-Flag as a positive control. dg TOV-112D cells co-transfected with Myc-RhoA (WT, DA, or DN) and 2xGFP-Ran (WT, DA, or DN) were starved or incubated with 1% or 10% FBS, as indicated. Cell lysates were subjected to immunoprecipitation (IP) with an anti-GFP or an anti-Myc antibody and western blotted as shown. h TOV-112D cells transfected with 2xGFP-Ran (WT, DA or DN), lysed, and subjected to IP with an anti-GFP antibody. Protein complexes were separated by SDS-PAGE and transferred to the nitrocellulose membrane. The membranes were incubated with free GST protein (negative control) or fusion protein GST-RhoA (GDP or GTPγS) and immunoblotted with anti-GST antibody
Fig. 3
Fig. 3
The serine 188 of RhoA is required for RhoA interaction with the DEDDDL polyacid domain of Ran. a Schematic of RhoA and RhoC mutant constructs. b TOV-112D cells were co-transfected with 2xGFP-Ran (WT) and either control, Myc-RhoA (WT), Myc-RhoA (ΔRRGKKKS), Myc-RhoA (ΔS188), or Myc-RhoA (S188E) followed by an immunoprecipitation (IP) using an anti-GFP antibody and western blotted as shown. c TOV-112D cells were co-transfected with 2xGFP-Ran (WT) and either control, Myc-RhoA (WT), Myc-RhoC (WT), Myc-RhoC-A, or Myc-RhoC-S188 followed by an IP with an anti-GFP antibody and western blotted as shown. d TOV-112D cells were co-transfected with 2xGFP-Ran (WT) and either control, Myc-RhoA (WT), Myc-RhoA (PI), Myc-RhoC (WT), Myc-RhoC-S188, or Myc-RhoC (LV) followed by an IP with an anti-GFP antibody and western blotted as shown. e TOV-112D cells were co-transfected with Myc-RhoA (WT) or 2xGFP-Ran (WT) or EGFP-Ran ΔCT (Ran without DEDDDL motif) followed by an IP with an anti-Myc antibody and western blotted as shown
Fig. 4
Fig. 4
Ran GTPase recruits RhoA to subcellular structures. TOV-112D cells expressing mCherry-RhoA WT were co-transfected with 2xGFP-Ran or MitoGFP-Ran WT (a), EGFP-Ran ΔCT (Ran without DEDDDL motif), or MitoGFP-Ran ΔCT (Ran without DEDDDL motif) (b). Cells were visualized by spinning disk microscopy to establish the localization of RhoA with respect to MitoGFP-Ran or MitoGFP-Ran ΔCT (Ran without DEDDDL motif). Scale bars, 10 µm. c Left, percentage of TOV-112D cells with the corresponding phenotype as in (a, b) for RanWT/RhoA or Ran ΔCT/RhoA colocalization or not to the mitochondria was scored. Right, colocalization between RhoA (red) and Ran (green) represented as Pearson’s correlation coefficient and measured for individual TOV-112D cells. All values are means ± SEM from three independent experiments. P-values are based on comparisons with CTRL (Ran WT vs RhoA): using the t test: *P < 0.05 was considered statistically significant. d TOV-112D cells co-transfected with CTRL or RhoA siRNA and EGFP constructs of either RhoA (WT), RhoA ΔRRGKKS, RhoA S188E or RhoA ΔS188 treated for 2 h with 20 µM MG-132 as indicated. Cells were visualized by spinning disk microscopy. Scale bars, 10 µm. e Percentage of TOV-112D cells with corresponding phenotype as in (d) for RhoA localization at the PM or not, was scored
Fig. 5
Fig. 5
Ran regulates cell proliferation and migration/invasion through RhoA recruitment. a TOV-112D cells were transfected with siRNAs, and Ran WT as indicated for cell migration assays. Left, cell velocity was determined by tracking living cells. Right, analysis of cell migration paths in CTRL and Ran KD cells. The data represent the trajectories of 30 cells. All values are means ± SEM from three independent experiments. P-values are based on comparisons with CTRL using the t test: *P < 0.05 was considered statistically significant. b Effect of Ran-RhoA signaling with or without MG-132 treatment on transwell cell invasion. The invading TOV-112D cells passed through the membrane and were fixed, stained, quantified as described in the Methods section. All values are means ± SEM from three independent experiments. P-values are based on comparisons with CTRL using the t test: *P < 0.05 was considered statistically significant. c Left, TOV-112D cells co-expressing Ran-KillerRed and GFP-RhoA were irradiated with green light for 60 s. The illumination resulted in considerable decrease in GFP membrane signal (arrowheads) confirming RhoA detachment from the plasma membrane after light-induced damage of Ran. Right, control experiment showing TOV-112D cells co-expressing KillerRed and GFP-RhoA-CCKVL were irradiated with green light for 60 s. No change in GFP signal distribution from the plasma membrane was observed. Scale bars, 10 µm. d Graph shows TOV-112D cell proliferation plotted over time (from the third day post transfection) for each condition as indicated and normalized with corresponding inactivated condition. Values (means ± SEM) from three independent experiments are shown as ratio change in cell survival. P-values are based on comparisons with CTRL using the t test: *P < 0.05 was considered statistically significant. e Transwell-invasion assay using transwell chamber before and after KillerRed inactivation. NA non-activated, ACT activated. The data from three independent experiments are expressed as percent change (means ± SEM) compared with the controls. P-values based in comparison with KillerRed alone activated conditions using the t test: *P < 0.05 was considered statistically significant

Similar articles

Cited by

References

    1. Davidson B, Trope CG. Ovarian cancer: diagnostic, biological and prognostic aspects. Women’s. Health (Lond.) 2014;10:519–533. doi: 10.2217/WHE.14.37. - DOI - PubMed
    1. Jemal A, et al. Global cancer statistics. CA Cancer J. Clin. 2011;61:69–90. doi: 10.3322/caac.20107. - DOI - PubMed
    1. Siegel RL, Miller KD, Jemal A. Cancer statistics, 2018. CA Cancer J. Clin. 2018;68:7–30. doi: 10.3322/caac.21442. - DOI - PubMed
    1. Coleman RL, Monk BJ, Sood AK, Herzog TJ. Latest research and treatment of advanced-stage epithelial ovarian cancer. Nat. Rev. Clin. Oncol. 2013;10:211–224. doi: 10.1038/nrclinonc.2013.5. - DOI - PMC - PubMed
    1. Ouellet V, et al. Discrimination between serous low malignant potential and invasive epithelial ovarian tumors using molecular profiling. Oncogene. 2005;24:4672–4687. doi: 10.1038/sj.onc.1208214. - DOI - PubMed

Publication types