. 2019 Jul;21(7):845-855.
doi: 10.1038/s41556-019-0337-y. Epub 2019 Jun 17.

RPEL-family rhoGAPs link Rac/Cdc42 GTP loading to G-actin availability

Affiliations

RPEL-family rhoGAPs link Rac/Cdc42 GTP loading to G-actin availability

Jessica Diring et al. Nat Cell Biol. 2019 Jul.

Abstract

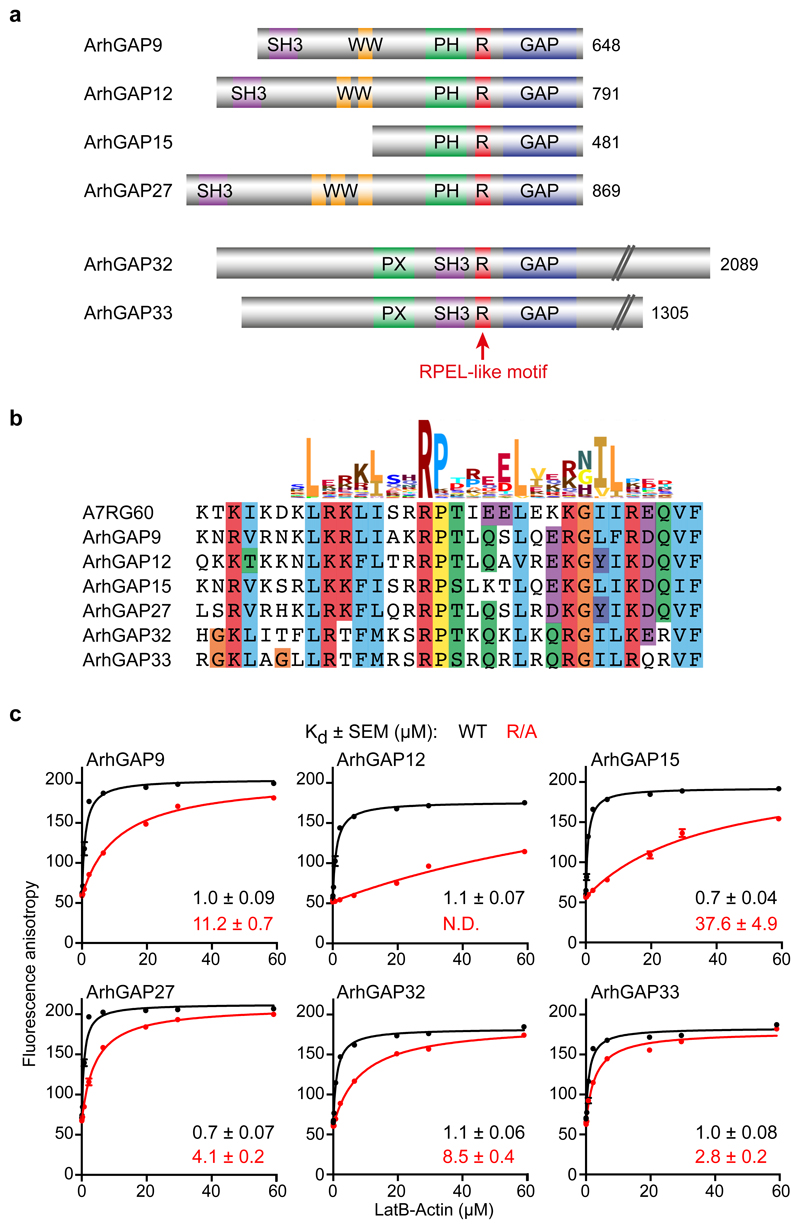
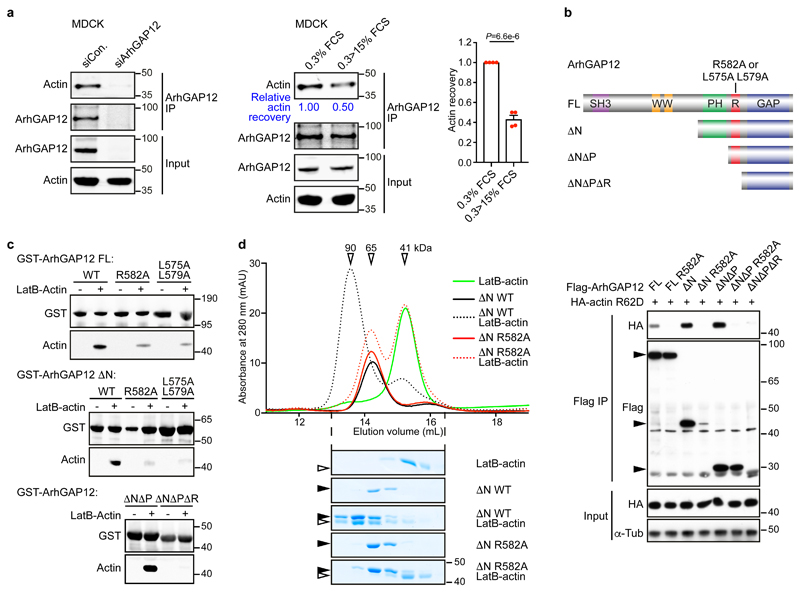
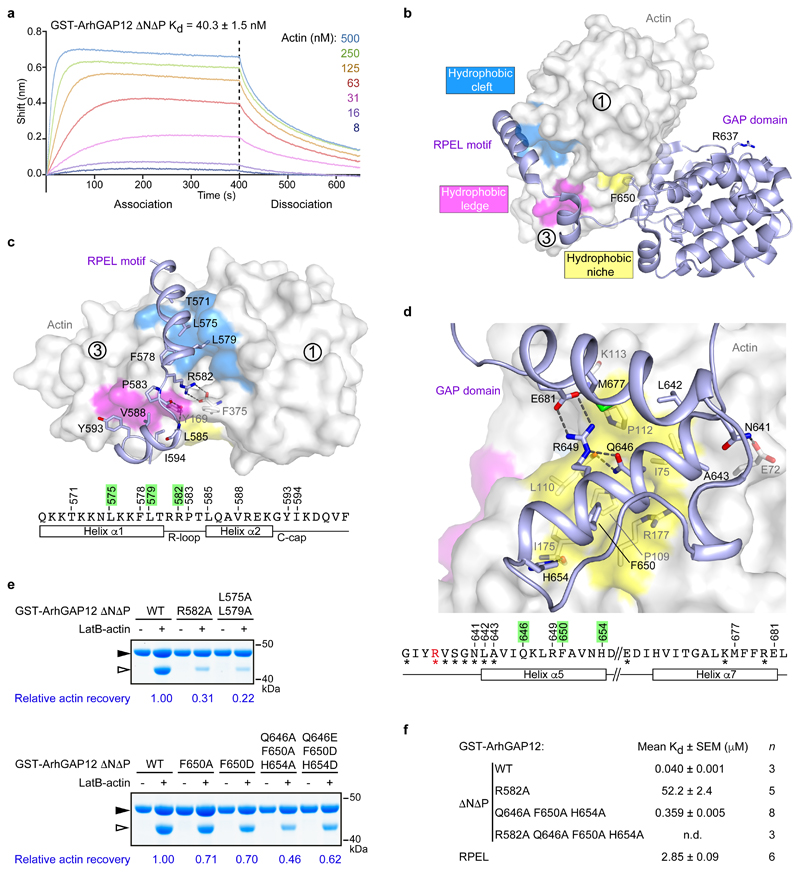
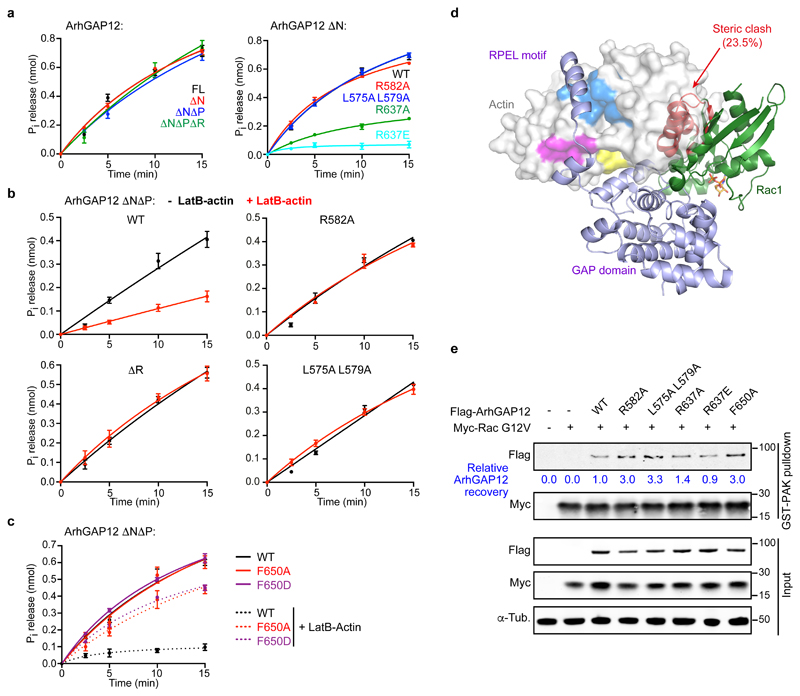
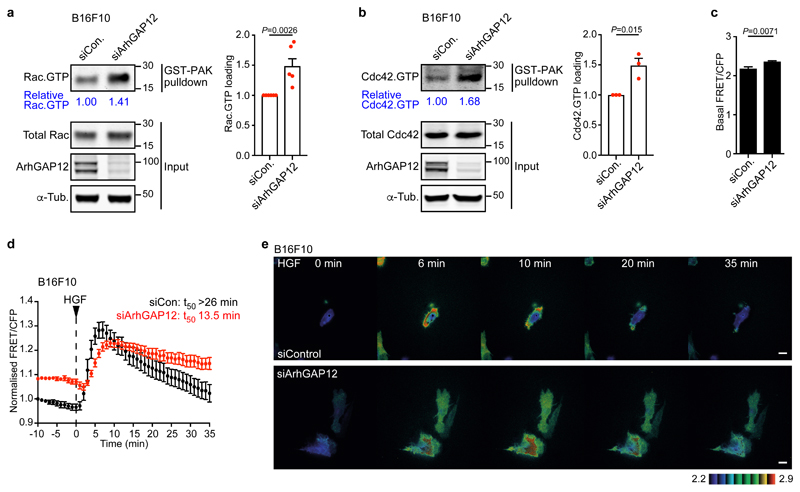
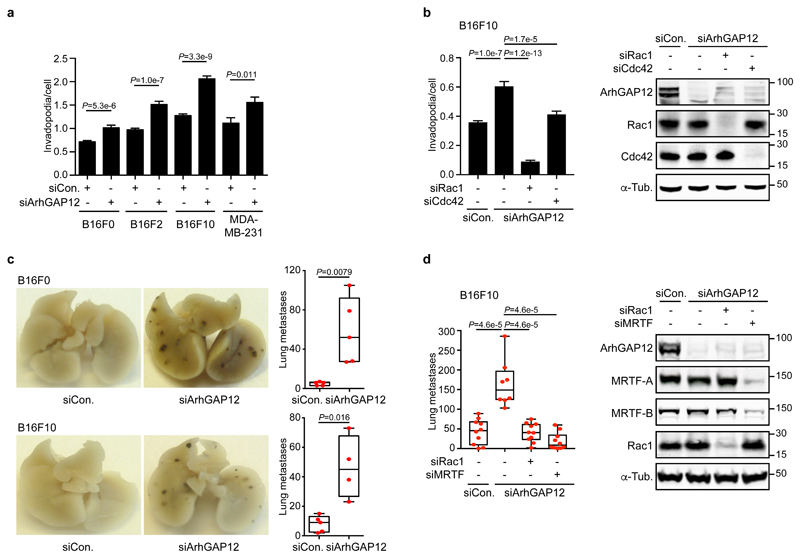
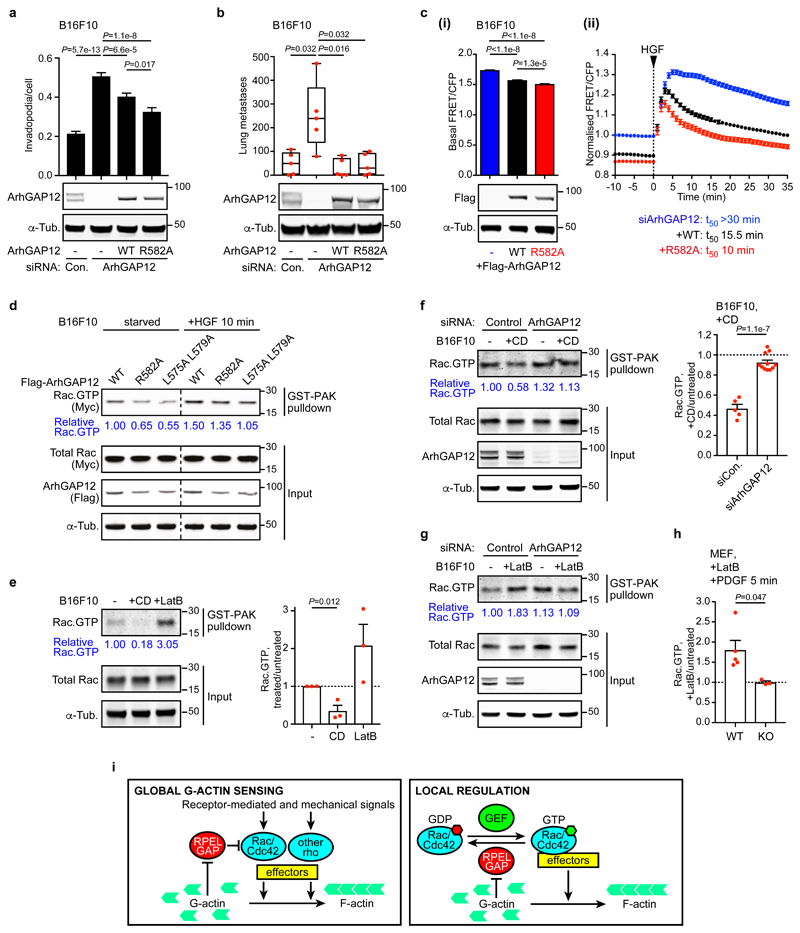
RPEL proteins, which contain the G-actin-binding RPEL motif, coordinate cytoskeletal processes with actin dynamics. We show that the ArhGAP12- and ArhGAP32-family GTPase-activating proteins (GAPs) are RPEL proteins. We determine the structure of the ArhGAP12/G-actin complex, and show that G-actin contacts the RPEL motif and GAP domain sequences. G-actin inhibits ArhGAP12 GAP activity, and this requires the G-actin contacts identified in the structure. In B16 melanoma cells, ArhGAP12 suppresses basal Rac and Cdc42 activity, F-actin assembly, invadopodia formation and experimental metastasis. In this setting, ArhGAP12 mutants defective for G-actin binding exhibit more effective downregulation of Rac GTP loading following HGF stimulation and enhanced inhibition of Rac-dependent processes, including invadopodia formation. Potentiation or disruption of the G-actin/ArhGAP12 interaction, by treatment with the actin-binding drugs latrunculin B or cytochalasin D, has corresponding effects on Rac GTP loading. The interaction of G-actin with RPEL-family rhoGAPs thus provides a negative feedback loop that couples Rac activity to actin dynamics.


Conflict of interest statement

Competing Financial Interests

The authors declare no competing financial interests.

Figures

Figure 1
Figure 1. Two families of rhoGAPs contain an RPEL motif.
(a) Domain structure of ArhGAP12 and ArhGAP32 rhoGAP subfamilies. The RPEL-like motif is indicated in red. (b) Clustal X sequence alignment of the RPEL-like motifs of ArhGAP12/32 family GAPs with the RPEL motif of Nematostella vectensis A7RG60, aligned with the Pfam PF02755 HMM logo. (c) Fluorescence anisotropy analysis of LatB-actin binding to the FAM-conjugated RPEL peptides shown in (b), or derivatives in which the core RPEL arginine is replaced by alanine. Data were fitted by non-linear regression; data are means ± SEM, n=6 independent experiments. N.D., not determined. See Supplementary Figure 1 for related data. Source data for c are shown in Supplementary Table 1.
Figure 2
Figure 2. ArhGAP12 interaction with G-actin requires the RPEL motif.
(a) Endogenous ArhGAP12 was immunoprecipitated and actin recovery was analysed by immunoblot in starved MDCK cells. Cells were transfected with control or ArhGAP12 siRNA (left; data shown represent 4 independent experiments), or serum-stimulated as indicated (middle and right). Bar graph data are mean ± SEM, n=4 independent experiments, two-tailed unpaired t-test. (b) Top, ArhGAP12 derivatives: full-length (FL), amino acids 1-791; ΔN 410-791; ΔNΔP 568-791; ΔNΔPΔR, 582-791. RPEL point mutants were R582A and L575A L579A. Bottom, nonpolymerisable actin mutant R62D was coexpressed with wildtype ArhGAP12 or RPEL mutant R582A in NIH3T3 cells and their interaction analysed by immunoprecipitation and immunoblotting. (c) Immobilised recombinant GST-ArhGAP12 proteins were used to recover purified LatB-actin from solution; actin recovery was analysed by immunoblot. (d) Analytical gel filtration. Elution profiles of recombinant ArhGAP12 ΔN (4 μM) and purified LatB-actin (5 μM) either alone (solid lines) or in a mixture (dotted lines), analysed by absorbance (top) or SDS-PAGE/Coomassie blue staining (bottom). Apparent Mr are indicated. Black and open horizontal arrowheads point to ArhGAP12 and actin respectively. Data shown in (b-d) are representative of 3 independent experiments, respectively. See Supplementary Figure 1 for related data. Source data for a and d are shown in Supplementary Table 1. Unprocessed blots and Coomassie gels are shown in Supplementary Figure 8.
Figure 3
Figure 3. Structural analysis of the ArhGAP12•G-actin complex.
(a) Octet biolayer interferometry assay. Biosensors loaded with GST-ArhGAP12 ΔNΔP were incubated with different concentrations of G-actin, which was washed out at 400s. Kd is the mean ± SEM; a representative of 3 independent experiments is shown. (b) The ArhGAP12 ΔNΔP•LatB-actin complex. ArhGAP12 ΔNΔP is shown as blue ribbon, and LatB-actin in white surface representation, with subdomains indicated and the hydrophobic cleft, ledge and niche surfaces coloured in blue, pink and yellow, respectively. The GAP domain catalytic arginine finger is indicated. (c) RPEL-actin interactions. RPEL residues interacting with actin are shown as sticks; RPEL sequence, secondary structures, and interacting residues (mutated residues highlighted) are summarised below. (d) GAP domain interactions with the actin hydrophobic niche. ArhGAP12 residues interacting with the actin niche, or stabilising the orientation of the helices, are shown as sticks. GAP domain helix interaction residues and secondary structures are summarised as in (c), with asterisks indicating residues implicated in interaction with rho-family GTPases (catalytic arginine finger R637 in red). (e) Effect of RPEL and GAP domain mutations on G-actin binding, assessed by pulldown assay as in Fig. 2c and detected by Coomassie blue staining. LatB-actin recovery, quantified relative to GST-ArhGAP12 ΔNΔP WT, is indicated below the gels. Black and open arrowheads point to ArhGAP12 and actin respectively. Representative data of three experiments. (f) Summary of Octet biolayer interferometry assays for GST-ArhGAP12 ΔNΔP and its mutant derivatives, and GST-RPEL. Kd is the mean ± SEM, n, independent experiments as indicated; n.d., no binding detectable under the assay conditions. See Supplementary Figure 2 for related data. Source data for a and f are shown in Supplementary Table 1. Unprocessed Coomassie gels are shown in Supplementary Figure 8.
Figure 4
Figure 4. G-actin inhibits ArhGAP12 GAP activity by occluding rho protein binding.
GAP activity towards Rac1 was assessed using a colorimetric assay for Pi release. Data were fitted by non-linear regression; data are means ± SEM, n=3 (a left, b), n=4 (a right, c) independent experiments. (a) Effect of ArhGAP12 truncations and point mutations of the RPEL motif or catalytic R637. (b) GAP activity is suppressed by 10 μM LatB-actin, and this requires the RPEL motif. (c) Alanine or aspartate substitutions at niche contact residue F650 do not affect GAP activity, but relieve the inhibitory effect of LatB-actin. (d) Model of Rac1 bound to ArhGAP12. The GAP domain of the MgcRacGAP:Cdc42.GDP structure (PDB ID 5C2J) was superimposed onto the GAP domain of the ArhGAP12 ΔNΔP•actin structure. The Rac1 structure (PDB 5N6O) was then superimposed onto the Cdc42 model (RMSD 0.50Å, 148 Cα). Exposed and occluded Rac1 residues are shown as green and red ribbons, GDP in orange. The degree of occlusion is similar for Cdc42 (23.7%) and Rac1 (23.5%). (e) Flag-ArhGAP12 derivatives and constitutively active Myc-RacG12V were co-expressed in NIH 3T3 cells; and recovery of ArhGAP12 and Myc-RacG12V in GST-PAK CRIB pulldown assays assessed by immunoblotting. Representative immunoblots from 3 independent experiments are shown. See Supplementary Figure 3 for related data. Source data for a-c are shown in Supplementary Table 1. Unprocessed blots are shown in Supplementary Figure 8.
Figure 5
Figure 5. ArhGAP12 controls GTP loading on Rac and Cdc42 in melanoma cells.
B16F10 melanoma cells were transfected with control or ArhGAP12 siRNA. (a) Rac.GTP and (b) Cdc42.GTP levels, as assessed by GST-PAK pulldown assays. Left, representative immunoblots. Right, data summary. Data are means ± SEM, n=6 (a) or n=3 (b) independent experiments, two-tailed unpaired t-test. (c) Increased basal Rac GTP loading in serum-starved B16F10 cells, measured using the RaichuEV-Rac FRET biosensor. FRET/CFP ratio was measured over 9 min in control (n=22) or ArhGAP12-depleted (n=32) cells. Data are means ± SEM, two-tailed Mann Whitney test. (d) Kinetics of Rac GTP loading in control (n=10) and ArhGAP12-depleted (n=9) B16F10 cells following HGF stimulation, measured as in (c). Data are expressed relative to control cell value at the start of the experiment. T50, time to recover to 50% peak Rac GTP loading. Data are means ± SEM. (e) Representative FRET/CFP ratio images displayed in 8-color, intensity modulated display mode. Representative images of three independent experiments. Scale bar 20 μm. See Supplementary Figures 4 and 5 for related data. Source data for a-d are shown in Supplementary Table 1. Unprocessed blots are shown in Supplementary Figure 8.
Figure 6
Figure 6. ArhGAP12 regulates Rac-dependent processes in cells.
Cells were transfected with control, ArhGAP12 or other siRNA as indicated. (a,b) Invadopodia formation by cells plated overnight on Oregon-green labelled gelatin was detected by loss of staining. (a) 7 fields per well have been imaged and averaged. Data shown represent n=16 independent wells pooled from three independent experiments. At least 8,507 cells were imaged per condition. (b) 4 fields per well have been imaged and averaged. Data shown represent n=24 independent wells pooled from three independent experiments. At least 30,675 cells were imaged per condition. Data in a and b are means ± SEM, two-tailed Mann Whitney test. (c,d) Experimental metastasis assay. B16F0 and F10 cells were injected in the tail vein of C57BL/6J mice. Images show lung colonisation after 12 days. Box-and-whiskers plots indicate the number of lung metastases, showing median, quartiles, and highest and lowest values. Representative results of three experiments are shown; n=5 (c) and n=10 (d) mice per group, except B16F10/siArhGAP12 for which n=4 (c) and n=8 (d), two-tailed Mann Whitney test. See Supplementary Figures 4 and 5 for related data. Source data for a-d are shown in Supplementary Table 1. Unprocessed blots are shown in Supplementary Figure 8.
Figure 7
Figure 7. G-actin regulates Rac activity in melanoma cells.
(a,b) B16F10 conditional lines expressing control or siRNA-resistant Flag-ArhGAP12 derivatives were transfected with control or ArhGAP12 siRNA. (a) Invadopodia formation assessed as in Figure 6b. 4 fields per well have been imaged and averaged. Data shown represent n=24 independent wells pooled from three independent experiments. At least 22,437 cells were imaged per condition. Data are means ±SEM, two-tailed Mann-Whitney test. (b) Experimental metastasis assay, displayed as in Figure 6d. Representative results of three experiments are shown, n=5 mice, two-tailed Mann-Whitney test. (c) HGF-induced Rac GTP loading imaged using the RaichuEV-Rac biosensor. siRNA-resistant Flag-ArhGAP12 WT or R582A were transiently re-expressed in serum-starved ArhGAP12-depleted B16F10 cells. Images were acquired from control (n=96), +ArhGAP12 WT (n=58) and +ArhGAP12 R582A (n=37) cells. (i) Basal Rac GTP loading, measured by FRET/CFP ratio over 10 min before stimulation. Data are means ±SEM, two-tailed Mann-Whitney test. Note the lower expression level of ArhGAP12 R582A. (ii) Kinetics of Rac GTP loading following HGF stimulation, normalised taking the basal activity in control cells as 1.0. Data are means ±SEM. (d) Immunoblot analysis of GST-PAK Rac pulldown assays using lysates of B16F10 cells cotransfected with Flag-ArhGAP12 derivatives and Myc-Rac. Representative immunoblot of three independent experiments. (e) B16F10 cells, maintained in 0.3% FCS, following treatment with Cytochalasin D (CD) or Latrunculin B (LatB) for 30 min before Rac.GTP pulldown assay. Data are means ±SEM n=3, two-tailed unpaired t-test. (f) Cells transfected with control or ArhGAP12 siRNA were maintained in 10% FCS and treated with CD for 30 min before Rac.GTP pulldown assays. Data are means ±SEM, n=5 (control), n=11 (siArhGAP12) independent experiments, two-tailed unpaired t-test. (g) Cells as in (f) were treated with LatB for 30 min before Rac.GTP pulldown assay. Representative immunoblot of three independent experiments. (h) Wildtype and ArhGAP12-knockout MEFs were treated with LatB (30 min), and PDGF (5 min) before Rac.GTP pulldown assay. Data are means ±SEM, n=5 (WT), n=3 (KO) independent experiments, two-tailed unpaired t-test. (i) Global and local regulation by RPEL rhoGAP proteins. See Supplementary Figures 5 and 6 for related data. Source data for a-c, e, f and h are shown in Supplementary Table 1. Unprocessed blots are shown in Supplementary Figure 8.

Similar articles

Cited by

References

    1. Krause M, Gautreau A. Steering cell migration: lamellipodium dynamics and the regulation of directional persistence. Nat Rev Mol Cell Biol. 2014;15:577–590. - PubMed
    1. Przybyla L, Muncie JM, Weaver VM. Mechanical Control of Epithelial-to-Mesenchymal Transitions in Development and Cancer. Annu Rev Cell Dev Biol. 2016;32:527–554. - PubMed
    1. Skau CT, Waterman CM. Specification of Architecture and Function of Actin Structures by Actin Nucleation Factors. Annu Rev Biophys. 2015;44:285–310. - PMC - PubMed
    1. Dominguez R, Holmes KC. Actin structure and function. Annu Rev Biophys. 2011;40:169–186. - PMC - PubMed
    1. Lawson CD, Ridley AJ. Rho GTPase signaling complexes in cell migration and invasion. J Cell Biol. 2018;217:447–457. - PMC - PubMed

Publication types

MeSH terms