. 2019 Jun 17;9(1):8671.
doi: 10.1038/s41598-019-45191-2.

Short exposure to cold atmospheric plasma induces senescence in human skin fibroblasts and adipose mesenchymal stromal cells

Affiliations

Short exposure to cold atmospheric plasma induces senescence in human skin fibroblasts and adipose mesenchymal stromal cells

Marion Bourdens et al. Sci Rep. .

Abstract

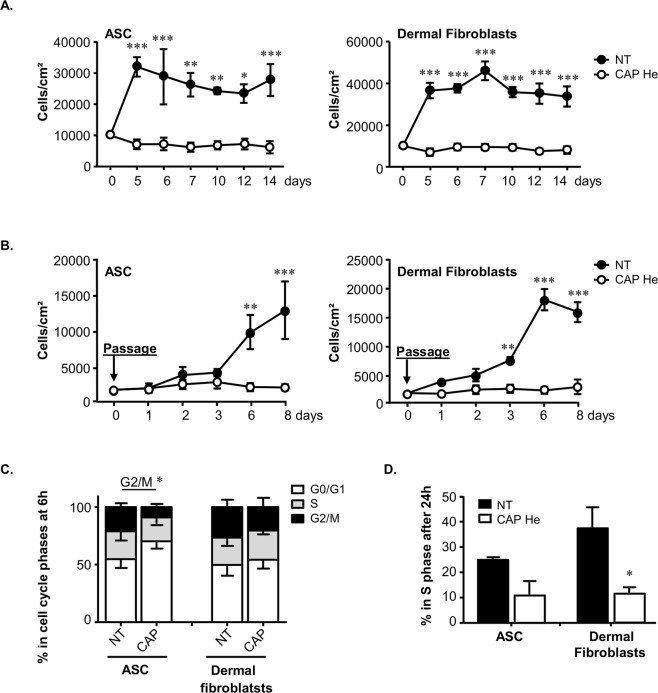
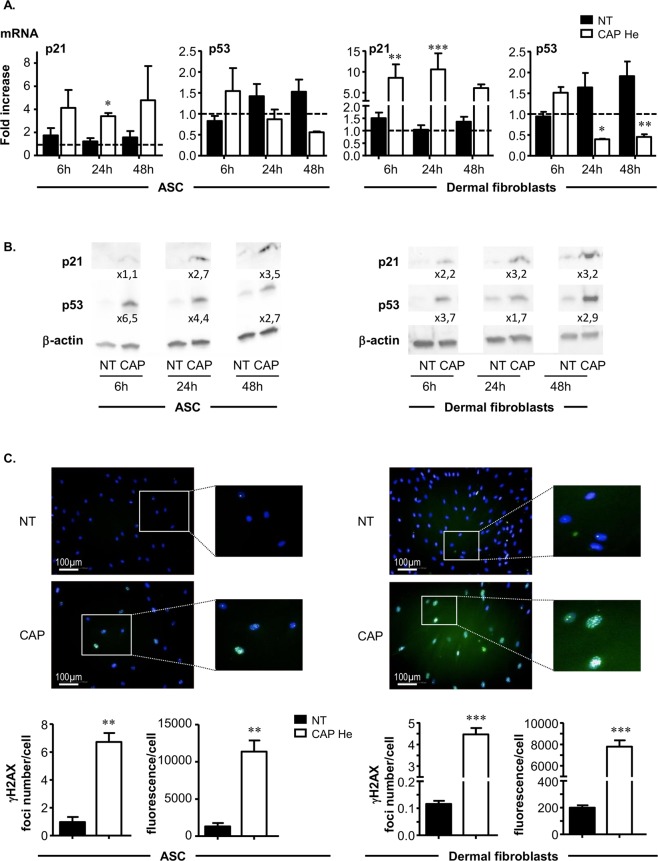
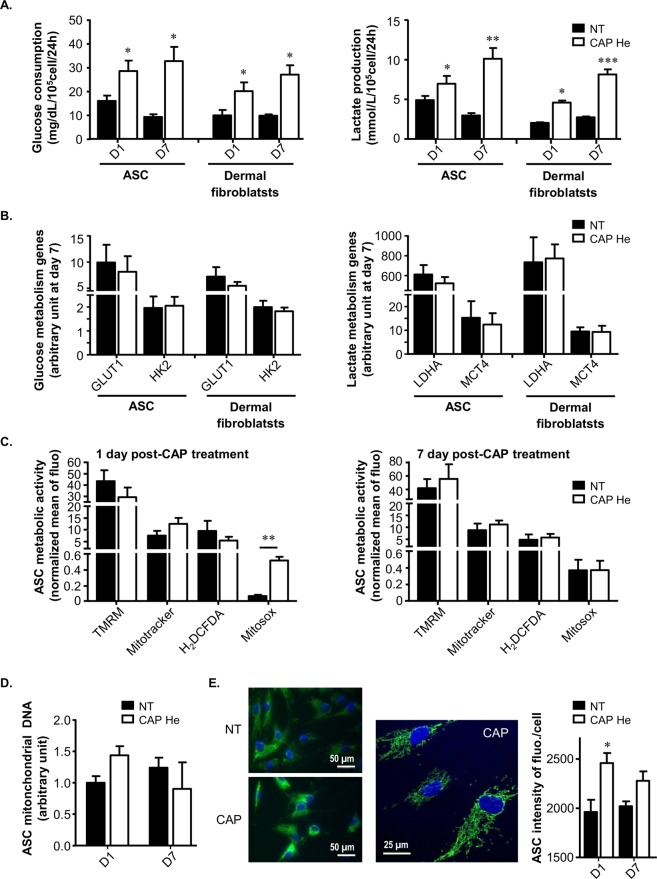
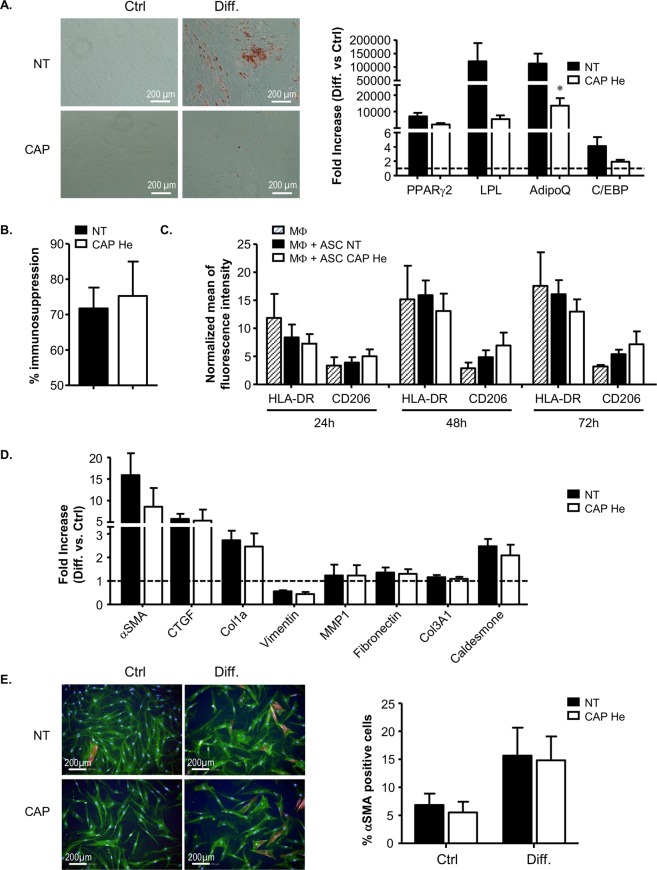
Cold Atmospheric Plasma (CAP) is a novel promising tool developed in several biomedical applications such as cutaneous wound healing or skin cancer. Nevertheless, in vitro studies are lacking regarding to CAP effects on cellular actors involved in healthy skin healing and regarding to the mechanism of action. In this study, we investigated the effect of a 3 minutes exposure to CAP-Helium on human dermal fibroblasts and Adipose-derived Stromal Cells (ASC) obtained from the same tissue sample. We observed that CAP treatment did not induce cell death but lead to proliferation arrest with an increase in p53/p21 and DNA damages. Interestingly we showed that CAP treated dermal fibroblasts and ASC developed a senescence phenotype with p16 expression, characteristic morphological changes, Senescence-Associated β-galactosidase expression and the secretion of pro-inflammatory cytokines defined as the Senescence-Associated Secretory Phenotype (SASP). Moreover this senescence phenotype is associated with a glycolytic switch and an increase in mitochondria content. Despite this senescence phenotype, cells kept in vitro functional properties like differentiation potential and immunomodulatory effects. To conclude, we demonstrated that two main skin cellular actors are resistant to cell death but develop a senescence phenotype while maintaining some functional characteristics after 3 minutes of CAP-Helium treatment in vitro.


Conflict of interest statement

The authors declare no competing interests.

Figures

Figure 1
Figure 1
Sensitivity of human ASC and dermal fibroblasts to CAP He treatment. (A) ASC and dermal fibroblasts were treated (CAP or NT) and labeled with AnnexinV-APC and Propidium Iodide (PI) at 24, 48 and 72 hours after treatment then analyzed by flow cytometry to determine the percentage of alive, apoptotic and dead cells (n = 3 to 4). (B) Cells were treated (CAP or NT) and the number of cell was quantified at indicated times. (ASC, n = 2 to 8; fibroblasts, n = 3 to 7). Data represent mean ± SEM of independent experiments as indicated (n).
Figure 2
Figure 2
CAP He treatment leads to irreversible proliferation stop and cell cycle arrest. (A) ASC and dermal fibroblasts were treated (CAP or NT) and cell number was determined during a longer time-course (n = 3). (B) A time-course of cell numeration was performed on treated cells cultured 7 days and passaged once (n = 3). (C) Cell cycle analysis was performed by Propidium Iodide staining and flow cytometry to estimate the distribution in G0/G1 and G2/M 6 hours after treatment (ASC, n = 3; fibroblasts, n = 4). (D) The percentage of cells in S phase 24 hours after treatment was determined after EdU incorporation by flow cytometry (ASC, n = 3; fibroblasts, n = 4). Data represent mean ± SEM of independent experiments as indicated (n).
Figure 3
Figure 3
CAP He treatment is associated with an increase in p21 p53 and DNA damage. (A) ASC and dermal fibroblasts were treated (CAP or NT) and p21 and p53 mRNA expression was quantified by RT-qPCR at indicated times. Results are presented in fold increase relative to their basal expression at day 0 (dot line). (B) p21 and p53 protein level in treated cells was assessed by Western-blot. Quantification corresponds to the fold increase in band intensity of CAP-treated cells normalized to corresponding untreated cells (NT) and divided by β-actin signal. (ASC, n = 3 to 7; fibroblasts, n = 4 to 9). (C) Cells were treated and fixed 7 days after treatment to evaluate DNA damage foci by γ-H2AX immunofluorescence. Images were acquired using the high content imaging system Operetta (Perkin Elmer, lens x20) to quantify immunofluorescence and foci number (n = 3). Data represent mean ± SEM of independent experiments as indicated (n).
Figure 4
Figure 4
Acquisition of a senescent phenotype by CAP He treated ASC and dermal fibroblatsts. (A) ASC and dermal fibroblasts were treated (CAP or NT) and nuclear p16 was imaged by immunofluorescence. Images were acquired using the high content imaging system Operetta (Perkin Elmer, lens x20) to quantify p16 nuclear spots number per cell and fluorescence intensity per cell (means of 5 fields). (B) Senescence associated-morphological change was observed 7 and 14 days after treatment. Cells morphology was evaluated by DAPI (nuclear) and β-tubulin (cytoskeleton) labeling using the high content imaging system Operetta (Perkin Elmer, lens x20). Pictures were taken with a Nikon, Eclipse, TE2000-S microscope (x200 magnification) (n = 4). (C) Nuclear size was additionally quantified (n = 4). (D) Senescence associated-β-galactosidase (SA-β-gal) was quantified 5 and 7 days after treatment by flow cytometry with a substrate (C12-FDG). Quantification is represented by the Mean of Fluorescence Intensity (MFI) normalized to the same condition without labelling. SA-β-gal was also evaluated by biochemical detection (blue staining) and pictures were taken at day 7 with a Nikon, Eclipse, TE2000-S microscope (ASC, n = 3 to 4; fibroblast, n = 3 to 5). (E) Senescence associated cytokine secretion was evaluated in treated cells supernatant for IL-6 and IL-8 by ELISA (n = 3 to 6). Data represent mean ± SEM of independent experiments as indicated (n).
Figure 5
Figure 5
The senescent phenotype is associated with a switch to a glycolytic metabolism and mitochondria modifications. (A) ASC and dermal fibroblasts were treated (CAP or NT) and glucose and lactate concentrations were measured in supernatant 1 (D1) and 7 (D7) days after the treatment (n = 3 to 6). (B) The level of GLUT1, HKII, LDHA and MCT4 mRNA expression was quantified by RT-qPCR 7 days after the treatment (ASC n = 6; fibroblasts n = 3). (C) ASC were treated (CAP or NT) and tested after 1 and 7 days for their mitochondrial membrane potential using the TMRM probe, the mitochondria mass using the MitoTracker probe, intracellular ROS production using H2DCFD and mitochondrial ROS production using Mitosox probe. Quantification is represented by the Mean of Fluorescence Intensity (MFI) normalized to the same condition without labelling (n = 4). (D) ASC were treated (CAP or NT) and tested for mitochondrial DNA quantification 1 and 7 days after treatment (n = 3). (E) ASC were treated (CAP or NT) and stained by immunofluorescence for mitochondria content 1 and 7 days after treatment. Pictures were taken with a Nikon, Eclipse, TE2000-S microscope (x400 magnification) with the same calibration and a zoom was realized with a confocal LSM 780 (Zeiss) (x630 magnification). Quantification is performed using the high content imaging system Operetta (Perkin Elmer, lens x20) (n = 3). Data represent mean ± SEM of independent experiments as indicated (n).
Figure 6
Figure 6
Analysis of senescent ASC and dermal fibroblasts functional properties. (A) ASC adipogenic potential was assessed 7 days after ASC treatment (CAP or NT) by induction of differentiation (Diff.) and analysis by Oil-Red-O staining of lipid droplets (day 21 after induction of differentiation) and by RT-qPCR for adipogenic gene expression PPARγ2, LPL, Adiponectin and C/EBPα (day 14 after induction of differentiation) in comparison to ASC cultivated in control medium (Ctrl, no differentiation). Pictures were made with Nikon, Eclipse, TE2000-S microscope. RT-qPCR results are represented in fold increase to control medium condition (dot line) for the different genes (n = 4). (B) ASC were tested for their immunosuppression activity by co-cultivating ASC with activated T lymphocytes (TL) labelled with the CFSE marker. The percentage of immunosuppression is determined by flow cytometry after 5 days (proliferating TL = % TL CFSE negative) (n = 6). (C) Effect on macrophage polarization was performed by co-cultivating ASC with M0 macrophages (monocytes cultivated 6 days with M-CSF) and macrophage phenotype analysis by flow cytometry at indicated times for membrane markers CD45, HLA-DR and CD206. Data are represented in mean of fluorescent intensity (MFI) normalized to isotype control among living macrophages (DAPI negative and CD45 positive cells) (n = 4). (D) Dermal fibroblasts 7 days after treatment (CAP or NT) were tested for their differentiation into myofibroblast under TGF-β stimulation by RT-qPCR for αSMA, CTGF, vimentin, MMP1, fibronectin, collagen COL1a, COL3A1 and caldesmone (72 hours). Data are represented in fold increase to control media (n = 3). (E) Dermal fibroblast activation was also estimated by α-SMA labeling and imaging using the high content imaging system Operetta (Perkin Elmer, lens x20) (n = 4). Data represent mean ± SEM of independent experiments as indicated (n).

Similar articles

Cited by

References

    1. Eming SA, Martin P, Tomic-Canic M. Wound repair and regeneration: mechanisms, signaling, and translation. Sci. Transl. Med. 2014;6:265sr6. doi: 10.1126/scitranslmed.3009337. - DOI - PMC - PubMed
    1. Gurtner GC, Werner S, Barrandon Y, Longaker MT. Wound repair and regeneration. Nature. 2008;453:314–321. doi: 10.1038/nature07039. - DOI - PubMed
    1. Eming SA, Krieg T, Davidson JM. Inflammation in wound repair: molecular and cellular mechanisms. J. Invest. Dermatol. 2007;127:514–525. doi: 10.1038/sj.jid.5700701. - DOI - PubMed
    1. Wynn TA, Martin P. Inflammation and metabolism in tissue repair and regeneration. Science. 2017;356:1026–1030. doi: 10.1126/science.aam7928. - DOI - PubMed
    1. Driskell RR, et al. Distinct fibroblast lineages determine dermal architecture in skin development and repair. Nature. 2013;504:277–281. doi: 10.1038/nature12783. - DOI - PMC - PubMed

Publication types

MeSH terms