. 2019 Jul;25(7):1089-1095.
doi: 10.1038/s41591-019-0469-4. Epub 2019 Jun 17.

Farm-like indoor microbiota in non-farm homes protects children from asthma development

Affiliations

Farm-like indoor microbiota in non-farm homes protects children from asthma development

Pirkka V Kirjavainen et al. Nat Med. 2019 Jul.

Erratum in

Abstract

Asthma prevalence has increased in epidemic proportions with urbanization, but growing up on traditional farms offers protection even today1. The asthma-protective effect of farms appears to be associated with rich home dust microbiota2,3, which could be used to model a health-promoting indoor microbiome. Here we show by modeling differences in house dust microbiota composition between farm and non-farm homes of Finnish birth cohorts4 that in children who grow up in non-farm homes, asthma risk decreases as the similarity of their home bacterial microbiota composition to that of farm homes increases. The protective microbiota had a low abundance of Streptococcaceae relative to outdoor-associated bacterial taxa. The protective effect was independent of richness and total bacterial load and was associated with reduced proinflammatory cytokine responses against bacterial cell wall components ex vivo. We were able to reproduce these findings in a study among rural German children2 and showed that children living in German non-farm homes with an indoor microbiota more similar to Finnish farm homes have decreased asthma risk. The indoor dust microbiota composition appears to be a definable, reproducible predictor of asthma risk and a potential modifiable target for asthma prevention.


Conflict of interest statement

Competing interests:

P.V.K, A.M.K., R.I.A., M.T., M.R., P.T., G.L., B.J., M.D., H.R., P.I.P., B.S., R.L., A.H., D.J.J.H. and J.P. do not have competing interests to disclose. M.J.E. and E.v.M. report patents EP2361632B1 and EP1964570B1 held by their institution LMU. E.v.M. reports recipient of funds from the European Commission for the conduct of the LUKAS (EFRAIM) and GABRIEL study and declares personal fees from Pharma Ventures, Peptinnovate Ltd., OM Pharma SA, European Commission/European Research Council Executive Agency, Tampereen Yliopisto, University of Turku, HAL Allergie GmbH, Ökosoziales Forum Oberösterreich and Mundipharma Deutschland GmbH & Co. KG; R.K. is a on the Scientific Advisory Board of Commense, Inc.

Figures

Extended Data Figure 1
Extended Data Figure 1. Bacterial and fungal diversity in farm- and non-farmhomes.
In the LUKA1 farm homes the bacterial/archaeal richness (N=107), with median 652 operational taxonomic units (OTUs, interquartile range (IQR) 567-708) and Shannon entropy, with median 7.8 (IQR 7.2-8.2), were consistently higher than in the majority of the rural control homes (N=96) where the respective values were 449 (IQR 384-555) for richness and 6.7 (IQR 5.9-7.2) for Shannon (Wilcoxon, two-sided p<0.0001). In fungal microbiota, there was a tendency for higher richness, with median 263 (217-306) fungal OTUs, and Shannon entropy, with median 3.9 (3.4-4.3), in the rural control (N=97) than farm homes (N=101) where the respective values were 252 (195-301;p=0.12) for richness and 3.7 (3.3.-4.1; Wilcoxon, two-sided p=0.07) for Shannon. The boxes represent IQR with median marked within the box, the whiskers represent minimum/maximum value within 1.5* IQR below the lower quartile/above the upper quartile, respectively, the dots represent outliers.
Extended Data Figure 2
Extended Data Figure 2. Key microbial sources in floor dust microbiota in farm- and non-farm homes
The relative abundance of (a) bovine- and (b) human associated bacterial/archaeal operational taxonomic units (OTUs) in living room floor dust in farm- (N=107) and non-farm homes (N=96) within LUKAS1 as determined by source tracking. Both comparisons (a-b) were significantly different with Wilcoxon test at two-sided p<0.0001. (c) Relative abundance of soil-associated bacterial/archaeal OTUs was higher in the LUKAS (LUKAS1 and 2) non-farm homes that resembled more LUKAS1 farm- (N=179) than non-farm homes (N=215) as defined by FaRMI (Wilcoxon test, two-sided p=0.0003). The boxes represent IQR with median marked within the box, the whiskers represent minimum/maximum value within 1.5* IQR below the lower quartile/above the upper quartile, respectively, the dots represent outliers.
Extended Data Figure 3
Extended Data Figure 3. Fungal microbiota in farm- and non-farm homes
Fungal taxa with significantly higher relative abundance in LUKAS1 farm (N=101) than non-farm (orange circles) or in non-farm (N=96) than farm homes (blue circles) as determined with ANCOM. Clades are coloured respectively up to genus level. Names are given for all phyla and for all taxa with significantly different relative abundance between farm than non-farm homes that have taxonomic assignment. The name of the highest taxonomic level is given for clade where the relative abundance between farm and non-farm homes is significantly different at several taxonomic levels. o=order.
Extended Data Figure 4
Extended Data Figure 4. Classification accuracy of LUKAS1 farm-like microbiota model in the data it was trained in (LUKAS1)
Based on the receiver operating characteristics (ROC) curve FaRMI had only moderate classification accuracy with area under the curve 0.74. This is a critical feature of FaRMI as it enables the detection of farm-like features also in non-farm homes.
Extended Data Figure 5
Extended Data Figure 5. Taxa included in models of LUKAS1 and GABRIELA farm-like indoor microbiota
That is variables contributing to FaRMI and FaRMIGABRIELA. respectively (see also Supplementary Table 9). Taxa in both models marked with yellow, taxa in LUKAS only with blue and taxa in GABRIELA only with red triangles. The direction of the triangle indicates negative (▼) or positive (▲) association with FaRMI and FaRMIGABRIELA. The size of the triangles are proportional to the variance explained by the taxa (adjusted partial R2); for the common taxa the higher adjusted R2. In three cases the direction was opposite between the two models, in these cases the triangles represent the model where the taxa had higher adjusted R2. Clades are colored where the adjusted R2 was >1%.
Extended Data Figure 6
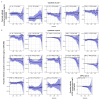
Extended Data Figure 6. Cytokine responses and serum CRP-levels in association to farm-like indoor microbiota
Quantile process plots of the quantile regression analysis showing the estimated change in cytokine concentration (pg/mL) at given percentile per one interquartile range change in Farm home Resembling Microbiota Index (FaRMI) at year 1 (a) and year 6 (b). The shaded areas show the 95% confidence intervals based on resampling with 1000 repetitions and where these do not overlap with the horizontal zero-change line the decrease/increase at that percentile is statistically significant (two-sided p-value without correction for multiple testing <0.05). Plots are presented for all cytokines that show tendency for significant (p<0.1) association with FaRMI between the 25th and 80th percentile without correction for multiple testing. Cytokines were measured from blood cultures stimulated with phorbol 12-myristate 13-acetate and ionomycin (PI), lipopolysaccharide (LPS), peptidoglycan (PPG). CRP was measures from serum. IL=interleukin, TNF=tumour necrosis factor, IFN=interferon and CRP=C-reactive protein.
Extended Data Figure 7
Extended Data Figure 7. Proportion of immunoglobulin-like transcript (ILT) 4 expressing plasmacytoid dendritic cells (pDC) is correlated with FaRMI.
Proportion of immunoglobulin-like transcript (ILT) 4 expressing plasmacytoid dendritic cells (pDC) increased with increasing FaRMI within LUKAS1 children living in a non-farm home who were not diagnosed with asthma by 6 years of age (N=26). In those children who had been diagnosed with asthma (N=16) such a correlation did not exist. In logistic regression analysis modelling the association between the ILT4 expression on pDCs and FaRMI the interaction term asthma ever * FaRMI was significant (p=0.03). The scatterplots fitted with simple linear regression lines
Figure 1
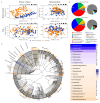
Figure 1. Differences between farm and non-farm rural home indoor microbiota.
(a) Dissimilarity (β –diversity) of bacterial/archaeal (phylogenetically informed) and fungal presence-absence and relative abundance patterns in living-room floor dust of farm (orange) and non-farm (blue) homes in LUKAS1. The first two PCoA axes with %-variance explained are presented. The differences between farm homes (n=107 with bacteria; n=101 with fungi) vs non-farm homes (n=96 with bacteria; n=97 with fungi) were significant in all the four distance matrices (Permutational Multivariance of Anova, p<0.001). α-Diversity of each sample is illustrated by the size of the points on the plot, which are directly proportional to richness (number of OTUs) or index of Shannon entropy as indicated. (b) Relative abundance of predominant bacterial phyla in non-farm and farm homes. (c) Bacterial/archaeal taxa with significantly higher relative abundance in farm than non-farm (orange circles) or in non-farm than farm homes (blue circles) as determined with ANCOM. Clades are coloured respectively up to family level. Top 20 bacterial genera with the greatest absolute difference in median relative abundance between farm and non-farm homes are indicated with a letter (A-T). For unassigned genera the highest assigned taxonomic name is presented (f=family, o=order).
Figure 2
Figure 2. Farm home-like indoor microbiota is associated with asthma protection in non-farm children.
Association between asthma during the first 6 years of life and compositional similarity of home indoor dust bacterial/archaeal or fungal microbiota at age 2 months to that in farm homes in the suburban LUKAS2 (n=164) and the pooled LUKAS1 and LUKAS2 (LUKAS, n=251) studies. The compositional similarity was defined as beta-diversity-derived predicted probability that the sample would be from a LUKAS1 farm as opposed to LUKAS1 non-farm home. The association with asthma is shown as adjusted odds ratio per interquartile range (IQR) of the probability. The center values represent the odds ratios and the error bars 95% confidence intervals.
Figure 3
Figure 3. Replication of the asthma protective effect of growing up in a home with a farm home -like indoor bacterial microbiota.
Principal coordinate analysis of (a) unweighted and (b) weighted Generalized UniFrac analysis of GABRIELA mattress dust and LUKAS floor dust bacterial/archaeal microbiota. N(LUKAS non-farm)=278, N(LUKAS farm home)=116, N(GABRIELA non-farm)=632, N(GABRIELA farm home)=399, N(GABRIELA animal shed)=50. While the cohort specific differences load primarily to the first axis (horizontal) in the presence-absence microbial data, the farm-effect on microbiota is visible in the second axis (vertical) where the farmhouses from both cohorts cluster closer to the animal shed microbiota. In the weighted analysis, this clustering pattern is also present but less pronounced. (c) The association between farm home–like indoor microbiota and asthma by 6 years of age among LUKAS (n=244) and by 6 to 12 years of age among GABRIELA (N=603) children living in a non-farm home. The farm home–like microbiota was defined as modeled FaRMILUKAS (derived in LUKAS1) and FaRMIGABRIELA (derived in GABRIELA) and adjusted odds ratios (aOR) are presented per interquartile range of modeled FaRMILUKAS(blue)/FaRMIGABRIELA (red). The center values represent the odds ratios and the error bars 95% confidence intervals (CI). The primary replication from LUKAS to GABRIELA is highlighted with light orange shade (d) The same 4 taxa (Streptococcaceae, Sphingobacteriia, Alphaproteobacteria and Cyanobacteria) marked with a black arch explained nearly two-thirds of the variance of FaRMI in both LUKAS (FaRMILUKAS) and in GABRIELA (FaRMIGABRIELA). The pie charts present all taxa with the adjusted R2>1%. The direction of the triangle indicates negative (▼) or positive (▲) association with FaRMI and/or FaRMIGABRIELA. The letters after the taxa names stand for p=phylum, c=class, o=order, f= family, and g=genus.

Comment in

References

    1. von Mutius E, Vercelli D. Farm living: effects on childhood asthma and allergy. Nature reviews. Immunology. 2010;10:861–868. - PubMed
    1. Ege MJ, et al. Exposure to environmental microorganisms and childhood asthma. The New England journal of medicine. 2011;364:701–709. - PubMed
    1. Schuijs MJ, et al. Farm dust and endotoxin protect against allergy through A20 induction in lung epithelial cells. Science. 2015;349:1106–1110. - PubMed
    1. Karvonen AM, et al. Confirmed moisture damage at home, respiratory symptoms and atopy in early life: a birth-cohort study. Pediatrics. 2009;124:e329–338. - PubMed
    1. Liu AH. Revisiting the hygiene hypothesis for allergy and asthma. Journal of Allergy and Clinical Immunology. 2015;136:860–865. - PubMed

Publication types