. 2019 Jul;15(7):737-746.
doi: 10.1038/s41589-019-0279-5. Epub 2019 Jun 17.

Electrophilic PROTACs that degrade nuclear proteins by engaging DCAF16

Affiliations

Electrophilic PROTACs that degrade nuclear proteins by engaging DCAF16

Xiaoyu Zhang et al. Nat Chem Biol. 2019 Jul.

Abstract

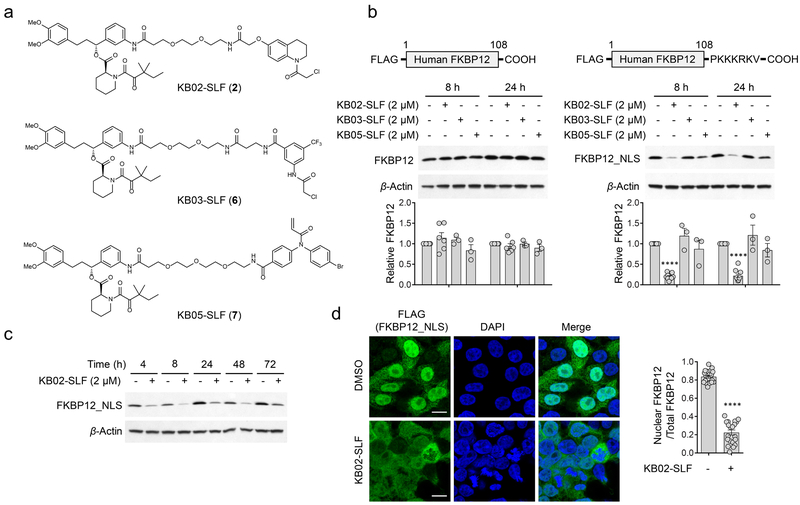
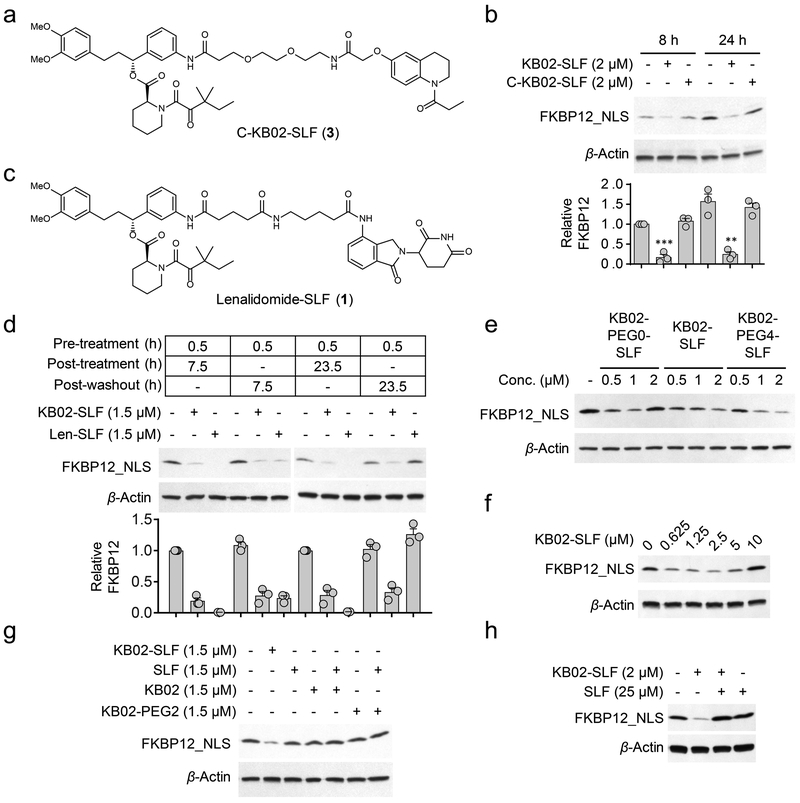
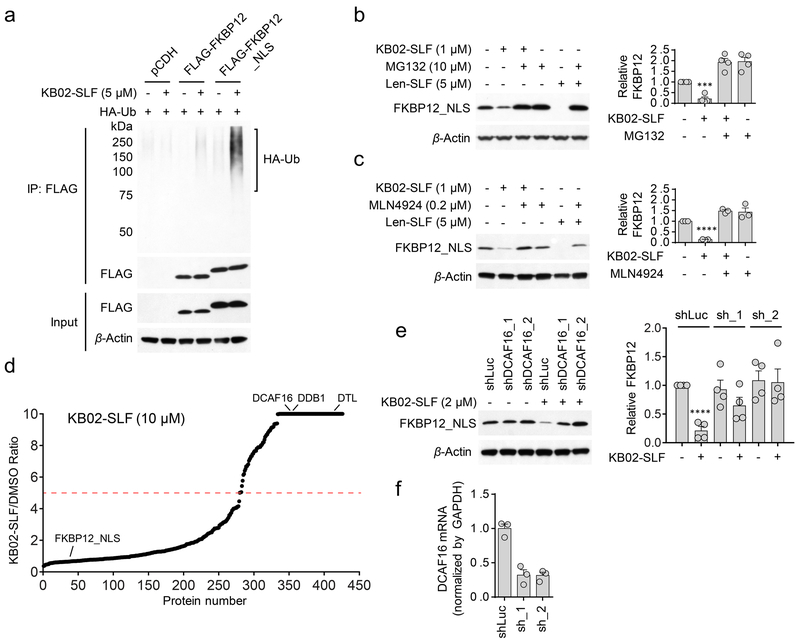
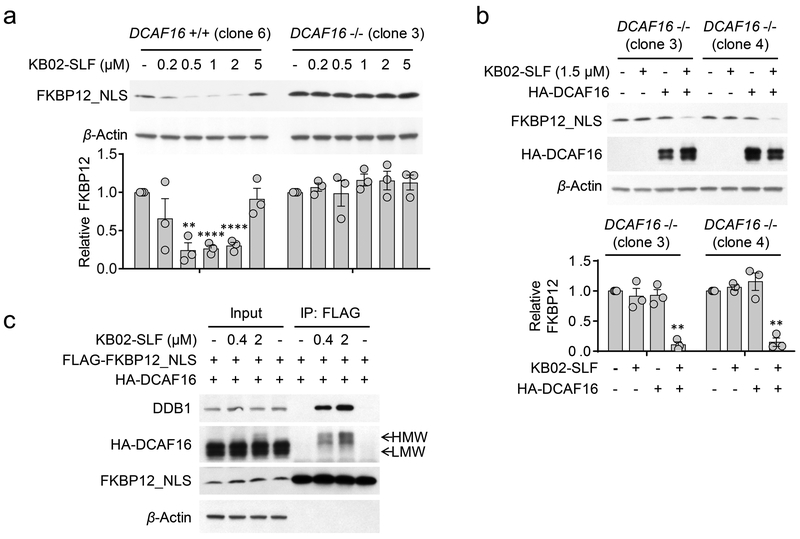
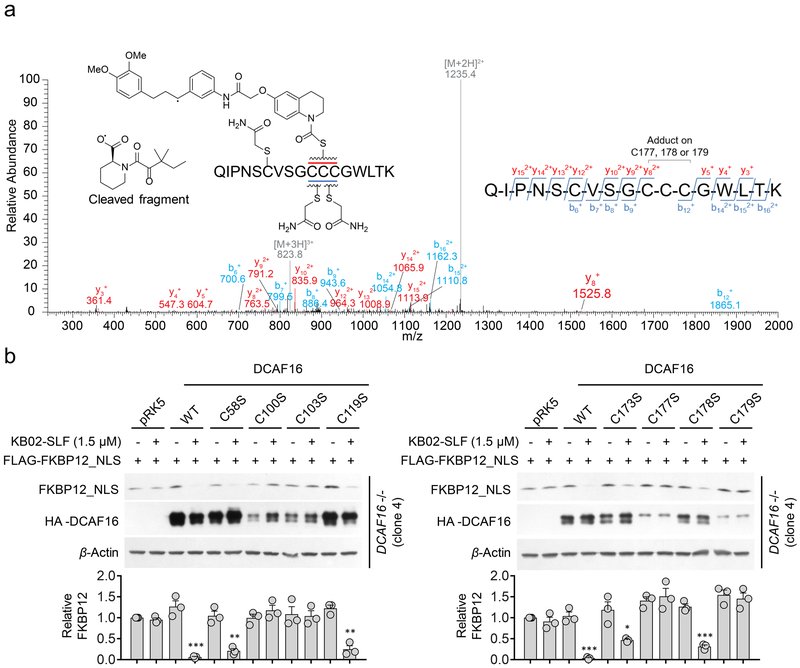
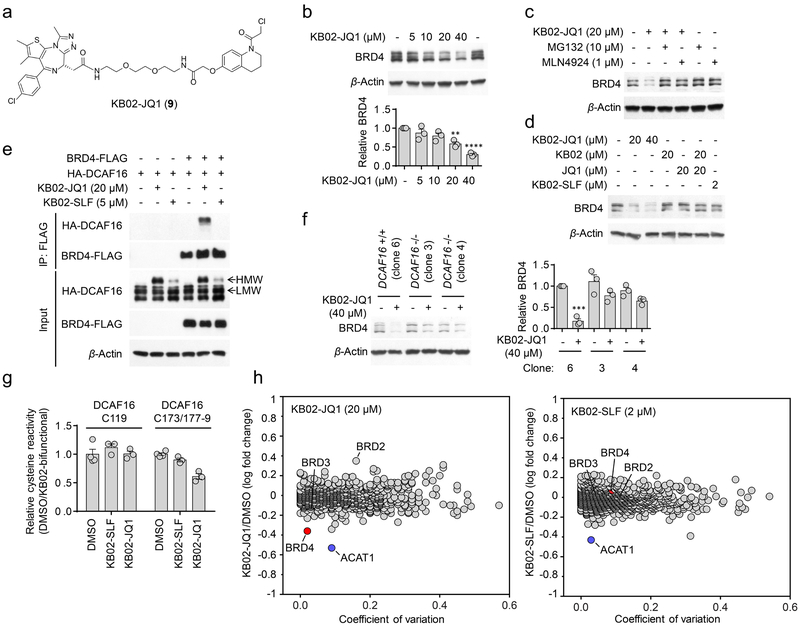
Ligand-dependent protein degradation has emerged as a compelling strategy to pharmacologically control the protein content of cells. So far, however, only a limited number of E3 ligases have been found to support this process. Here, we use a chemical proteomic strategy that leverages broadly reactive, cysteine-directed electrophilic fragments coupled to selective ligands for intracellular proteins (for example, SLF for FKBP12, JQ1 for BRD4) to screen for heterobifunctional degrader compounds (or proteolysis targeting chimeras, PROTACs) that operate by covalent adduction of E3 ligases. This approach identified DCAF16-a poorly characterized substrate recognition component of CUL4-DDB1 E3 ubiquitin ligases-as a target of electrophilic PROTACs that promote the nuclear-restricted degradation of proteins. We find that only a modest fraction (~10-40%) of DCAF16 needs to be modified to support protein degradation, pointing to the potential for electrophilic PROTACs to induce neosubstrate degradation without substantially perturbing the function of the participating E3 ligase.


Figures

Figure 1.
Figure 1.. Discovery of an electrophilic PROTAC that promotes the loss of nuclear FKBP12.
a, Structures of electrophilic bifunctional compounds, or PROTACs, containing scout fragments (KB02, KB03, and KB05) coupled to the FKBP12 ligand SLF. b, Western blot using anti-FLAG antibody of cytosolic (FLAG-FKBP12) and nuclear (FLAG-FKBP12_NLS) FKBP12 proteins expressed by stable transduction in HEK293T cells following 8 or 24 h of treatment with electrophilic PROTACs (2 µM). Bar graph (bottom) represents quantification of the relative FKBP12 protein content, with DMSO-treated cells set to a value of 1. Data represent mean values ± SEM (n = 3 biologically independent experiments for KB03-SLF and KB05-SLF-treated cells, n = 6 biologically independent experiments for DMSO and KB02-SLF-treated cells expressing FLAG-FKBP12, n = 10 biologically independent experiments for DMSO and KB02-SLF-treated cells expressing FLAG-FKBP12_NLS). Statistical significance was calculated with unpaired two-tailed Student’s t-tests comparing DMSO- to KB02-SLF-treated samples. ****P < 0.0001. P values were 6.5×10⁻¹⁸ and 4.0×10⁻¹³. Full images of blots are shown in Supplementary Fig. 14. c, Time-dependent degradation of FLAG-FKBP12_NLS in HEK293T cells treated with KB02-SLF (2 µM). The result is a representative of two experiments (n = 2 biologically independent experiments). Full images of blots are shown in Supplementary Fig. 14. d, Immunofluorescence using anti-FLAG antibody of FLAG-FKBP12_NLS in HEK293T cells following treatment with DMSO or KB02-SLF (2 µM, 8 h). Bar graph (right) represents quantification of the relative nuclear to whole cell immunostaining for DMSO- and KB02-SLF-treated samples. Data represent mean values ± SEM (n = 20 from two biologically independent experiments. 10 images were collected from each biological replicate). Statistical significance was calculated with unpaired two-tailed Student’s t-tests comparing DMSO- to KB02-SLF-treated samples. ****P < 0.0001. P value was 1.3×10⁻²¹. Scale bar, 10 µm.
Figure 2.
Figure 2.. KB02-SLF promotes the loss of nuclear FKBP12.
a, Structure of non-electrophilic control compound (C-KB02-SLF). b, Western blot of FLAG-FKBP12_NLS in HEK293T cells treated with KB02-SLF or C-KB02-SLF (2 µM, 8 or 24 h). Bar graph (bottom) represents quantification of the relative FKBP12 protein content, with DMSO-treated cells set to a value of 1. Data represent mean values ± SEM (n = 3 biologically independent experiments). Statistical significance was calculated with unpaired two-tailed Student’s t-tests comparing DMSO- to KB02-SLF-treated samples. **P < 0.01; ***P < 0.001. P values were 0.00036 and 0.0027. Full images of blots are shown in Supplementary Fig. 14. c, Structure of lenalidomide-SLF. d, Western blot of FLAG-FKBP12_NLS in HEK293T cells pre-treated with 1.5 µM of KB02-SLF or lenalidomide (Len)-SLF for 0.5 h, washed with PBS, and resuspended in fresh media for additional 7.5 or 23.5 h. Bar graph (bottom) represents quantification of the relative FKBP12 protein content, with DMSO-treated cells set to a value of 1. Data represent mean values ± SEM (n = 3 biologically independent experiments). Full images of blots are shown in Supplementary Fig. 14. e, Western blot of FLAG-FKBP12_NLS following treatment of HEK293T cells with KB02-PEG0-SLF, KB02-SLF, or KB02-PEG4-SLF (10) (0.5-2 µM, 8 h). The result is a representative of three experiments (n = 3 biologically independent experiments). Full images of blots are shown in Supplementary Fig. 14. f, Concentration-dependent degradation of FLAG-FKBP12_NLS by KB02-SLF in HEK293T cells (24 h treatment with indicated concentrations of KB02-SLF). The result is a representative of four experiments (n = 4 biologically independent experiments). Full images of blots are shown in Supplementary Fig. 14. g, Western blot of FLAG-FKBP12_NLS in HEK293T cells following treatment of HEK293T cells with KB02, KB02-PEG2 (11), SLF, or the combination of SLF and KB02 or KB02-PEG2 (1.5 µM, 8 h). The result is a representative of two experiments (n = 2 biologically independent experiments). Full images of blots are shown in Supplementary Fig. 14. h, Degradation of FLAG-FKBP12_NLS by KB02-SLF (2 µM, 8 h) is blocked by excess SLF (25 µM). The result is a representative of three independent experiments (n = 3 biologically independent experiments). Full images of blots are shown in Supplementary Fig. 14.
Figure 3.
Figure 3.. KB02-SLF promotes proteasomal degradation of FKBP12 via the action of Cullin-RING ubiquitin ligases.
a, KB02-SLF mediates polyubiquitination of nuclear (FLAG-FKBP12_NLS), but not cytosolic (FLAG-FKBP12) FKBP12 in HEK293T cells. HEK293T cells stably expressing FLAG-FKBP12 or FLAG-FKBP12_NLS were transiently transfected with HA-Ubiquitin (HA-Ub) for 24 h and then treated with DMSO or KB02-SLF (5 µM) in the presence of the proteasome inhibitor MG132 (10 µM) for 2 h. The result is a representative of three experiments (n = 3 biologically independent experiments). Full images of blots are shown in Supplementary Fig. 14. b, c, KB02-SLF-mediated FLAG-FKBP12_NLS degradation is blocked by MG132 (b) and the neddylation inhibitor MLN4924 (c). HEK293T cells stably expressing FLAG-FKBP12_NLS were co-treated with KB02-SLF (1 µM) and MG132 (10 µM) or MLN4924 (0.2 µM) for 8 h. Lenalidomide (Len)-SLF was used as a positive control. Bar graph (right) represents quantification of the relative FKBP12 protein, with DMSO-treated cells set to a value of 1. Data represent mean values ± SEM (n = 4 biologically independent experiments for (b), n = 3 biologically independent experiments for (c)). Statistical significance was calculated with unpaired two-tailed Student’s t-tests comparing DMSO- to KB02-SLF-treated samples without MG132 or MLN4924. ***P < 0.001; ****P < 0.0001. P values were 0.00016 (b) and 1.8×10⁻⁷ (c). Full images of blots are shown in Supplementary Fig. 14. d, SILAC heavy/light (KB02-SLF/DMSO) ratio values of proteins identified in anti-FLAG affinity enrichment experiments (outlined in Supplementary Fig. 5a), where a high ratio indicates proteins selectively enriched from cells treated with KB02-SLF (10 µM). The red dashed line marks a 5-fold ratio value, which was used as a threshold for designating proteins that were substantially enriched by KB02-SLF. The results shown are average ratios from three experiments (n = 3 biologically independent experiments). See method for detailed criteria of data filtering. e, Western blot of stably expressed FLAG-FKBP12_NLS in HEK293T cells transiently transduced with shRNAs targeting DCAF16 (sh_1 and sh_2) or a control shRNA (shLuc) followed by treatment with KB02-SLF (2 µM, 8 h). Right, quantification of the relative FKBP12 protein content, with DMSO-treated cells expressing shLuc set to a value of 1. Data represent mean values ± SEM (n = 4 biologically independent experiments). Statistical significance was calculated with unpaired two-tailed Student’s t-tests comparing DMSO- to KB02-SLF-treated samples. ****P < 0.0001. P value was 0.000036. Full images of blots are shown in Supplementary Fig. 14. f, DCAF16 mRNA was measured by qPCR. Data represent mean values ± SEM (n = 3 biologically independent experiments).
Figure 4.
Figure 4.. DCAF16 mediates KB02-SLF-induced degradation of FKBP12.
a, Concentration-dependent degradation of stably expressed FLAG-FKBP12_NLS in DCAF16+/+ (clone 6) and DCAF16−/− (clone 3) HEK293 cells following treatment with KB02-SLF (0.2–5 µM) for 8 h. Bar graph (bottom) represents quantification of the relative FKBP12 protein content, with DMSO-treated cells set to a value of 1. Data represent mean values ± SEM (n = 3 biologically independent experiments). Statistical significance was calculated with unpaired two-tailed Student’s t-tests comparing DMSO- to KB02-SLF-treated samples. **P < 0.01; ****P < 0.0001. P values were 0.0015, 0.000059 and 0.000075. Full images of blots are shown in Supplementary Fig. 14. b, Expression of HA-DCAF16 in DCAF16−/− cells restored KB02-SLF-mediated degradation of FLAG-FKBP12_NLS. DCAF16−/− cells (clone 3 and 4) were transiently transfected with FLAG-FKBP12_NLS and either HA-DCAF16 or empty pRK5 vector as a control for 24 h and then treated with KB02-SLF (1.5 µM, 8 h). Bar graph (bottom) represents quantification of the relative FKBP12 protein content, with DMSO-treated cells set to a value of 1. Data represent mean values ± SEM (n = 3 biologically independent experiments). Statistical significance was calculated with unpaired two-tailed Student’s t-tests comparing DMSO- to KB02-SLF-treated samples. **P < 0.01. P values were 0.0016 and 0.0033. Full images of blots are shown in Supplementary Fig. 14. c, A higher molecular weight (HMW) form of HA-DCAF16 is observed in HEK293T cells treated with KB02-SLF (0.4 or 2 µM, 2 h in the presence of 10 µM MG132), and this HMW form, but not the lower molecular weight (LMW) form of HA-DCAF16 co-immunoprecipitated with FLAG-FKBP12_NLS. The result is a representative of three experiments (n = 3 biologically independent experiments). Full images of blots are shown in Supplementary Fig. 14.
Figure 5.
Figure 5.. Evaluation of DCAF16 cysteines involved in KB02-SLF-induced degradation of FKBP12.
a, MS/MS spectrum of KB02-PEG0-SLF-modified, triply charged DCAF16 peptide (amino acids 168–184; see Supplementary Fig. 9b). The m/z 1235.4 ion represents a doubly charged DCAF16 peptide (168–184) with a cleaved probe adduct that occurs in MS/MS. The b- and y-ions are shown along with the peptide sequence. The experiment is repeated twice independently with similar results. b, Western blot of FLAG-FKBP12_NLS in DCAF16−/− cells (clone 4) expressing WT or C58S, C100S, C103S, C119S, C173S, C177S, C178S, or C179S mutants of HA-DCAF16 (or empty pRK5 vector control) following treatment with KB02-SLF (1.5 µM, 8 h). Bar graph (bottom) represents quantification of the relative FKBP12 protein content, with DMSO-treated cells set to a value of 1. Data represent mean values ± SEM (n =3 biologically independent experiments). Statistical significance was calculated with unpaired two-tailed Student’s t-tests comparing DMSO- to KB02-SLF-treated samples. *P < 0.05; **P < 0.01; ***P < 0.001. P values were 0.00098, 0.0024, 0.0011, 0.00057, 0.019 and 0.00028. Full images of blots are shown in Supplementary Fig. 14.
Figure 6.
Figure 6.. KB02-JQ1 degrades BRD4 by sub-stoichiometric modification of DCAF16.
a, Structure of KB02-JQ1. b, Concentration-dependent degradation of endogenous BRD4 in HEK293T cells following treatment with KB02-JQ1 for 24 h. Bar graph (bottom) is quantification of the relative BRD4 level. The BRD4 level from DMSO-treated cells is set to 1. Data represent mean values ± SEM (n = 3 biologically independent experiments). Statistical significance was calculated with unpaired two-tailed Student’s t-tests comparing DMSO- to KB02-JQ1-treated samples. **P < 0.01; ****P < 0.0001. P values were 0.0014 and 0.000012. Full images of blots are shown in Supplementary Fig. 14. c, KB02-JQ1-mediated BRD4 degradation is blocked by proteasome inhibitor MG132 and neddylation inhibitor MLN4924. HEK293T cells were preincubated with 10 µM MG132 or 1 µM MLN4924 for 4 h, followed by 20 h of treatment with 20 µM KB02-JQ1 and 10 µM MG132 or 1 µM MLN4924. The result is a representative of three experiments (n = 3 biologically independent experiments). Full images of blots are shown in Supplementary Fig. 14. d, Western blot of BRD4 in HEK293T cells following treatment with the indicated concentrations of KB02-JQ1, KB02, JQ1, KB02-SLF, or the combination of KB02 and JQ1 (24 h). The result is a representative of two experiments (n = 2 biologically independent experiments). The experiment is repeated twice independently with similar results. Full images of blots are shown in Supplementary Fig. 14. e, FLAG-tagged BRD4 co-immunoprecipitated with HA-DCAF16 in the presence of KB02-JQ1, but not KB02-SLF. HEK293T cells were co-transfected with BRD4-FLAG and HA-DCAF16 or pRK5 vector for 24 h and treated with KB02-JQ1 (20 µM), KB02-SLF (5 µM), or DMSO in the presence of MG132 (10 µM) for 2 h. The experiment is repeated four times independently with similar results. Full images of blots are shown in Supplementary Fig. 14. f, Degradation of BRD4 in HEK293 DCAF16+/+ (clone 6) and −/− (clone 3 and 4) cells following 24 h of treatment with 40 µM KB02-JQ1. Bar graph (right) represents quantification of the relative BRD4 protein content, with DMSO-treated cells set to a value of 1. Data represent mean values ± SEM (n = 3 biologically independent experiments). Statistical significance was calculated with unpaired two-tailed Student’s t-tests comparing DMSO- to KB02-JQ1-treated samples. ***P < 0.001. P value was 0.00014. Full images of blots are shown in Supplementary Fig. 14. g, Competitive ABPP results measuring relative reactivity (DMSO/KB02-bifunctional) of C119- and C173/C177–179-containing DCAF16 tryptic peptides from DMSO-, 2 µM KB02-SLF-, or 20 µM KB02-JQ1-treated HEK293T cells, with the peptide signals from DMSO-treated cells set to a value of 1. Data represent mean values ± SEM (n = 3 biologically independent samples). See Supplementary Fig. 12 for more details on the experimental protocol and plots of global cysteine reactivity. h, Log10 fold-change in protein abundance between heavy- and light-isotopically labeled HEK293T cells treated with KB02-JQ1 (20 µM, heavy), KB02-SLF (2 µM, heavy) or DMSO (light) for 24 h. The y-axis and x-axis correspond to the average relative log10 abundance (KB02-JQ1/DMSO or KB02-SLF/DMSO) and coefficient of variation, respectively, from two experiments (n = 2 biologically independent experiments). The average relative log10 abundance of each protein is normalized to the average log10 abundance of proteins in control DMSO/DMSO samples (to account for slight deviations in heavy isotope incorporation; Supplementary Dataset 5).

Comment in

  • Stick it to E3s.
    Brand M, Winter GE. Brand M, et al. Nat Chem Biol. 2019 Jul;15(7):655-656. doi: 10.1038/s41589-019-0312-8. Nat Chem Biol. 2019. PMID: 31209352 No abstract available.
  • Chemoproteomic-Driven Discovery of Covalent PROTACs.
    Zhou Y, Xiao Y. Zhou Y, et al. Biochemistry. 2020 Jan 21;59(2):128-129. doi: 10.1021/acs.biochem.9b00795. Epub 2019 Sep 20. Biochemistry. 2020. PMID: 31538467 No abstract available.

References

    1. Cromm PM & Crews CM Targeted Protein Degradation: from Chemical Biology to Drug Discovery. Cell chemical biology 24, 1181–1190 (2017). - PMC - PubMed
    1. Lebraud H & Heightman TD Protein degradation: a validated therapeutic strategy with exciting prospects. Essays Biochem 61, 517–527 (2017). - PubMed
    1. Bondeson DP & Crews CM Targeted Protein Degradation by Small Molecules. Annu Rev Pharmacol Toxicol 57, 107–123 (2017). - PMC - PubMed
    1. Collins I, Wang H, Caldwell JJ & Chopra R Chemical approaches to targeted protein degradation through modulation of the ubiquitin-proteasome pathway. Biochem J 474, 1127–1147 (2017). - PMC - PubMed
    1. Hughes SJ & Ciulli A Molecular recognition of ternary complexes: a new dimension in the structure-guided design of chemical degraders. Essays Biochem 61, 505–516 (2017). - PMC - PubMed

Methods-only References

    1. Weerapana E, Speers AE & Cravatt BF Tandem orthogonal proteolysis-activity-based protein profiling (TOP-ABPP)--a general method for mapping sites of probe modification in proteomes. Nat Protoc 2, 1414–1425 (2007). - PubMed

Publication types