. 2019 Oct;3(10):783-795.
doi: 10.1038/s41551-019-0411-6. Epub 2019 Jun 17.

Traceless aptamer-mediated isolation of CD8+ T cells for chimeric antigen receptor T-cell therapy

Affiliations

Traceless aptamer-mediated isolation of CD8+ T cells for chimeric antigen receptor T-cell therapy

Nataly Kacherovsky et al. Nat Biomed Eng. 2019 Oct.

Abstract

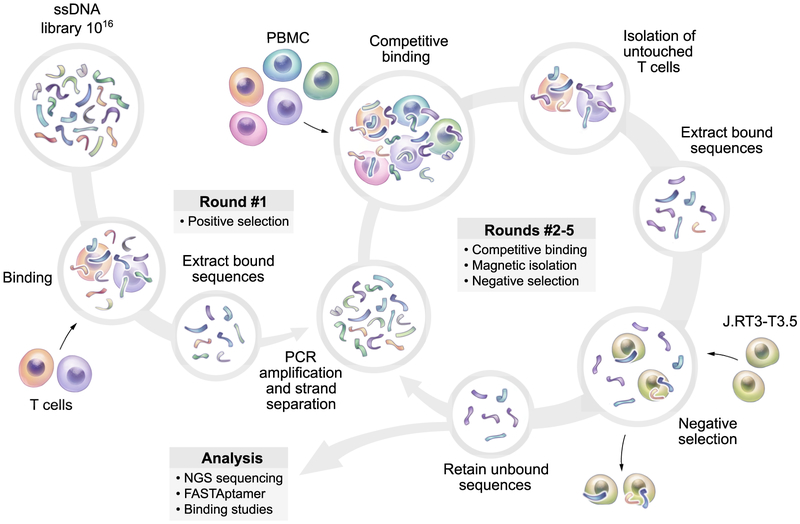
Chimeric antigen receptor T-cell therapies using defined product compositions require high-purity T-cell isolation systems that, unlike immunomagnetic positive enrichment, are inexpensive and leave no trace on the final cell product. Here, we show that DNA aptamers (generated with a modified cell-SELEX procedure to display low-nanomolar affinity for the T-cell marker CD8) enable the traceless isolation of pure CD8+ T cells at low cost and high yield. Captured CD8+ T cells are released label-free by complementary oligonucleotides that undergo toehold-mediated strand displacement with the aptamer. We also show that chimeric antigen receptor T cells manufactured from these cells are comparable to antibody-isolated chimeric antigen receptor T cells in proliferation, phenotype, effector function and antitumour activity in a mouse model of B-cell lymphoma. By employing multiple aptamers and the corresponding complementary oligonucleotides, aptamer-mediated cell selection could enable the fully synthetic, sequential and traceless isolation of desired lymphocyte subsets from a single system.


Figures

Fig. 1 ∣
Fig. 1 ∣. Schematic representation of competitive cell-SELEX with magnetic depletion from PBMCs.
A DNA aptamer library underwent one round of positive selection against mixed T cells followed by four rounds of consecutive competitive selection and negative selection against PBMCs and CD4loCD8 J.RT3-T3.5 cells, respectively, under increasingly stringent conditions. After competitive selection, untouched T cells and bound aptamers were isolated from PMBCs by depleting non-target cell using a Pan T Cell Isolation Kit.
Fig. 2 ∣
Fig. 2 ∣. Aptamers 1, 3, and 8 bind to CD8a glycoprotein.
a, Flow cytometry plots of 50nM random (RN), A1, A3, and A8 aptamer binding to CD4+ and CD8+ T cells in a mixed T cell population. Plots are representative of 1 independent experiment. b, Flow cytometry analysis of CD8a antibody (CD8a Ab) and 10nM RN, A1, A3, and A8 aptamer binding to CD8+ T cells 24 hours after nucleofection with non-specific (NS) siRNA or CD8 siRNA duplexes. Histograms are representative of 3 independent experiments with technical triplicates. Chart indicates binding to CD8 siRNA-treated cells relative to NS siRNA treated controls. Data are mean ± s.d., n = 3 independent experiments, *P < 0.05 and **P < 0.01 (one-way ANOVA with Bonferroni correction). c, Flow cytometry analysis of CD8a Ab and 10nM RN, A1, A3, and A8 aptamer binding to CD8 Jurkat cells 24 hours after nucleofection with a CD8a-hnRNP-M-EGFP plasmid. Plots are representative of 3 biological replicates with technical triplicates. Chart indicates percentage of GFP+ Jurkats that were also positive for antibody or aptamer binding. Data are mean ± s.d., n = 3 biologically independent samples, *P < 0.05, ***P < 0.001, and ****P < 0.0001 (paired one-way ANOVA with Dunnett’s test). d, BLI measured association and dissociation kinetics of serially diluted CD8a protein binding to immobilized A1, A3, and A8 aptamers. The association phase is illustrated from 0 to 1200 seconds, whereas dissociation is shown from 1200-1800 seconds. KD’s were calculated by performing a global fit of the kinetic data at the different concentrations of CD8a protein to a 1:1 binding model. KD’s are mean ± s.d., n = 3 individual concentrations for A1 and 4 individual concentrations for A3 and A8. e, Flow cytometry binding curves of A1, A3, and A8 aptamers to CD8+ T cells, normalized to 200nM of A8 binding. Curves represent a non-linear regression assuming one site total binding of 3 independent experiments with technical triplicates. KD’s were calculated by averaging the individual regressions values of the independent experiments. Curves and KD’s are mean ± s.d., n = 3 independent experiments.
Fig. 3 ∣
Fig. 3 ∣. Complementary reversal agent designed to occlude binding of A3 aptamer with modified toehold.
a, Predicted minimum free energy (MFE) secondary structure of a modified A3 aptamer with a 3’ 8-bp toehold (A3t) using NUPACK software (temp = 4C; Na+ = 137mM; Mg++ = 5.5mM). The orange line represents the 36-bp region that a complementary reversal agent (RA) was designed to anneal. b, Predicted MFE secondary structure of the A3t aptamer after strand displacement with the RA (temp = 20C; Na+ = 137mM; Mg++ = 5.5mM).
Fig. 4 ∣
Fig. 4 ∣. Isolation of label-free CD8+ T cells from PBMCs using a reversible, aptamer-based selection strategy.
a, Schematic representation of traceless selection of CD8+ T cells using the A3t aptamer. Biotinylated aptamer (5nM) pre-loaded onto Miltenyi Anti-Biotin Microbeads was incubated with PBMCs to magnetically label CD8+ T cells. The cell suspension was applied onto an LS Column under a magnetic field, in which unlabeled cells were removed in the flow through (FT) fraction. Microbead labeled CD8+ T cells that remain on the column are incubated with 100X excess of complementary RA, and released CD8+ T cells are washed off the column in the RA elution (RAE) fraction. Remaining cells on the column are removed using a plunger column flush (CF) in the absence of the magnetic field. b, Flow cytometry histograms of CD8 expression in the different fractions of standard, antibody-based Miltenyi CD8 Microbead isolation and traceless aptamer-based isolation. Histograms are representative of 3 independent experiments with technical triplicates. c, Flow cytometry plots of CD3 and CD16 expression in CD8+ antibody-isolated CF and aptamer-isolated RAE cell fractions to distinguish between CD3+ CD16 T cells and CD3CD16+ monocytes and NK cells. Plots are representative of 3 independent experiments with technical triplicates. d-f, Flow cytometry analysis of yield, purity, and CD8 MFI of CD3+CD8+CD16 T cells in different fractions of antibody- and aptamer-based isolations. Symbols represent different donors from separate isolation experiments, and all data was collected in technical triplicates. Data are mean ± s.d., n = 3, P > 0.05 and *P < 0.05 (d-f, paired one-way ANOVA with Tukey’s test).
Fig. 5 ∣
Fig. 5 ∣. Characterization of CD19 CAR T cells generated from antibody- and aptamer-isolated cells.
a, 2nd generation CD19 CAR T cell construct with EGFRt reporter used to retrovirally transduce isolated T cells. b, Flow cytometry analysis of EGFRt expression in antibody- and aptamer-isolated T cells 9-days post initial bead stimulation (S1D9) and 13-days post rapid expansion protocol (REP, S1R1D13) with irradiated CD19+ TM-LCL cells. Timeline of cell expansion is shown in Supplementary Fig. 12. Chart indicates EGFRt reporter MFI at S1R1D13, with symbols as in Fig. 4d-f. Flow histograms are representative of 1 independent experiment. Data are mean ± s.d., n = 3, P > 0.05 (two-sided paired t-test). c, Growth of non-transduced mock T cells post bead stimulation. Symbols as in Fig. 4d-f, n = 3, P > 0.05 (paired two-way ANOVA with Bonferroni correction). Curves represent a least-squares fit to the exponential growth equation. d, Flow cytometry analysis of Ki-67 expression in mock and CD19 CAR T cells on S1D14 immediately before REP. Symbols as in Fig. 4d-f. Data are mean ± s.d., n = 3, P > 0.05 (paired two-way ANOVA with Sidak correction). e, Flow cytometry analysis PD1/TIM3/LAG3 expression in mock and CD19 CAR T cells on S1D14 immediately before REP. Individual donor values can be found in Supplemental Fig. 14. Pie charts show the mean phenotype of the cells, n = 3 biologically independent samples, P > 0.05, *P < 0.05, and **P < 0.01 (paired two-way ANOVA with Bonferroni correction). f, Flow cytometry analysis of CD62L/CD45RA expression in mock and CD19 CAR T cells on S1D14 immediately before REP and on S1R1D14 immediately before functional assays. Individual donor values can be found in Supplemental Fig. 15. Pie charts show the mean phenotype of the cells, n = 3 biologically independent samples, P > 0.05 and *P < 0.05 (paired two-way ANOVA with Bonferroni correction). g,h, In vitro anti-tumor cytotoxicity and cytokine release of mock and CD19 CAR T cells. For h, symbols as in Fig. 4d-f. Data are mean ± s.d., n = 3 biologically independent samples, P > 0.05 (g, paired two-way ANOVA with Bonferroni correction; h, paired two-way ANOVA with Sidak correction).
Fig. 6 ∣
Fig. 6 ∣. Tumor stress test with antibody- and aptamer-isolated CD8+ CD19 CAR T cells.
NSG mice were inoculated intravenously (i.v.) with 5 × 10⁵ CD19+ Raji cells and treated 7 days later with 107 CD8+ mock or CD19 CAR T cells from antibody- or aptamer-isolated donor cells. a, Flux of the systemic tumors. The “†” symbol represents euthanasia of individual mice. The faint curves are the tumor flux values for the individual mice (3 mice per donor per group), whereas the bold curves are the mean flux values for the respective CD19 CAR T cell treatment groups over time. b, Kaplan-Meier survival curves. Median survival time (days) of the CD19 CAR T cell treatment groups were as follows; antibody: 55; aptamer: 55. n = 9 (3 mice per donor), P > 0.05 (two-sided log-rank test).

Similar articles

Cited by

References

    1. Brentjens RJ et al. CD19-targeted T cells rapidly induce molecular remissions in adults with chemotherapy-refractory acute lymphoblastic leukemia. Sci. Transl. Med. 5, 177ra138 (2013). - PMC - PubMed
    1. Davila ML et al. Efficacy and toxicity management of 19–28z CAR T cell therapy in B cell acute lymphoblastic leukemia. Sci. Transl. Med. 6, 224ra225 (2014). - PMC - PubMed
    1. Lee DW et al. T cells expressing CD19 chimeric antigen receptors for acute lymphoblastic leukaemia in children and young adults: a phase 1 dose-escalation trial. Lancet 385, 517–528 (2015). - PMC - PubMed
    1. Mirzaei HR, Rodriguez A, Shepphird J, Brown CE & Badie B Chimeric Antigen Receptors T Cell Therapy in Solid Tumor: Challenges and Clinical Applications. Front. Immunol. 8, 1850 (2017). - PMC - PubMed
    1. Hale M et al. Engineering HIV-Resistant, Anti-HIV Chimeric Antigen Receptor T Cells. Mol. Ther. 25, 570–579 (2017). - PMC - PubMed

Publication types

Substances