. 2019 Oct;3(10):1116-1123.
doi: 10.1038/s41562-019-0628-0. Epub 2019 Jun 17.

Altered learning under uncertainty in unmedicated mood and anxiety disorders

Affiliations

Altered learning under uncertainty in unmedicated mood and anxiety disorders

Jessica Aylward et al. Nat Hum Behav. 2019 Oct.

Abstract

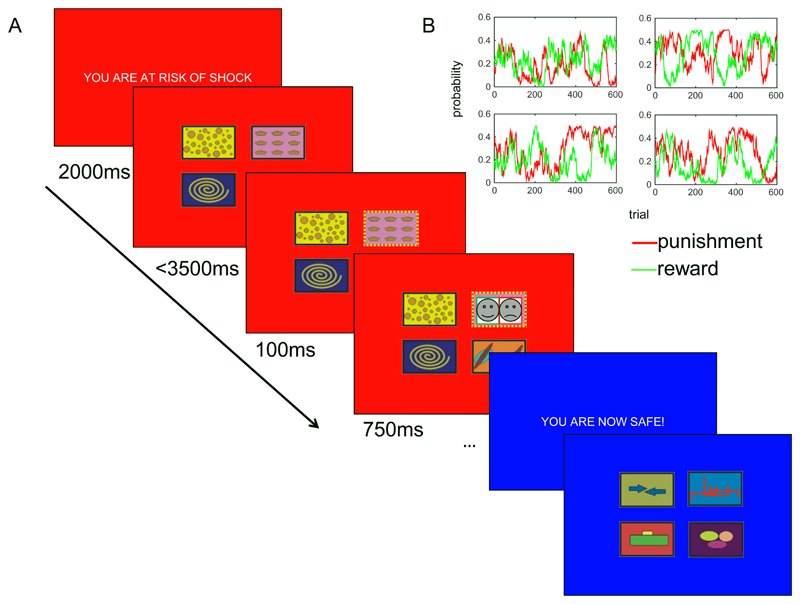
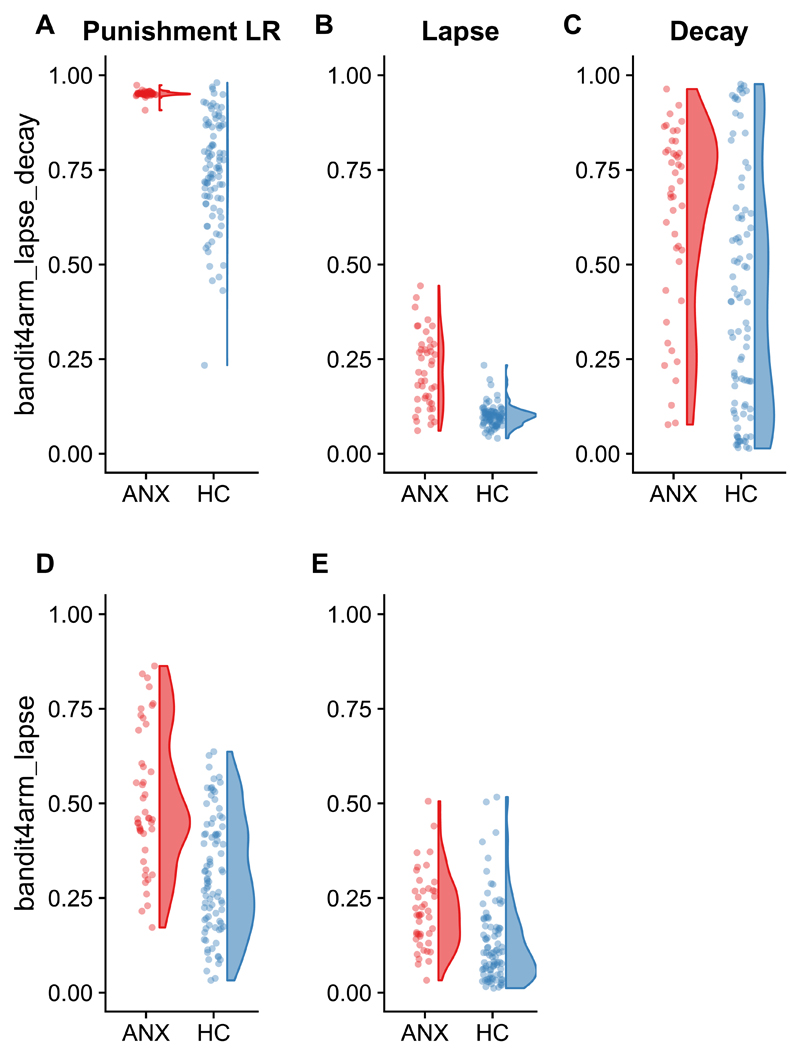
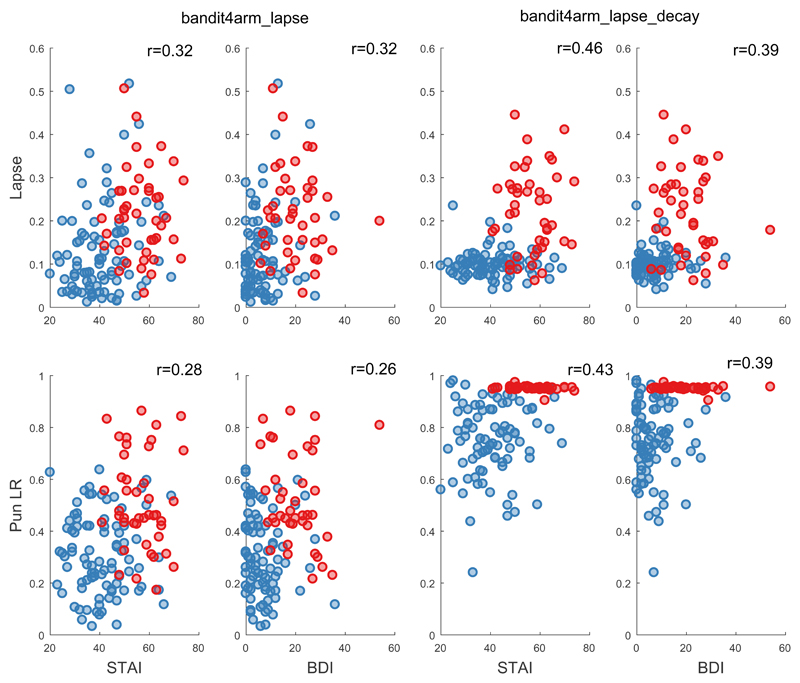
Anxiety is characterized by altered responses under uncertain conditions, but the precise mechanism by which uncertainty changes the behaviour of anxious individuals is unclear. Here we probe the computational basis of learning under uncertainty in healthy individuals and individuals suffering from a mix of mood and anxiety disorders. Participants were asked to choose between four competing slot machines with fluctuating reward and punishment outcomes during safety and stress. We predicted that anxious individuals under stress would learn faster about punishments and exhibit choices that were more affected by those punishments, thus formalizing our predictions as parameters in reinforcement learning accounts of behaviour. Overall, the data suggest that anxious individuals are quicker to update their behaviour in response to negative outcomes (increased punishment learning rates). When treating anxiety, it may therefore be more fruitful to encourage anxious individuals to integrate information over longer horizons when bad things happen, rather than try to blunt their responses to negative outcomes.


Conflict of interest statement

Competing interests

The authors declare no competing interests

Figures

Figure 1
Figure 1. Task schematic
A) Participants were asked to select one of four bandits on each trial. Following selection (here illustrated as top right under the threat condition, indicated in red), the bandit border changed colour (to blue, indicating safety), followed by the outcome (here illustrated as a combined reward and punishment; note that these were black and white photos of real human happy/fearful faces in the original experiment) overlaid on the selected bandit. The task proceeded in the same manner under the safe condition, but with a different set of bandits. B) Example of the independent fluctuation of reward and punishment probabilities across four bandits. At the start of a new condition, the bandits started with the probabilities they finished with at the end of the previous condition. I.e. the bandits at the end of one safe block paused during the subsequent threat block.
Figure 2
Figure 2. Group difference in parameters.
Higher point estimates of A) punishment learning rates (LR), B) lapse rates and C) decay rates in the symptomatic group (ANX; N=44) relative to the healthy controls (HC; N=88) in the bandit4arm_lapse_decay model The same pattern is seen in D) punishment learning rates and E) lapse rates in the bandit4arm_lapse model (which does not include a decay parameter). The final estimated posterior mean of each parameter for each individual is plotted in each panel.
Figure 3
Figure 3. Sensitivity plots.
Simulated data for each individual (N=132) shows close correspondence with real data on a simple metric ‘p(switch)’ – i.e. the proportion of trials in which the individual (or simulated agent) selected a different bandit from the previous trial. Healthy controls (N=88) plotted in blue, symptomatic in red (N=44); dashed line represents the identity. This is true for the A) bandit4arm_lapse_decay and B) bandit4arm_lapse models.
Figure 4
Figure 4. Continuous Symptom Analysis.
Individual parameter posteriors (Lapse on top row, Punishment learning rate on bottom row) for both models (bandit4arm_lapse left two columns, bandit4arm _lapse_decay right two columns) plotted against anxiety symptoms (STAI) in left column and depression symptoms (BDI) in the right column. Healthy controls (N=88) plotted in blue, symptomatic (N=44) in red. Note that the Punishment learning rate parameter is at the boundary for the symptomatic group in the decay model. The r value is the correlation co-efficient between the symptom and the parameter for the entire sample. Note that the lowest score on the STAI is 20 (score 1 for ‘almost never’ on all 20 questions).

Comment in

Similar articles

Cited by

References

    1. (IHME), I. f. H. M. a. E. GBDCompareDataVisualization. [Accessed 17/11/16].
    1. LeDoux JE, Pine DS. Using neuroscience to help understand fear and anxiety: a two-system framework. American journal of psychiatry. 2016;173:1083–1093. - PubMed
    1. Grupe DW, Nitschke JB. Uncertainty and anticipation in anxiety: an integrated neurobiological and psychological perspective. Nat Rev Neurosci. 2013;14:488–501. - PMC - PubMed
    1. Birrell J, Meares K, Wilkinson A, Freeston M. Toward a definition of intolerance of uncertainty: A review of factor analytical studies of the Intolerance of Uncertainty Scale. Clinical psychology review. 2011;31:1198–1208. - PubMed
    1. Charpentier CJ, Aylward J, Roiser JP, Robinson OJ. Enhanced risk aversion, but not loss aversion, in unmedicated pathological anxiety. Biological Psychiatry. 2017;81:1014–1022. doi: 10.1016/j.biopsych.2016.12.010. - DOI - PMC - PubMed

Publication types

MeSH terms