. 2019 Jul;22(7):1075-1088.
doi: 10.1038/s41593-019-0419-y. Epub 2019 Jun 17.

Sensory lesioning induces microglial synapse elimination via ADAM10 and fractalkine signaling

Affiliations

Sensory lesioning induces microglial synapse elimination via ADAM10 and fractalkine signaling

Georgia Gunner et al. Nat Neurosci. 2019 Jul.

Abstract

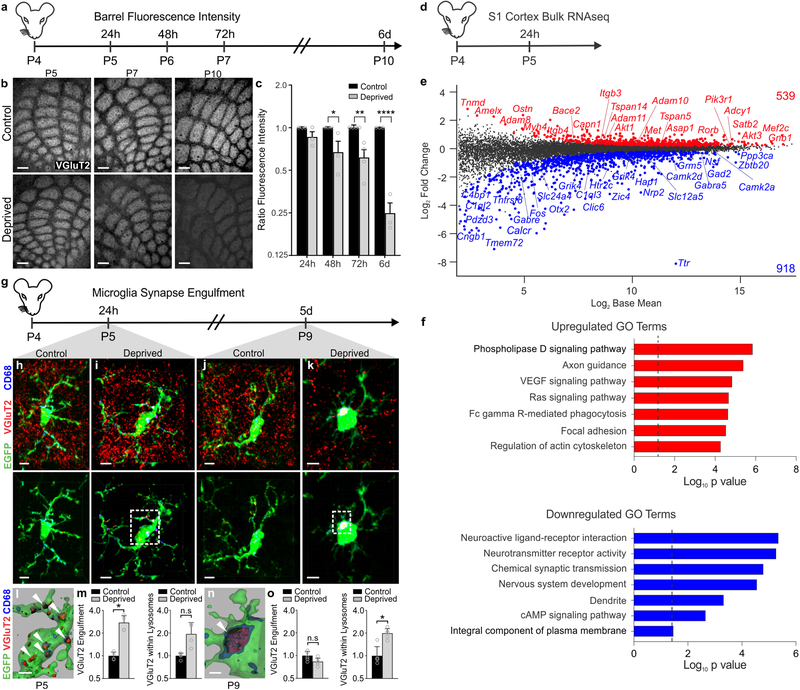
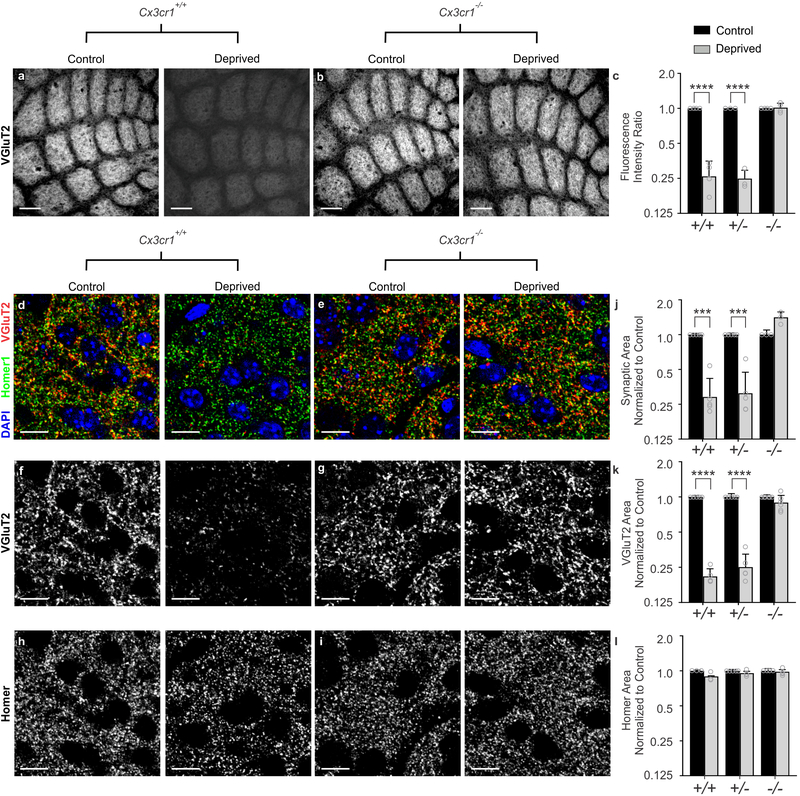
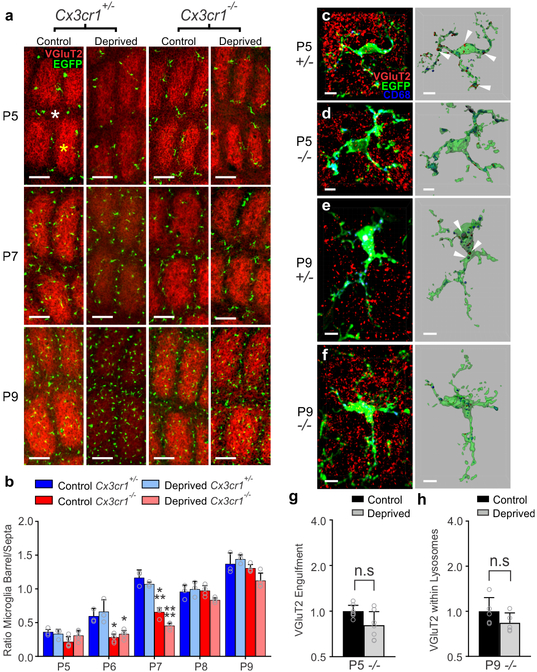
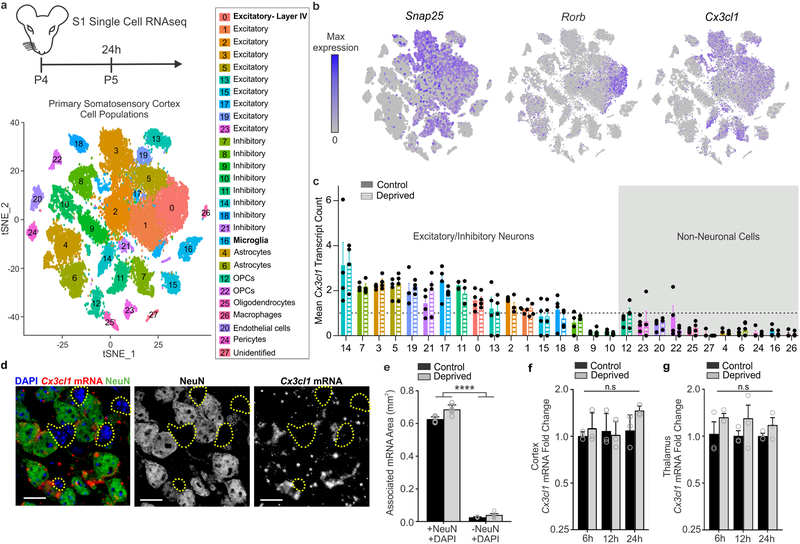
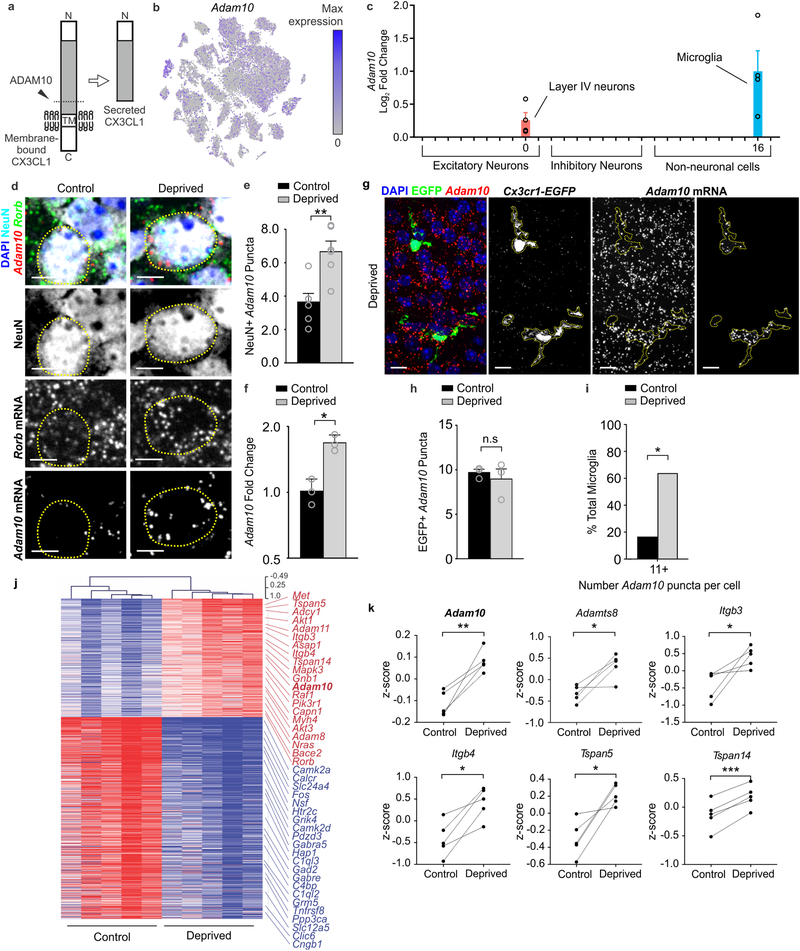
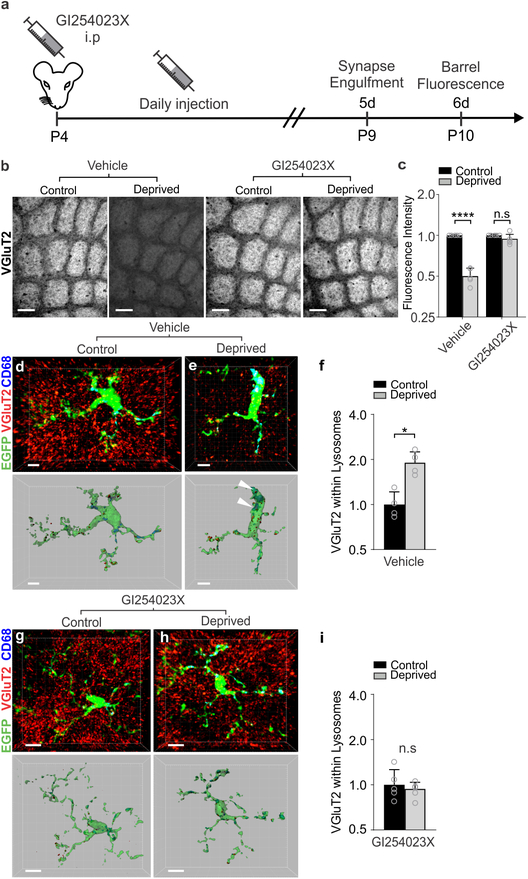
Microglia rapidly respond to changes in neural activity and inflammation to regulate synaptic connectivity. The extracellular signals, particularly neuron-derived molecules, that drive these microglial functions at synapses remain a key open question. Here we show that whisker lesioning, known to dampen cortical activity, induces microglia-mediated synapse elimination. This synapse elimination is dependent on signaling by CX3CR1, the receptor for microglial fractalkine (also known as CXCL1), but not complement receptor 3. Furthermore, mice deficient in CX3CL1 have profound defects in synapse elimination. Single-cell RNA sequencing revealed that Cx3cl1 is derived from cortical neurons, and ADAM10, a metalloprotease that cleaves CX3CL1 into a secreted form, is upregulated specifically in layer IV neurons and in microglia following whisker lesioning. Finally, inhibition of ADAM10 phenocopies Cx3cr1-/- and Cx3cl1-/- synapse elimination defects. Together, these results identify neuron-to-microglia signaling necessary for cortical synaptic remodeling and reveal that context-dependent immune mechanisms are utilized to remodel synapses in the mammalian brain.


Conflict of interest statement

Declaration of Interests

Authors declare no conflict of interest.

Figures

Figure 1.
Figure 1.. Whisker lesioning induces microglial engulfment and elimination of TC inputs within the barrel cortex.
a, Timeline for analysis of TC input elimination following whisker lesioning at P4. b, Tangential sections of layer IV contralateral control (top panel) and deprived (bottom panel) barrel cortices immunolabeled for anti-VGluT2 show a decrease in TC inputs by P10. Scale bar, 150 μm. c, Quantification of fluorescence intensity of VGluT2-positive TC inputs in the barrel cortex in the deprived (gray bars) compared to the control barrel cortex (black bars) at each time point post-whisker removal. Data normalized to the control, non-deprived hemisphere within each animal. (Two-way ANOVA with Sidak’s post hoc; control vs deprived 24h, n = 3 animals, P = 0.5323, t = 1.419, df = 18; control vs deprived 48h, n = 3 animals, P = 0.0142, t = 3.349, df = 18; control vs deprived 72h, n = 4 animals, P = 0.0011, t = 4.516, df = 18; control vs deprived 6d, n = 3 animals, P <0.0001, t = 7.631, df = 18). d, Timeline for bulk RNAseq of the barrel cortex 24 hours after whisker lesioning. e-f, MA plot (representing log-ratio (M) on the y axis and mean average (A) on the x axis) shows gene expression changes (red, upregulated; blue, downregulated) in the deprived somatosensory cortex at P4 (DESeq2, n = 5 mice, P5). Horizontal bar graphs show selected gene ontology (GO) annotations (Enrichr) enriched for up- (red) or downregulated (blue) genes; dotted lines, P = 0.05. g, Timeline for analysis of TC input engulfment by microglia. h,i,j,k, Fluorescent images of microglia (green) within layer IV of the control (h,j) and deprived (i,k) barrel cortices 24 h (h,i) and 5 d (j,k) after unilateral whisker removal. Microglial lysosomes are labeled with anti-CD68 (blue). Raw fluorescent images, top panel; VGlut2 signal internalized within microglia, bottom panel. Scale bar, 5 μm. l,n, 3D surface-rendered inset of i,k (bottom panel). Arrows depict VGlut2 (red) internalized within microglia (green) and within lysosomes (blue). Scale bar, 2 μm. m,o, Quantification of VGlut2 engulfment within microglia (left) and VGlut2 engulfment within lysosomes (right) 24 h (m; within microglia, Two-sided Student’s t-test, n = 4 animals, P = 0.0305, t = 2.642 df =6; within lysosomes, Two-sided Student’s t-test, n = 4 animals, P = 0.2955, t = 1.146, df =6) and 5 d (o; within microglia, Two-sided Student’s t-test, n = 5 animals, P = 0.3319, t =1.033, df =8; within lysosomes, Two-sided Student’s t-test, n = 5 animals, P = 0.0272, t =2.251, df =8) after whisker removal in Cx3cr1EGFP/+ microglia reveals increased VGluT2 within microglia at 24 h (m) and increased VGluT2 within microglial lysosomes at 5 d-post whisker removal (o). Data normalized to engulfment in microglia in the control hemisphere within each animal. All data presented as mean ± SEM.
Figure 2.
Figure 2.. Cx3cr1 expression is necessary for TC input elimination after whisker lesioning.
a-b, VGluT2 immunolabeled TC inputs within tangential sections of control and deprived barrel cortices in Cx3cr1+/+ (a) and Cx3cr1−/− mice (b) show TC inputs remain 6 d-post deprivation in mice lacking Cx3cr1. Scale bar, 150 μm. c, Quantification of fluorescence intensity of VGluT2-positive TC input immunoreactivity 6 d after deprivation in Cx3cr1+/+, Cx3cr1+/− and Cx3cr1−/− littermates demonstrates a significant decrease in VGluT2 immunoreactivity in Cx3cr1+/+, Cx3cr1+/− mice following deprivation but this is blocked in Cx3cr1−/− littermates. (Data normalized to the control, non-deprived hemisphere within each animal; Two-Way ANOVA with Sidak’s post hoc; control vs deprived Cx3cr1+/+ n = 4 animals, P < 0.0001, t = 8.967, df =16; control vs deprived Cx3cr1+/− n = 3 animals, P < 0.0001, t = 7.882, df = 16; control vs deprived Cx3cr1−/− n = 4 animals, P = 0.9976, t = 0.1722, df = 16). d-i, High magnification (63X) confocal images of TC synapses within layer IV of the control and deprived barrel cortices immunolabeled with presynaptic anti-VGluT2 (red) and postsynaptic anti-Homer (green) 6 d-post deprivation in Cx3cr1+/+ (d,f,h) and Cx3cr1−/− (e,g,i) mice. Merged channels are shown in panels d-e. The presynaptic VGluT2 channel alone is shown in panels f-g. The postsynaptic Homer channel alone is shown in panels h-i. Scale bars, 10 μm. j-l, Quantification of d-i reveals a significant decrease in structural synapses (j; colocalized VGluT2 and Homer, Two-Way ANOVA with Sidak’s post hoc, control vs deprived Cx3cr1+/+ n = 5 animals, P = 0.0004, t = 4.765, df =20; control vs deprived Cx3cr1+/− n = 5 animals, P = 0.0005, t = 4.617, df = 20; control vs deprived Cx3cr1−/− n = 3 animals, P = 0.1290, t = 2.139, df = 20) and VGluT2-positive TC presynaptic terminal density (k; VGlut2 Area, Two-Way ANOVA with Sidak’s post hoc, control vs deprived Cx3cr1+/+ n = 5 animals, P < 0.0001, t = 6.919, df =26; control vs deprived Cx3cr1+/− n = 5 animals, P <0.0001, t = 6.552, df = 26; control vs deprived Cx3cr1−/− n = 6 animals, P = 0.6907, t = 1.006, df = 26) in Cx3cr1+/+ and Cx3cr1+/− mice, which was blocked in Cx3cr1−/− littermates. There was no significant change in postsynaptic Homer density (l; Homer Area, Two-way ANOVA with Sidak’s post hoc, control vs deprived Cx3cr1+/+ n = 3 animals, P = 0.2386, t = 1.811, df =18; control vs deprived Cx3cr1+/− n = 5 animals, P =0.7852, t = 0.9918, df = 18; control vs deprived Cx3cr1−/− n = 4 animals, P = 0.9731, t = 0.3908, df = 18) in any genotype. Data normalized to the control, non-deprived cortex within each animal. All data presented as mean ± SEM.
Figure 3.
Figure 3.. Microglial Cx3cr1 deficiency blocks structural and functional synaptic remodeling long-term.
a,b, VGluT2 immunolabeling of TC inputs in tangential sections of the control and deprived barrel cortex in P90 Cx3cr1+/+ (a) and Cx3cr1−/− (b) littermates. TC inputs remain in Cx3cr1−/− mice after sustained whisker removal (b, right panel). Scale bar, 150 μm. Representative images taken from 2 independent experiments/animals. c, Representative sEPSC traces from layer IV stellate neurons for the control and deprived barrel cortices of P42-P56 Cx3cr1+/+ and Cx3cr1−/− mice. d,e, Quantification of stellate neuron sEPSC frequency and amplitude in Cx3cr1+/+ (d; sEPSC Frequency: n = 17 control and 16 deprived cells from 3 Cx3cr1+/+ littermates, Two-tailed Student’s t-test, P = 0.0484, t =2.054, df =31; sEPSC Amplitude, Two-tailed Student’s t-test, P = 0.0105, t =2.723, df =31) and Cx3cr1−/− (e; sEPSC Frequency: n = 10 control and 13 deprived cells from 3 Cx3cr1−/− littermates, Two-tailed Student’s t-test, P = 0.1286, t =1.582, df =21; sEPSC Amplitude, Two-tailed Student’s t-test, P = 0.9432, t =0.07205, df =21) mice in the deprived (grey bars) compared to the contralateral control (black bars) barrel cortex. Cx3cr1−/− mice show no significant decrease in stellate neuron sEPSC frequency or amplitude. All data presented as mean ± SEM.
Figure 4.
Figure 4.. Microglial engulfment of TC inputs following whisker lesioning is CX3CR1-dependent.
a, Representative images of microglia within the barrel cortex labeled by transgenic expression of EGFP under the control of CX3CR1 (green) and TC inputs labeled with anti-Vglut2 (red). b, Quantification of the ratio of microglia localized to the septa (denoted with white asterisk at P5) compared to the barrels (denoted with a yellow asterisk at Pt) +/− whisker deprivation. In both deprived and non-deprived barrel cortices, microglia begin to infiltrate the barrel centers from the septa by P6/7 in Cx3cr1+/− mice, which is delayed to P8 in Cx3cr1−/− mice. There is no significant difference by P8. (Two-way ANOVA and Tukeys post hoc test, control Cx3cr1+/− vs control Cx3cr1−/− at P6, n = 3 Cx3cr1+/− and 5 Cx3cr1−/− littermates, P = 0.0394, q = 3.887, df = 54; deprived Cx3cr1+/− vs deprived Cx3cr1−/− at P6, n = 3 Cx3cr1+/− and 5 Cx3cr1−/− littermates, P = 0.0273, q = 4.092, df = 54; Cx3cr1+/− vs control Cx3cr1−/− at P7, n = 3 Cx3cr1+/− and 4 Cx3cr1−/− littermates, P = 0.0005, q = 5.996, df = 54; deprived Cx3cr1+/− vs deprived Cx3cr1−/− at P7, n = 3 Cx3cr1+/− and 4 Cx3cr1−/− littermates, P <0.0001, q = 7.32, df = 54) c-f, Representative microglia from the deprived barrel cortex of Cx3cr1+/− and Cx3cr1−/− mice 24 hours and 5 d after whisker lesioning. Left panel shows raw fluorescent image with microglia (EGFP, green), VGluT2 (red), and lysosomes (CD-68, blue). Right panel shows 3D-rendered microglia within layer IV of the deprived barrel cortex 24 h (c,d) and 5 d (e,f) post deprivation. Arrows denote examples of engulfed TC inputs in Cx3cr1+/− barrel cortex (c,e) which are largely absent in Cx3cr1−/− mice (d,f). Scale bar, 5 μm. g,h, Quantification of engulfment in Cx3cr1−/− mice 24 h (g; Two-tailed Student’s t-test, n = 8 littermate animals, P = 0.3668, t = 0.938, df =12) and 5 d (h; Two-tailed Student’s t-test, n = 5 littermate animals, P = 0.5619, t =0.6051, df =8) post deprivation reveals no significant increase in engulfed TC inputs in the control vs deprived barrel cortex at any time point. Engulfment data normalized to the control, non-deprived hemisphere within each animal. All data presented as mean ± SEM.
Figure 5.
Figure 5.. CX3CL1 is necessary for TC input engulfment and elimination after sensory lesioning.
a-b, VGluT2 immunolabeled TC inputs within tangential sections of control and deprived barrel cortices in Cx3cl1+/+ (a) and Cx3cl1−/− mice (b). Scale bar, 150 μm c, Quantification of fluorescence intensity of VGluT2-positive TC input 6 d after deprivation shows a significant decrease in VGluT2 fluorescence intensity in Cx3cl1+/+ mice 6 d post-deprivation, which is blocked in Cx3cl1−/− littermates. Data normalized to the control, non-deprived hemisphere within each animal. (Two-Way ANOVA with Sidak’s post hoc, n = 4 animals per genotype, P <0.0001, t = 28.3, df = 12). d-f, Quantification of high magnification images of synaptic components in the barrel centers 6 d after whisker removal reveals a significant decrease in structural synapses (d, VGluT2 colocalized with Homer; Two-Way ANOVA with Sidak’s post hoc, n = 4 animals per genotype, Cx3cl1+/+ control vs deprived, P <0.0001, t =11.66, df = 12) and VGluT2-positive presynaptic terminals (e; Two-Way ANOVA with Sidak’s post hoc, n = 4 animals per genotype, Cx3cl1+/+ control vs deprived, P <0.0001, t = 7.418, df = 12) in Cx3cl1+/+ mice but no significant change in Cx3cl1−/− littermates (Colocalized Area, P = 0.0642, t = 2.415, df = 12; VGlut2 Area, P = 0.1071, t =2.125, df = 12). There was no significant change in density of homer immunoreactivity in Cx3cl1+/+ or Cx3cl1−/− mice following whisker deprivation (f; Two-Way ANOVA with Sidak’s post hoc, n = 4 animals per genotype, no significance). Data normalized to the control, non-deprived hemisphere within each animal. g-h, Representative microglia from the deprived barrel cortex of Cx3cl1+/+ (g) and Cx3cl1−/− (h) mice. Left panel displays raw fluorescent image with microglia (Anti-Iba1, green) VGluT2 inputs (red) and lysosomes (Anti-CD68, blue) labeled. Right panels shows 3D-surface rendering of these cells. Engulfed VGluT2 (red) immunoreactive TC inputs within microglia are visualized in Cx3cl1+/+ microglia (g, arrows)) but not Cx3cl1−/− microglia (h). Scale bars, 5 μm. i, Quantification of VGlut2 engulfment 24 h after whisker removal reveals that Cx3cl1−/− microglia fail to engulf TC inputs following sensory deprivation. Data normalized to engulfment in the control hemisphere within each animal. (Two-Way ANOVA with Sidak’s post hoc, n = 4 littermates per genotype, Cx3cl1+/+ control vs deprived P = 0.0111, t = 3.369, df = 12; Cx3cl1−/− control vs deprived P = 0.5963, t = 0.9422, df = 12). All data presented as mean ± SEM.
Figure 6.
Figure 6.. Single-cell RNAseq reveals that Cx3cl1 is highly enriched in neurons in the barrel cortex but its transcription is not modulated by whisker lesioning.
a, Timeline for whisker removal and single cell sequencing analysis. P4 mice (n = 4 Cx3cr1+/−, n = 4 Cx3cr1−/−) underwent unilateral whisker lesioning and were sacrificed 24 h later. Barrel cortices were prepared for single-cell RNAseq. A tSNE plot of 27 distinct cell populations in the barrel cortex clustered by principal component analysis. (See Supplementary Fig 7). b, tSNE plots for Snap25 and Cx3cl1 across all 27 clusters. Cx3cl1 is enriched in most SNAP-25-poistive neuronal clusters. c, Mean Cx3cl1 RNA transcript counts per condition (control, solid bars; deprived, striped bars) in Cx3cr1+/− animals. Each data point is the mean expression across cells within each individual Cx3cr1+/− hemisphere (control or deprived). Data at or below the dotted line indicates 1 transcript or no expression. Cx3cl1 is enriched in neurons but its expression is unchanged following whisker lesioning across all cell types. d, In situ hybridization for Cx3cl1 (red) and immunohistochemistry for NeuN to label neurons (green) in Cx3cl1+/+ deprived barrel cortices validates that Cx3cl1 is enriched in NeuN-positive neurons compared to non-neuronal cells (NeuN negative, yellow dotted lines). Scale bar, 15 μm. e, Quantification of in situ for Cx3cl1 reveals enrichment in neuronal (+NeuN/+DAPI) vs. non-neuronal (-NeuN/+DAPI) cells and no change in expression 24 h-post whisker lesioning. (Two-Way ANOVA with Sidak’s post hoc test, Control +NeuN/+DAPI vs Control -NeuN/+DAPI, P <0.0001, t = 25.78, df = 20; Deprived +NeuN/+DAPI vs Deprived -NeuN/+DAPI, P <0.0001, t = 27.7, df = 27; Control +NeuN/+DAPI vs Deprived -NeuN/+DAPI, P <0.0001, t = 25.19, df = 20; Deprived +NeuN/+DAPI vs Control -NeuN/+DAPI, P <0.0001, t = 28.29, df = 20; n = 6 images from 3 animals (3 males)). All data presented as mean ± SEM. f-g, qPCR for Cx3cl1 expression in the barrel cortex (f) and VPM nucleus of the thalamus (g) 6, 12, 24, and 72 h after whisker lesioning in Cx3cr1+/+ mice in the control (black bars) and deprived (grey bars) barrel cortices. (Two-Way ANOVA with Sidak’s post hoc, n = 3 animals per time point, 6h barrel cortex control vs deprived; P = 0.9958, t = 0.3299, df = 16; 12hr barrel cortex control vs deprived; P = 0.9996, , t = 0.1766, df = 16; 24h barrel cortex control vs deprived; P = 0.7804, t = 1.036, df = 16; 72h barrel cortex control vs deprived; P = 0.9722, t = 0.5476, df = 16; 6h thalamus control vs deprived; P = 0.5295, t = 1.287, df = 12; 12hr thalamus control vs deprived; P = 0.5041, , t = 1.329, df = 12; 24h thalamus control vs deprived; P = 0.8261, t = 0.7954, df = 12). All data presented as mean ± SEM.
Figure 7.
Figure 7.. Adam10, a metalloprotease that cleaves CX3CL1, is increased in neurons within the barrel cortex following whisker lesioning.
a, Adam10 cleaves Cx3CL1 at the membrane (dotted line) to produce a secreted form. b, tSNE plot for Adam10 reveals broad expression across many neuronal and non-neuronal cell types. (Single cell RNAseq performed on n = 4 Cx3cr1+/− and n = 4 Cx3cr1−/− at P5, 24h after whisker lesioning). c, Fold change of Adam10 expression by single-cell RNAseq reveals significant (FDR <0.10, Monocle2) upregulation specifically in layer IV Rorb+ neurons and microglia after whisker lesioning. Each data point is the mean fold change for Adam10 within each individual Cx3cr1+/− deprived hemisphere. Data presented as mean ± SEM. d, In situ hybridization for Adam10 in the control (top panels) and deprived (bottom panels) barrel cortices. Adam10 is increased in the majority of Rorb+ layer IV excitatory neurons (NeuN+, Rorb+) assessed 24 h-post whisker lesioning compared to neurons in the control barrel cortex. Scale bar, 5 μm.e, Quantification of in situ for Adam10 puncta co-localized with layer IV neurons. (Two-tailed Student’s t-test, n = 6 Cx3cr1+/+ animals, P = 0.003, t = 0.3889, df =10). Data presented as mean ± SEM. f, qPCR for Adam10 24 h-post whisker lesioning in the control (black bars) and deprived (grey bars) whole barrel cortices reveals a significant increase in Adam 10 24 h-post whisker lesioning. (Two-tailed Student’s t-test, n = 3 Cx3cr1+/+animals, P = 0.0241, t = 3.538, df =4). Data presented as mean ± SEM. g, In situ hybridization for Adam10 within Cx3cr1EGFP/+ microglia (yellow dotted lines) in the deprived cortex 24 h-post whisker lesioning reveals increased Adam10 expression in a subset of microglia after lesioning. Representative images taken Cx3cr1+/+ animals across 1 independent experiment. h, Quantification of the average Adam10 in situ puncta per microglia averaged across all microglial cells assessed in the barrel cortex shows no significant difference in expression between the control and deprived conditions. (Two-tailed Student’s t-test, n = 3 Cx3cr1+/− animals, P = 0.5547, t = 0.6439, df =4). Data presented as mean ± SEM. i, Further quantification of Adam10 mRNA puncta within microglia reveals a significant increase in a subset of microglia expressing high levels (≥11 puncta) of Adam10 in the deprived vs. control barrel cortex (n = 36 deprived microglia, 36 control microglia from 3 Cx3cr1+/+ animals). One-tailed Chi-square test, P = 0.0306, χ2 = 3.503, df = 1, z = 1.872). Data represented as whole number percentage of the total cell population. j, Heatmap with hierarchical clustering distances shows the variation in the expression levels (z-scored log2(RPKM)) of 539 up- and 918 downregulated genes upon whisker deprivation at P4 identified by bulk RNAseq from the primary barrel cortex of whisker lesioned mice (DESeq2 software, n = 5 mice, P5, related to Figure1e). Adam10 is bolded. k, Line graphs show for individual mice z-scored log2(RPKM) changes of Adam10 and other selected genes encoding known regulators of Adam10 expression or activity. (Two-tailed Student’s t-test: Adam10, P = 0.0060, t = 5.32; Adamts8, P = 0.0205, t =3.72; Itgb3, P = 0.0454, t = 2.87; Itgb4, P = 0.0106, t = 4.53; Tspan5, P = 0.0151, t = 4.08; Tspan14, P = 0.0006, t = 9.80; n = 5 animals).
Figure 8.
Figure 8.. Pharmacological inactivation of ADAM10 phenocopies TC synapse elimination defects in Cx3cr1−/− and Cx3cl1−/− mice.
a, Timeline for pharmacological inhibition of ADAM10 via daily 25 mg/kg GI254023X injections intraperitoneally. b, Inhibition of ADAM10 (right panels), but not vehicle treatment (left panels), blocks TC input loss as visualized by immunostaining for VGluT2. Scale bars, 150 μm. c, Quantification of VGluT2 immunostaining intensity 5 days-post whisker lesioning and GI254023X injections (Two-Way ANOVA with Sidak’s post hoc, n = 5 Cx3cr1+/+ animals per condition, Vehicle control vs deprived, P <0.0001, t = 6.782, df = 16; GI254023X control vs deprived, P = 0.9715, t = 0.7789, df = 16). d,e, Representative microglia from the control (d) and deprived (e) cortices of vehicle treated Cx3cr1EGFP/+ mice. Top panel displays raw fluorescent image with microglia (EGFP, green) VGluT2 inputs (red) and lysosomes (Anti-CD68, blue) labeled. Bottom panels shows 3D-surface rendering of these cells. Engulfed VGluT2 (red) immunoreactive TC inputs within microglia are visualized in Cx3cr1EGFP/+ microglia (e, arrows)) in the deprived cortex but not the control cortex (d). Scale bars, 5 μm. f, Quantification of engulfed VGlut2 5 days after whisker lesioning reveals increased engulfment in the deprived cortex of vehicle treated mice. Data normalized to engulfment in the control hemisphere within each animal. (One-tailed Student’s T-test, n = 4 Cx3cr1EGFP/+ mice, control vs deprived P = 0.0455, t = 2.012, df = 6.) g,h Representative microglia from the control (d) and deprived (e) cortex of GI254023X treated Cx3cr1EGFP/+ mice 5 days after whisker lesioning. Scale bars, 5 μm. i, Quantification of engulfment 5 days-post whisker lesioning in GI254023X treated mice reveals a blockade of engulfment following ADAM10 inhibition. Data normalized to engulfment in the control hemisphere within each animal. (Two-tailed Student’s T-test, n = 4 Cx3cr1EGFP/+ mice, control vs deprived P = 0.8291, t = 0.2231, df = 6). All data presented as mean ± SEM.

References

    1. Wu Y, Dissing-Olesen L, MacVicar BA & Stevens B Microglia: Dynamic Mediators of Synapse Development and Plasticity. Trends in immunology 36, 605–613 (2015). - PMC - PubMed
    1. Schafer DP, et al. Microglia sculpt postnatal neural circuits in an activity and complement-dependent manner. Neuron 74, 691–705 (2012). - PMC - PubMed
    1. Hong S, Dissing-Olesen L & Stevens B New insights on the role of microglia in synaptic pruning in health and disease. Current opinion in neurobiology 36, 128–134 (2016). - PMC - PubMed
    1. Stevens B, et al. The classical complement cascade mediates CNS synapse elimination. Cell 131, 1164–1178 (2007). - PubMed
    1. Vasek MJ, et al. A complement-microglial axis drives synapse loss during virus-induced memory impairment. Nature 534, 538–543 (2016). - PMC - PubMed

Publication types

MeSH terms