. 2019 Jul;22(7):1182-1195.
doi: 10.1038/s41593-019-0417-0. Epub 2019 Jun 17.

Classification of electrophysiological and morphological neuron types in the mouse visual cortex

Nathan W Gouwens  1 Staci A Sorensen  1 Jim Berg  1 Changkyu Lee  1 Tim Jarsky  1 Jonathan Ting  1 Susan M Sunkin  1 David Feng  1 Costas A Anastassiou  1 Eliza Barkan  1 Kris Bickley  1 Nicole Blesie  1 Thomas Braun  1 Krissy Brouner  1 Agata Budzillo  1 Shiella Caldejon  1 Tamara Casper  1 Dan Castelli  1 Peter Chong  1 Kirsten Crichton  1 Christine Cuhaciyan  1 Tanya L Daigle  1 Rachel Dalley  1 Nick Dee  1 Tsega Desta  1 Song-Lin Ding  1 Samuel Dingman  1 Alyse Doperalski  1 Nadezhda Dotson  1 Tom Egdorf  1 Michael Fisher  1 Rebecca A de Frates  1 Emma Garren  1 Marissa Garwood  1 Amanda Gary  1 Nathalie Gaudreault  1 Keith Godfrey  1 Melissa Gorham  1 Hong Gu  1 Caroline Habel  1 Kristen Hadley  1 James Harrington  1 Julie A Harris  1 Alex Henry  1 DiJon Hill  1 Sam Josephsen  1 Sara Kebede  1 Lisa Kim  1 Matthew Kroll  1 Brian Lee  1 Tracy Lemon  1 Katherine E Link  1 Xiaoxiao Liu  1 Brian Long  1 Rusty Mann  1 Medea McGraw  1 Stefan Mihalas  1 Alice Mukora  1 Gabe J Murphy  1 Lindsay Ng  1 Kiet Ngo  1 Thuc Nghi Nguyen  1 Philip R Nicovich  1 Aaron Oldre  1 Daniel Park  1 Sheana Parry  1 Jed Perkins  1 Lydia Potekhina  1 David Reid  1 Miranda Robertson  1 David Sandman  1 Martin Schroedter  1 Cliff Slaughterbeck  1 Gilberto Soler-Llavina  1 Josef Sulc  1 Aaron Szafer  1 Bosiljka Tasic  1 Naz Taskin  1 Corinne Teeter  1 Nivretta Thatra  1 Herman Tung  1 Wayne Wakeman  1 Grace Williams  1 Rob Young  1 Zhi Zhou  1 Colin Farrell  1 Hanchuan Peng  1 Michael J Hawrylycz  1 Ed Lein  1 Lydia Ng  1 Anton Arkhipov  1 Amy Bernard  1 John W Phillips  1 Hongkui Zeng  2 Christof Koch  1
Affiliations

Classification of electrophysiological and morphological neuron types in the mouse visual cortex

Nathan W Gouwens et al. Nat Neurosci. 2019 Jul.

Abstract

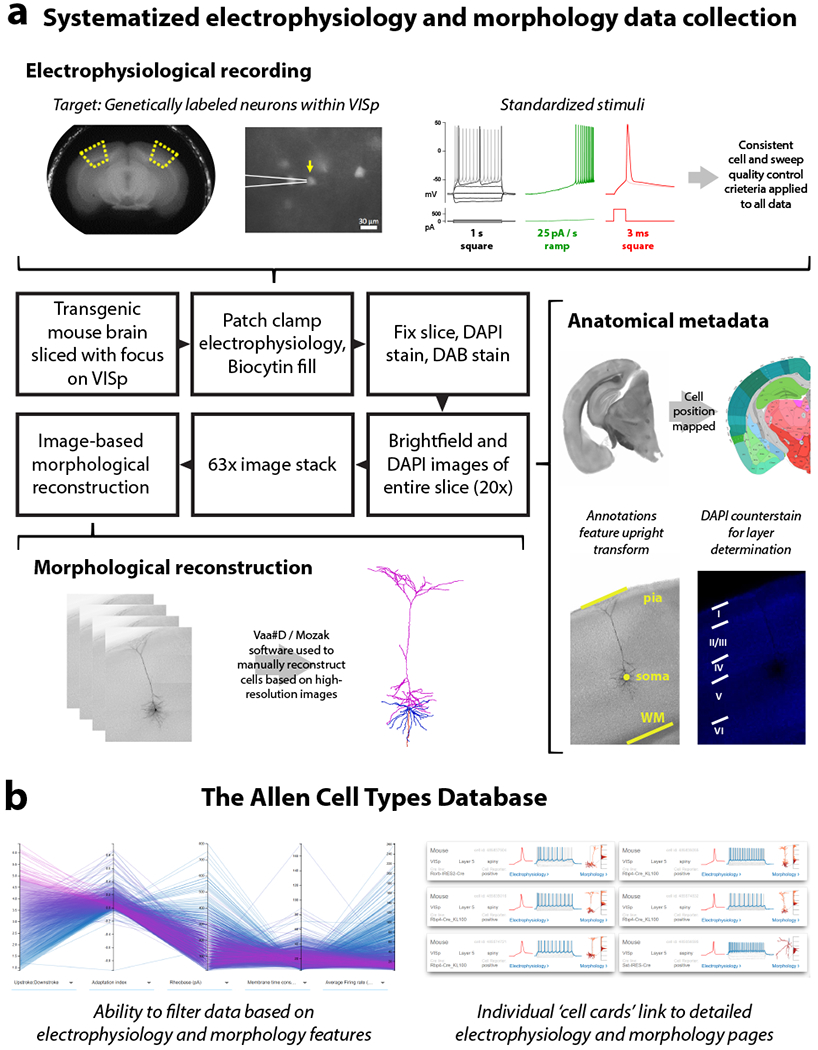
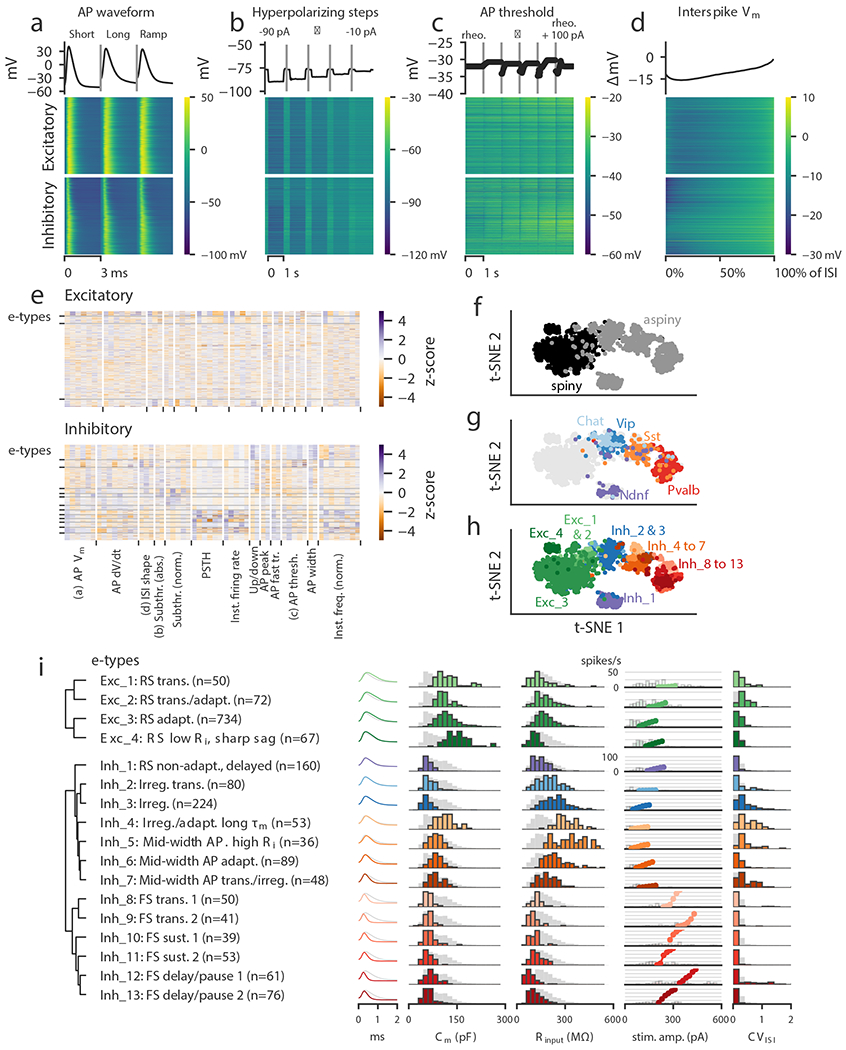
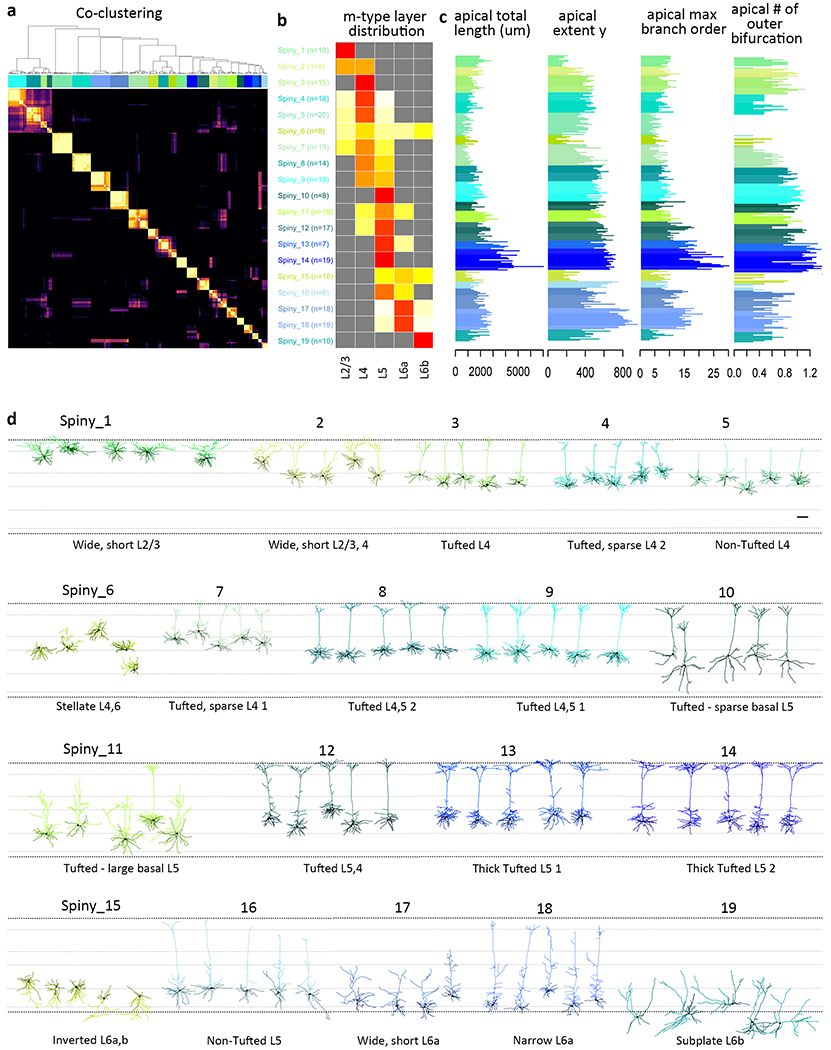
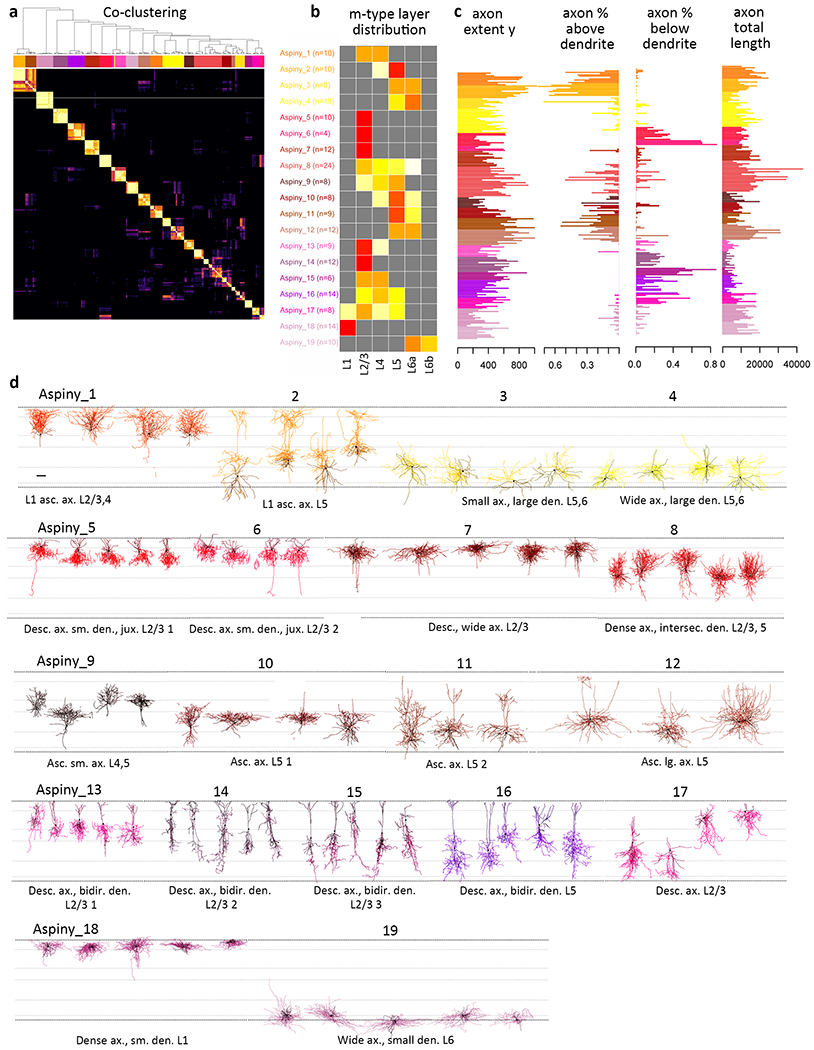
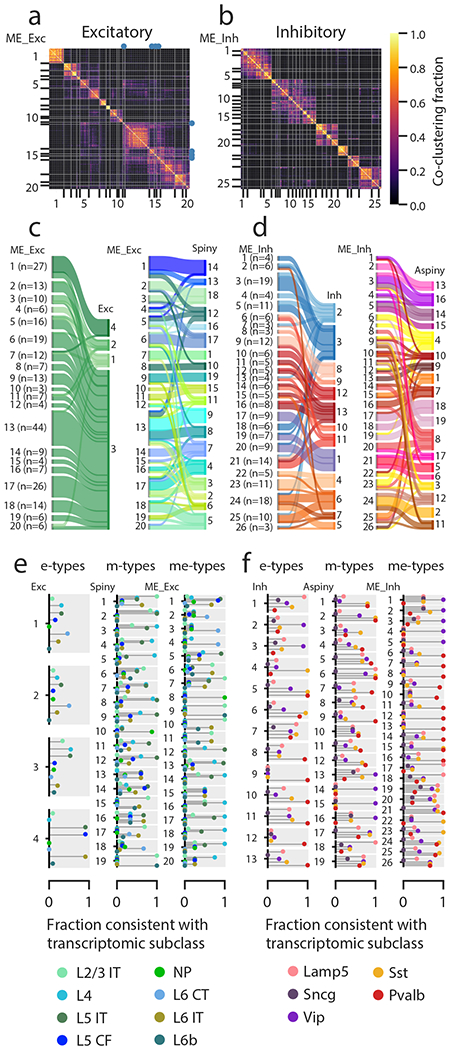
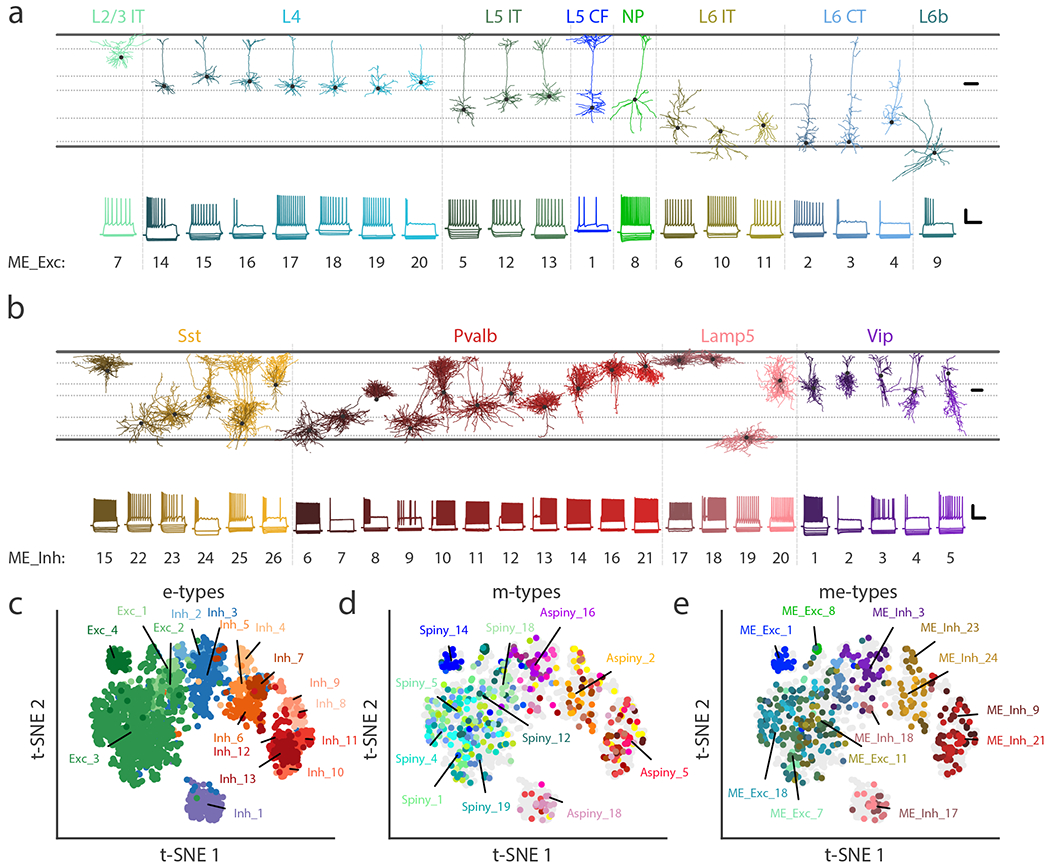
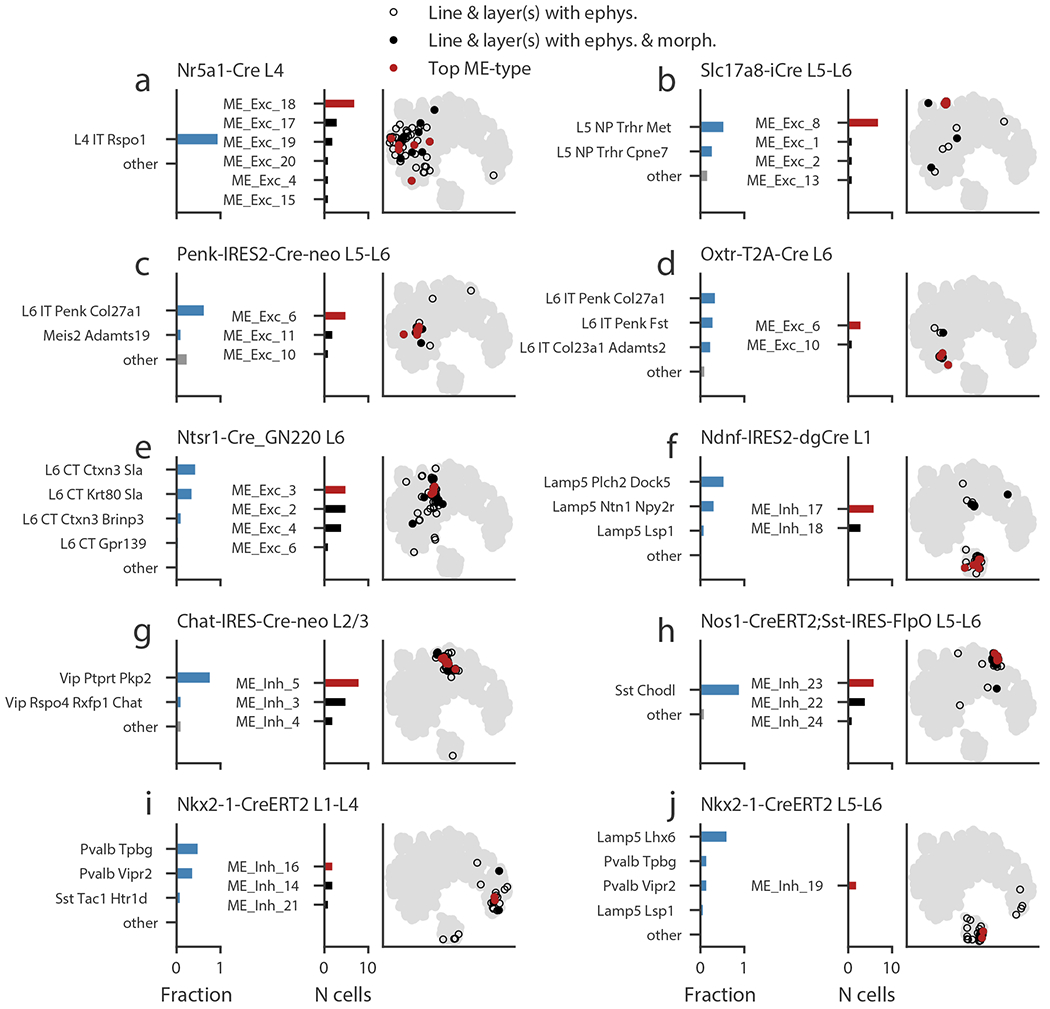
Understanding the diversity of cell types in the brain has been an enduring challenge and requires detailed characterization of individual neurons in multiple dimensions. To systematically profile morpho-electric properties of mammalian neurons, we established a single-cell characterization pipeline using standardized patch-clamp recordings in brain slices and biocytin-based neuronal reconstructions. We built a publicly accessible online database, the Allen Cell Types Database, to display these datasets. Intrinsic physiological properties were measured from 1,938 neurons from the adult laboratory mouse visual cortex, morphological properties were measured from 461 reconstructed neurons, and 452 neurons had both measurements available. Quantitative features were used to classify neurons into distinct types using unsupervised methods. We established a taxonomy of morphologically and electrophysiologically defined cell types for this region of the cortex, with 17 electrophysiological types, 38 morphological types and 46 morpho-electric types. There was good correspondence with previously defined transcriptomic cell types and subclasses using the same transgenic mouse lines.


Conflict of interest statement

COMPETING INTERESTS

The authors declare no competing interests.

Figures

Figure 1:
Figure 1:. A pipeline to generate and analyze standardized morpho-electric data at scale.
(a) An in vitro single cell characterization pipeline was established to generate standardized electrophysiological and morphological data from mouse cortical neurons. Mouse brains were imaged during vibratome sectioning to aid in cell localization to a common mouse reference atlas, Allen Mouse Common Coordinate Framework version 3 (CCF v3). Fluorescently labeled neurons from specific transgenic mouse lines were recorded by whole cell patch clamping to characterize each cell’s intrinsic electrical properties. Each cell was stimulated with a standard electrophysiological stimulation paradigm and underwent consistent cell and sweep quality control, allowing for routine feature extraction and alignment of data traces from diverse cell types. During the electrophysiology recording, cells were filled with biocytin, then tissue slices were fixed, stained and mounted, and imaged at 20× in a single plane. Cells were mapped to the reference atlas and layer determination was made using a DAPI counterstain. A subset of neurons were then selected to be imaged in a high-resolution 63× stack. High quality cells were then manually reconstructed based on the z-stack images by using the Vaa3D / Mozak software package. (b) Electrophysiology, imaging, and morphology data and metadata for each cell are made freely accessible through the Allen Cell Types Database. An interactive user interface allows users to filter thousands of cells by electrophysiology and morphology features, then each cell has a specific page with detailed electrophysiology and morphology data, when available.
Figure 2:
Figure 2:. Classification of electrophysiological properties.
(a) Action potential waveforms of n=1,938 cells evoked by a short (3 ms) current pulse, a long square (one second) current step, and a slow current ramp (25 pA/s). Example trace (top) and heat map of all responses (bottom). The cells in the heatmap are split into excitatory (spiny) cells above and inhibitory (aspiny/sparsely spiny) cells below (as determined from the images of each cell), and ordered within each of those groups by their average upstroke/downstroke ratio during long square current steps. The order of cells is the same in the heat maps of (a)–(d). In (a)–(c), vertical lines shown within examples separate data collected from different sweeps. (b) Membrane potential responses to hyperpolarizing current steps. (c) Action potential threshold voltages of spikes evoked by a series of depolarizing current steps. (d) Interspike interval membrane potential trajectories. For a given sweep, each interspike interval duration was normalized, resampled to have a consistent number of points, aligned on the action potential threshold (set to 0 mV), and averaged together. (e) Sparse principal component values collected from each data type, indicated by labels at the bottom. Each component’s values were transformed into a z-score. Rows are sorted into clusters indicated by left tick marks. (f) t-SNE plot using the components shown in (e) with aspiny/sparsely spiny (collectively referred to as “aspiny”) and spiny neurons identified (n=1,938 cells). The same t-SNE plot is shown in (f-h). (g) t-SNE plot with selected inhibitory-dominant transgenic lines identified. Only aspiny neurons from those lines are shown. (h) t-SNE plot with electrophysiology types (e-types) identified. (i) E-types and specific features. Dendrogram on left was created by hierarchical clustering based on distances between each cluster’s centroid. For AP shape, e-type averages are shown as colors and the grand average across all cells is shown in gray. For histograms, e-type values are shown in colors and full population is shown in gray. All histograms are scaled to their highest value. The f-I curves were aligned on the rheobase value and averaged. The average curve is plotted starting at the median rheobase. Distribution of rheobase values for cells in the clusters are shown as histograms behind the average curve.
Figure 3:
Figure 3:. Unsupervised classification of spiny neurons into morphological types.
(a) Co-clustering diagram from 1000 runs of hierarchical clustering with 90% subsampled data. 19 morphological types (m-types) are identified by CutreeHybrid()*, which included a step to merge neurons in clusters with an n≤3 with their most highly correlated cluster and clusters with no significantly different features between them. Each m-type is assigned a color that is maintained throughout the figure (n=253 spiny neurons). (b) Laminar distribution of m-types across layers 2/3-6b. Relative proportion of each m-type per layer is shown. (c) Examples of apical dendrite features that vary systematically across m-types. See Supplementary Fig. 19 for all morphological features included in the analysis. (d) Representative examples of each m-type, roughly ordered by their location in layers 2/3-6b. Neurons in each m-type are shown with respect to averaged cortical layers (see methods for details). Each m-type has two names, a numbered name (e.g., Spiny_1) and a descriptive name (e.g., Non-Tufted L4). Apical dendrites are shown in the lighter color and basal dendrites in the darker color. Morphology scale bar: 100 μm. See Supplementary Fig. 18 for individual morphologies that went into this clustering analysis and Supplementary Fig. 22 for m-type representation across transgenic lines. All reconstructions and the corresponding images are available online (http://celltypes.brain-map.org/).
Figure 4:
Figure 4:. Unsupervised classification of aspiny neurons into morphological types.
(a) Co-clustering diagram from 1000 runs of hierarchical clustering with 90% subsampled data. 19 clusters are identified by CutreeHybrid()*, which included a step to merge neurons in clusters with an n≤3 with their most highly correlated cluster and clusters with no significantly different features between them. Each m-type is assigned a color that is maintained throughout the figure (n=207 aspiny neurons). (b) Laminar distribution of m-types across layers 2/3-6b. Relative proportion of each m-type per layer is shown. (c) Examples of axonal features that vary systematically across m-types. See supplementary Fig. 19 for all morphological features included in the analysis. (c) Representative morphologies from each quantitatively defined aspiny type. Neurons are shown in their approximate laminar location with respect to averaged cortical layers. M-types are grouped by their most dominant molecular class (as defined by Cre line). Each m-type has two names, a numbered name (e.g., Aspiny_1) and a descriptive name (e.g., Dense ax., sm. den. L1). Axons are shown in the lighter color and dendrites in the darker color. Morphology scale bar: 100 μm. See Supplementary Fig. 20 for individual morphologies that went into the analysis and Supplementary Fig. 22 for m-type representation across transgenic lines. All reconstructions and the corresponding images are available online (http://celltypes.brain-map.org/).
Figure 5:
Figure 5:. Classification using paired electrophysiological and morphological data.
(a) Excitatory cellwise co-clustering matrix (across several clustering methods and weights) with consensus clusters (me-types) identified (n=253 excitatory cells with both electrophysiological data and morphological reconstructions). The me-types that were identified as unstable by subsampling analysis are identified with blue dots. (b) Same as (a) but for inhibitory cells (n=199). (c-d) Correspondences between me-types and either e-types or m-types for excitatory (c) and inhibitory (d) cells. Widths of bars are proportional to the numbers of cells in a type. (e) Consistency of excitatory e-types, m-types, and me-types with transcriptomic subclasses as inferred from transgenic line compositions. The plot for each type has separate bars for each transcriptomic subclass identified by different colors; each type has the same set of bars (see legend for labels). A consistency value close to 1 means that most of the cells with that type came from transgenic lines that were all consistent with labeling that subclass, while a value close to 0 means that cells came from lines that do not label that subclass (see Supplementary Fig. 1), based on FACS data from another study. A single consistency value of 1 (e.g., ME_Exc_8) indicates that all the cells of that type are from the indicated transcriptomic subclass (by virtue of all cells being from one or more unambiguous transgenic lines). IT: intratelencephalic, CF: corticofugal, NP: near-projecting, CT: corticothalamic. (f) Same as (e) but for inhibitory cells.
Figure 6:
Figure 6:. Transcriptomic subclasses and me-types.
(a) Example cells from each excitatory me-type grouped by putative transcriptomic subclass. Top shows morphological reconstructions of dendrites and bottom shows electrophysiological responses from the same examplar cell. Some notable specific types include non-tufted (ME_Exc_18 & 20), thick-tufted (ME_Exc_1), and inverted (ME_Exc_10 & 11) pyramidal cells. See Supplementary Table 3 for detailed descriptions of each me-type. Morphology scale bar: 100 μm. Electrophysiology scale bar: vertical, 40 mV; horizontal, 500 ms. IT: intratelencephalic, CF: corticofugal, NP: near-projecting, CT: corticothalamic. (b) Same as (a) but for inhibitory me-types, except both axonal (lighter shades) and dendritic (darker shades) compartments are shown. Some notable specific types include deep non-Martinotti cells (ME_Inh_22 & 23), Martinotti cells (ME_Inh_15, 24, 25), chandelier cells (ME_Inh_21), and late-spiking L1 neurogliaform cells (ME_Inh_17). (c-e) t-SNE plots based on electrophysiological features (n=1,938 cells) showing e-types (c), m-types (d), and me-types (e). Colors correspond to Figs. 2-4 for e- and m-types and to (a-b) for me-types.
Figure 7:
Figure 7:. Correspondence of me-types with transcriptomic types.
(a-j) Transgenic line/layer combinations that label transcriptomic types (t-types) and the corresponding me-types. Left bar chart shows the fraction of cells in a t-type identified by another study from FACS data collected with similar transgenic line and layer sampling. The t-types with fractions of 0.05 or more are shown individually; the remaining are grouped as “other.” Right bar chart shows the me-type distribution of cells in this study collected from the specified transgenic line/layer combination. The most common me-type is shown in red. Note that only cells with both electrophysiological data and a morphological reconstruction appear in this plot. The t-SNE plot based on electrophysiological features shows all cells with electrophysiology (gray), cells from the specified line/layer combination (hollow black circles), cells from the line/layer combination that also have morphological reconstructions (filled black circles), and those cells with the most-common me-type (red circles).

References

    1. Zeng H & Sanes JR Neuronal cell-type classification: challenges, opportunities and the path forward. Nat. Rev. Neurosci. 18, 530–546 (2017). - PubMed
    1. Tremblay R, Lee S & Rudy B GABAergic Interneurons in the Neocortex: From Cellular Properties to Circuits. Neuron 91, 260–292 (2016). - PMC - PubMed
    1. Harris KD & Shepherd GMG The neocortical circuit: themes and variations. Nat. Neurosci. 18, 170–181 (2015). - PMC - PubMed
    1. Lodato S & Arlotta P Generating Neuronal Diversity in the Mammalian Cerebral Cortex. Annu. Rev. Cell Dev. Biol. 31, 699–720 (2015). - PMC - PubMed
    1. Jiang X et al. Principles of connectivity among morphologically defined cell types in adult neocortex. Science 350, aac9462 (2015). - PMC - PubMed

Publication types