. 2019 Jul;51(7):1177-1186.
doi: 10.1038/s41588-019-0431-x. Epub 2019 Jun 17.

Determining protein structures using deep mutagenesis

Affiliations

Determining protein structures using deep mutagenesis

Jörn M Schmiedel et al. Nat Genet. 2019 Jul.

Abstract

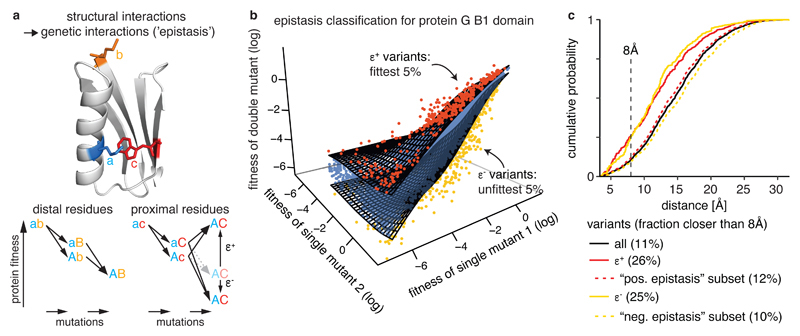
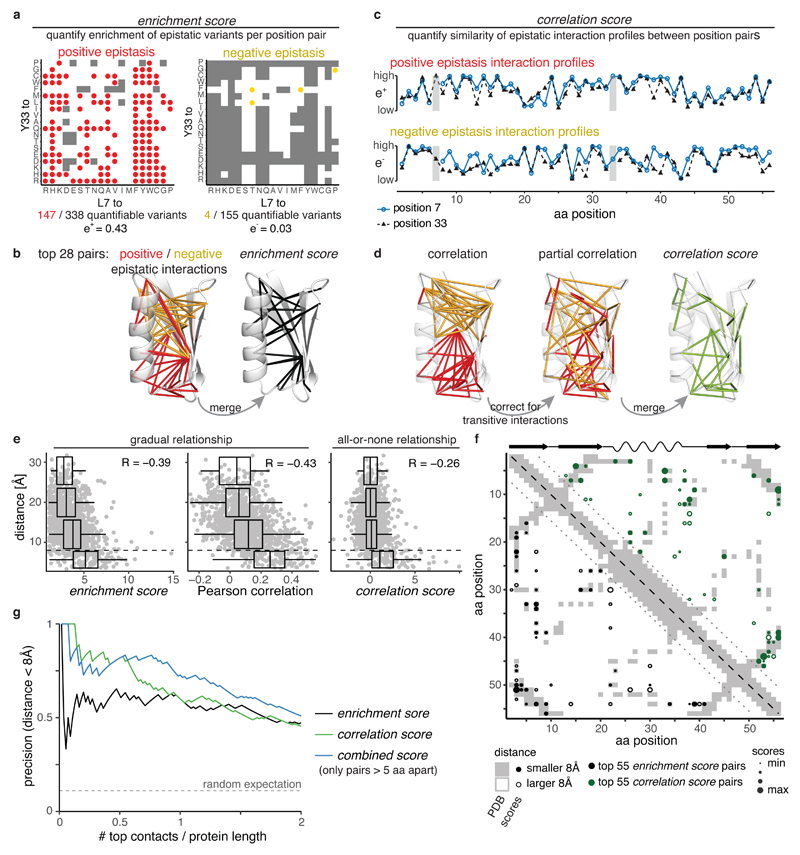
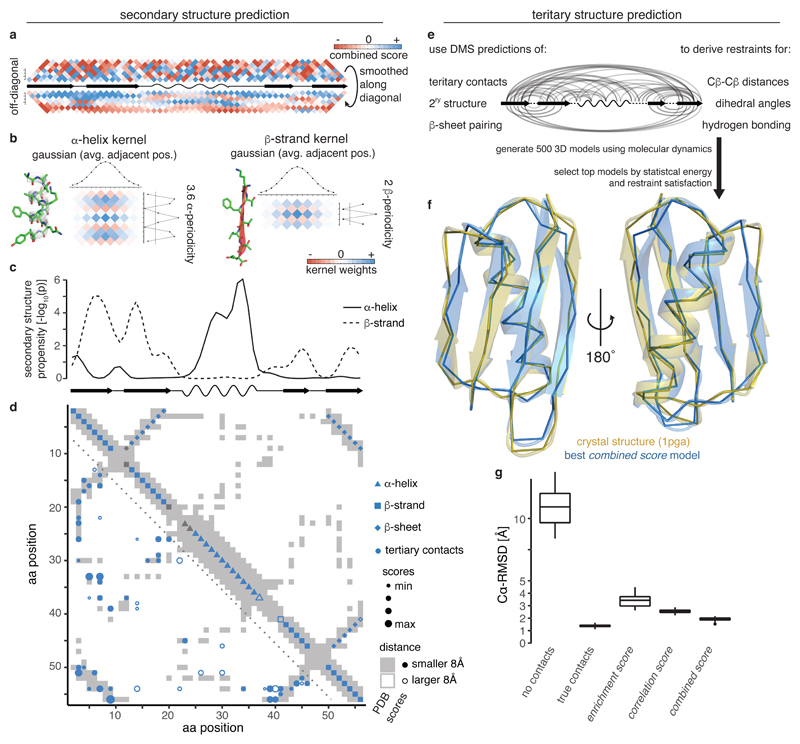
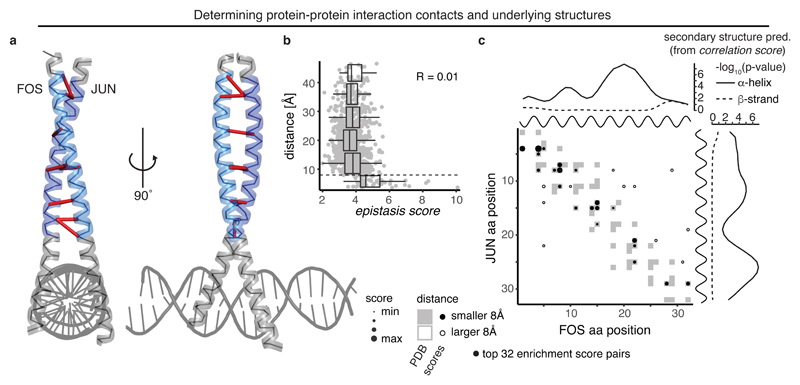
Determining the three-dimensional structures of macromolecules is a major goal of biological research, because of the close relationship between structure and function; however, thousands of protein domains still have unknown structures. Structure determination usually relies on physical techniques including X-ray crystallography, NMR spectroscopy and cryo-electron microscopy. Here we present a method that allows the high-resolution three-dimensional backbone structure of a biological macromolecule to be determined only from measurements of the activity of mutant variants of the molecule. This genetic approach to structure determination relies on the quantification of genetic interactions (epistasis) between mutations and the discrimination of direct from indirect interactions. This provides an alternative experimental strategy for structure determination, with the potential to reveal functional and in vivo structures.


Conflict of interest statement

Competing Interests

The authors declare no competing interests.

Figures

Fig. 1
Fig. 1. Extracting epistatic mutational effects from deep mutational scanning of a protein domain
a, Premise: If genetic interactions (‘epistasis’) are mostly caused by structural interactions then comprehensively quantifying epistatic interactions should suffice to predict a molecule’s structure. Structure: protein G B1 domain (PDB entry: 1pga, Ref. 61) with residues a, b, and c colored. b, Classifying epistatic variants based on deviations from expected fitness (quantile fitness surface approach). Variants with 5% most extreme fitness values given fitness of their respective single mutants were classified as positive (red, ε +) or negative (yellow, ε ) epistatic. Shown is a random sample of 104 variants in GB1 domain. c, Distance distribution of epistatic variants separated by more than 5 amino acids in the linear sequence (minimal side-chain heavy atom distance). Positive and negative epistasis subsets refer to the sets of variants applicable for epistasis analysis (see Supplementary Fig. 1c). All variants, n = 400,647; positive epistatic variants ε +, n = 14,127; positive epistasis subset, n = 315,862; negative epistatic variants ε , n = 9,837; negative epistasis subset, n = 208,442.
Fig. 2
Fig. 2. Likelihood of epistatic interactions and correlated interaction profiles predict tertiary structure contacts
a, Quantifying enrichment of positive and negative epistatic interactions for position pairs (here positions 7 and 33). Grey shading indicates epistatic interactions are not quantifiable (see Supplementary Fig. 1c-f) b, Structural distribution of top 28 epistatic interaction pairs (PDB entry 1pga). Left: Pairs with highest positive (red) and negative (yellow) epistatic enrichments. Right: Pairs with highest enrichment scores. c, Example of positive (upper) and negative (lower) epistatic interaction profiles for positions 7 and 33 (marked by grey horizontal bars). d, Structural distribution of top 28 pairs with highest positive (red) or negative (yellow) Pearson correlations (left), partial correlations (middle) or correlation scores (right) of interaction profiles. e, Distance of position pairs (> 5aa in linear sequence, n = 1,225) as a function of enrichment scores, merged Pearson correlation of epistasis interaction profiles or correlation scores. Boxplots are spaced in intervals of 8 Å; boxes cover 1st to 3rd quartile of the data, with middle bar indicating median, whiskers extend at maximum to 1.5-times the inter quartile range away from the box. Dashed horizontal line indicates 8 Å threshold. Pearson correlation coefficients are indicated. f, Distribution of top 55 position pairs (> 5 aa in linear sequence, indicated by dotted lines) with highest enrichment score (black, lower left triangle) or correlation scores (green, upper right triangle) on contact map of the reference structure (grey shading). Reference secondary structure elements (wave – alpha helix, arrow – beta strand) are shown on top. g, Precision of interaction scores to predict direct contacts (distance < 8 Å) as a function of top scoring position pairs. There are 131 direct contacts out of 1,225 pairs (> 5 aa in linear sequence), horizontal dashed line indicates random expectation.
Fig. 3
Fig. 3. Secondary and tertiary structure prediction from deep mutational scanning data
a, Local interactions (above diagonal – raw combined scores up to 7 aa distance in linear sequence, below diagonal – scores smoothed with Gaussian kernel) reveal signatures of secondary structure. Middle line is diagonal of interaction score map (rotated by 45 degrees) and shows secondary structure elements of reference structure. b, 2D kernels with sinusoidal profile to detect stereotypical alpha helical (left, period of 3.6) and beta strand (right, period of 2) interactions and perpendicular Gaussian profile to average over similar interaction patterns in adjacent positions. c, Secondary structure propensity p-values derived from kernel smoothing (one-sided permutation test, see Methods) in comparison to reference structure secondary structures (wave – alpha helix, arrow – beta strand). d, Structural predictions derived from combined score data compared to reference structure contact map (grey shading). Lower left: Top 55 non-local (>5 aa in linear sequence) tertiary contacts. Upper right: Predicted secondary structure elements. Fill indicates correct prediction. Beta strand predictions are derived by intersection of beta strand propensities (panel c) and beta sheet pairing predictions (Supplementary Fig. 3b,c). e, Scheme for generation of 3D structural models (see Methods for details). f, Overlay of top structural model of protein G B1 domain generated with restraints from combined score (blue) and crystal structure (gold, PDB entry 1pga). g, Accuracy ( root-mean-square deviation) of top 5% structural models (n = 25) generated from interaction score-derived restraints (three right-most columns) compared to reference structure. Left: ‘No contacts’ – negative control with restraints only for secondary structure (predicted by PSIPRED). ‘True contacts’ – positive control with restraints derived from 55 random tertiary contacts, secondary structure elements and beta sheet interactions of the reference structure. Boxplots: boxes cover 1st to 3rd quartile of the data, with middle bar indicating median, whiskers extend at maximum to 1.5-times the inter-quartile range away from the box.
Fig. 4
Fig. 4. Deep mutagenesis identifies protein-interaction contacts
a, Crystal structure of the leucine zipper domains of FOS and JUN with a DNA strand (PDB entry 1fos). The mutated regions (32 amino acids each) are highlighted in light blue (FOS) and dark blue (JUN). Top 10 enrichment score pairs are shown with red dashes, note that two interactions between position 8 in FOS and positions 7 and 8 in JUN, as well as three interactions between positions 14 and 15 in FOS and positions 14 and 15 in JUN are hard to distinguish. b, Distance of position pairs as a function of enrichment scores (n = 1,024). Boxplots are spaced in intervals of 8 Å; boxes cover 1st to 3rd quartile of the data, with middle bar indicating median, whiskers extend at maximum to 1.5-times the inter quartile range away from the box. Dashed horizontal line indicates 8 Å threshold. Pearson correlation coefficient is indicated. c, FOS-JUN trans interaction score map for top 32 position pairs with highest enrichment scores, compared to contact map of known interaction structure (1fos, underlying in grey). Note that protein-protein interaction maps are not symmetric. Shown on top and to the right of the contact map are the known alpha helices (black) as well as the secondary structure propensities derived from correlation scores of FOS and JUN (one-sided permutation test, see also Supplementary Fig. 4a,b).
Fig. 5
Fig. 5. Generality and data requirements for successful protein structure prediction from DMS data
a, Pab1 RRM2 domain (PDB entry 1cvj), the analyzed 25aa segment highlighted in blue. Top 12 combined score position pairs are connected with red lines, solid if distance < 8 Å, dashed otherwise. b, Overlay of top structural model of hYAP65 WW domain (positions 6-29) generated with restraints from combined score (blue) and solution NMR structure (gold, PDB entry 1k9q). c, Structural predictions derived from combined scores in RRM domain. Upper plot shows secondary structure propensities from kernel smoothing (one-sided permutation test) in comparison to secondary structures in reference. Map shows top 12 combined score position pairs in lower left and secondary structure predictions in upper right triangle, in comparison to reference contact map (grey shading). d, Structural predictions derived from combined scores in WW domain. Upper plot shows secondary structure propensities from kernel smoothing (one-sided permutation test) in comparison to secondary structures in reference. Map shows top 17 combined score position pairs in lower left and secondary structure predictions in upper right triangle, in comparison to reference contact map (grey shading). Black diamonds indicate positions of beta sheet pairing in reference. e, Precision of top L combined score position pairs for different down-sampled versions of GB1 dataset (in terms of type of variants analysed or sequencing coverage). f, Accuracy 〈RMSD〉 of top 5% structural models (n = 25) derived with tertiary contact restraints from down-sampled GB1 datasets compared to reference structure.
Fig. 6
Fig. 6. Deep learning improves contact prediction and structural models from deep mutagenesis data
a, DeepContact convolutional neural network transforms DMS-derived interaction score maps based on learned structural patterns. The basic DeepContact architecture used here takes as the only input the DMS-derived interaction score map and transforms it based on structural patterns previously learned on an orthogonal and independent training set (in which it compared evolutionary coupling-derived contact predictions with contacts in known structures of representative protein families in the SCOPe database). b, GB1 domain combined score interaction map before (left panel) and after (right panel) transformation with DeepContact convolutional neural network. Heat maps show scores (low -white, high - blue). Grey open circles show contacts (distance < 8 Å) in reference structure. c, Precision of top L predicted contacts before and after DeepContact transformation. Negative control is average over three random permutations of combined score matrices (in case of FOS-JUN dataset enrichment score matrices). d, Comparison of accuracy 〈 − RMSD〉 of top 5% GB1 structural models (n = 25 each) with restraints derived either from combined scores or from DeepContact-transformed combined scores for different (down-sampled) GB1 DMS datasets.

References

    1. Ovchinnikov S, et al. Protein structure determination using metagenome sequence data. Science. 2017;355:294–298. doi: 10.1126/science.aah4043. - DOI - PMC - PubMed
    1. Tokuriki N, Tawfik DS. Stability effects of mutations and protein evolvability. Current Opinion in Structural Biology. 2009;19:596–604. doi: 10.1016/j.sbi.2009.08.003. - DOI - PubMed
    1. Lehner B. Molecular mechanisms of epistasis within and between genes. Trends in Genetics : TIG. 2011;27:323–331. doi: 10.1016/j.tig.2011.05.007. - DOI - PubMed
    1. Fowler DM, Fields S. Deep mutational scanning: a new style of protein science. Nature Methods. 2014;11:801–807. doi: 10.1038/nmeth.3027. - DOI - PMC - PubMed
    1. Starr TN, Thornton JW. Epistasis in protein evolution. Protein science. 2016;25:1204–1218. doi: 10.1002/pro.2897. - DOI - PMC - PubMed

Publication types

MeSH terms