. 2019 Jul;20(7):890-901.
doi: 10.1038/s41590-019-0403-4. Epub 2019 Jun 17.

Single-cell RNA-seq reveals TOX as a key regulator of CD8+ T cell persistence in chronic infection

Affiliations

Single-cell RNA-seq reveals TOX as a key regulator of CD8+ T cell persistence in chronic infection

Chen Yao et al. Nat Immunol. 2019 Jul.

Abstract

Progenitor-like CD8+ T cells mediate long-term immunity to chronic infection and cancer and respond potently to immune checkpoint blockade. These cells share transcriptional regulators with memory precursor cells, including T cell-specific transcription factor 1 (TCF1), but it is unclear whether they adopt distinct programs to adapt to the immunosuppressive environment. By comparing the single-cell transcriptomes and epigenetic profiles of CD8+ T cells responding to acute and chronic viral infections, we found that progenitor-like CD8+ T cells became distinct from memory precursor cells before the peak of the T cell response. We discovered a coexpression gene module containing Tox that exhibited higher transcriptional activity associated with more abundant active histone marks in progenitor-like cells than memory precursor cells. Moreover, thymocyte selection-associated high mobility group box protein TOX (TOX) promoted the persistence of antiviral CD8+ T cells and was required for the programming of progenitor-like CD8+ T cells. Thus, long-term CD8+ T cell immunity to chronic viral infection requires unique transcriptional and epigenetic programs associated with the transcription factor TOX.


Conflict of interest statement

Competing Interests Statement

E.J.W. has consulting agreements with and/or is on the scientific advisory board for Merck, Roche, Pieris, Elstar, and Surface Oncology. E.J.W. has a patent licensing agreement on the PD-1 pathway with Roche/Genentech. Y. J. has stock in Cellular Biomedicine Group.

Figures

Fig. 1.
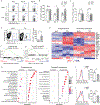
Fig. 1.. Heterogeneity of virus-specific CD8+ T cells from chronic LCMV infection delineated by scRNA-seq.
Naïve P14 CD8+ T cell were transferred to C57BL/6 mice that were subsequently infected with LCMV clone 13. P14 cells were isolated on day 7 post-infection. N= 2,597 cells were used for scRNA-seq analyses in (a-f). (a) The t-SNE projection of P14 cells, determined by Seurat 2. Each dot corresponds to one individual cell. A total of four clusters (cluster 0 through 3) were identified and color-coded. (b) A heatmap of top 10 genes expressed in each cluster defined in Fig. 1a. Columns correspond to cells; rows correspond to genes. Cells are grouped by clusters. Color scale is based on z-score distribution from −2 (purple) to 2 (yellow). (c) Volcano plot showing the differentially expressed genes between cells within cluster 3 and cells outside cluster 3 (purple: upregulated in cluster 3; grey: downregulated in cluster 3). X-axis represents log fold changes; Y-axis presents log10 adjusted P-values. Two-sided Wilcoxon rank sum test was used. (d) Single-cell transcript levels of Tcf7, Tox, Gzmb, Birc5, and Top2a illustrated in t-SNE plots. Transcript levels are color-coded: grey, not expressed; purple, expressed. (e) Left panel: Enrichment (log2 P-values) of progenitor-like gene signature in each cell, determined by one-sided Fisher’s exact test, illustrated in violin plots. Cells are separated into the four clusters defined in Fig. 1a. The violin represents the probability density at each value; each dot represents one cell. Right panel: Enrichment (log2 P-values) of progenitor-like gene signature in each cell illustrated in t-SNE plots. P-values are color-coded. (f) Left panel: The trajectory of P14 cells state transition in a two-dimensional state-space determined by Monocle 2. Each dot represents a single cell. Colors represent the clusters to which the cells belong, as defined in Fig. 1a. Right panel: X-axis represents values of component 2 determined by Monocle 2; Y-axis represents log2 P-values derived from the enrichment of progenitor-like gene signature, as in Fig. 1e. Each dot represents a single cell. Dark blue circles represent the spline.
Fig. 2.
Fig. 2.. Single-cell transcriptomes of virus-specific CD8+ T cells responding to acute and chronic viral infections diverged between day 4.5 and day 7 post-infection.
Naïve P14 cells were transferred into C57BL/6 mice that were subsequently infected with either LCMV Armstrong or LCMV clone 13. P14 cells were collected on day 4.5 and day 7 post-infection. N=16,042 cells were used for scRNA-seq analyses in (a-f). (a) t-SNE plots of 16,042 P14 cells (D4.5 Arm: 4, 651 cells; D4.5 Cl13: 4,116 cells; D7 Arm: 4, 678 cells; D7 Cl13: 2,597 cells), determined by Seurat 2. Each dot represents a single cell. Cells from different samples are color-coded (D4.5 Arm: red; D4.5 Cl13: green; D7 Arm: turquoise; D7 Cl13: purple). (b) A heatmap of top 15 genes expressed in each sample. Columns correspond to cells; rows correspond to genes. Cells are grouped by samples. Color scale is based on z-score distribution from −2 (purple) to 2 (yellow). (c) Left panel: t-SNE plots of cells from all four samples, determined by Seurat 2. A total of eleven clusters (cluster 0 through 10) were identified and color-coded. Right panel: Percentages of cells from each cluster in each sample. (d) A heatmap of top 10 genes expressed in each cluster. Cells are grouped by clusters. Color scale is based on z-score distribution from −2 (purple) to 2 (yellow). e, Dot plots of gene ontology, determined by Metascape. Each column represents one cluster; each row represents a pathway. The enrichment scores are color-coded. The ranges of log10 P-values are represented by the diameter of the circles. (f) Single-cell transcript levels of Tcf7, Ccr7, Gzmb, and Mt1 illustrated in t-SNE plots. Transcript levels are color-coded: grey, not expressed; purple, expressed.
Fig. 3.
Fig. 3.. Tox gene module distinguishes progenitor-like CD8+ T cells from memory precursor cells.
Experimental setup has been described in Fig. 2. (a) Enrichment (log2 P-values) of progenitor-like gene signature in each cell (n=16,042 cells) determined by one-sided Fisher’s exact test. Left panel: t-SNE plots with color-coded P-values. Right panel: Percentages of cells in each cluster, defined in Fig. 2c, with P-values above (red) or below (turquoise) 0.05. (b) A heatmap of top 40 genes expressed in each cluster. Cells are from cluster 5 (n=1,357 cells), 7 (n=834 cells), or 10 (n=116 cells), as defined in Fig. 2c. Columns correspond to cells; rows correspond to genes. Cells are grouped by clusters. Color scale is based on z-score distribution from −2 (purple) to 2 (yellow). (c) Differentially expressed genes between cells in cluster 10 (n=116 cells) and cells in cluster 7 (n=834 cells), illustrated by volcano plots (pink: upregulated in cluster 10; blue: upregulated in cluster 7). X-axis represents log fold changes; Y-axis presents log10 adjusted P-values. Two-sided Wilcoxon rank sum test was used. (d) Violin plots of Tox expression in cells from clusters 5 (n=1,357 cells), 7 (n=834 cells), or 10 (n=116 cells). The violin represents the probability density at each value; each dot represents one cell. (e) A gene co-expression network of the scRNA-seq data described in Fig. 2 (n=16,042 cells) was constructed by Weighted Correlation Network Analysis (WGCNA). The heatmap shows the topological overlap matrix among all genes used in the analysis. Darker color represents higher overlap. Hierarchical clustering and module assignment of genes are shown along the left side and the top. Numbers indicate module saddlebrown (29) and module tan (12). (f-g) Left panels: Enrichment (log2 P-values) of genes in module 29 (saddlebrown, f) or in module 12 (tan, g) in each cell (n=16,042 cells) was determined by one-sided Fisher’s exact test and illustrated by t-SNE plots. Right panels: Percentages of cells (n=16,042 cells) in each cluster, defined in Fig. 2c, with P-values above (red) or below (turquoise) 0.05.
Fig. 4.
Fig. 4.. Progenitor-like CD8+ T cells exhibit a H3K27ac profile distinct from that of memory precursor cells.
H3K27ac ChIP-seq was performed with progenitor-like (Tim3loBlimp-1lo), terminally exhausted (Tim3hiBlimp-1hi), memory precursor (KLRG1lo), and short-lived effector (KLRG1hi) P14 CD8+ T cells collected from mice seven days after infection with LCMV clone 13 or Armstrong. (a) Venn diagram illustrating H3K27ac peaks that are commonly or differentially present in progenitor-like (red), terminally exhausted (green), memory precursor (orange), and short-lived effector (blue) CD8+ T cells. The number of peaks in each category is indicated. (b) Pie charts demonstrating the distribution of common (left) or variable (right) H3K27ac peaks across the genome (three prime untranslated region [3′ UTR], five prime untranslated region [5′ UTR], exon, intergenic, intron, non-coding, promoter-transcription start sites [TSS], and transcription termination site [TTS]). (c) Hierarchical clustering of progenitor-like, terminally exhausted, memory precursor, and short-lived effector cells based on their H3K27ac profiles. (d) Deposition of H3K27ac centered on variable peaks (±4kb) in progenitor-like, terminally exhausted, memory precursor, and short-lived effector CD8+ T cells. Each row represents a peak. Red represents higher signal intensity; blue represents lower signal intensity.
Fig. 5.
Fig. 5.. Tox associated genes epigenetically active in progenitor-like CD8+ T cells.
(a) Deposition of H3K27ac centered on TSS of genes in module 12 (left) or on TOX binding peaks (right) in progenitor-like (red) and memory precursor (orange) CD8+ T cells. (b) Volcano plots of differentially modified H3K27ac peaks between progenitor-like and terminally exhausted CD8+ T cells (left) or between progenitor-like and memory precursor CD8+ T cells (right). H3K27ac data include n=2 biological replicates per group. Differential abundance of H3K27ac is shown as log2 fold change and is plotted against -log10(FDR). Horizontal dash lines denote FDR=0.1, whereas vertical dash lines denote fold change=±1.5. Each dot represents a peak. Peaks associated with significantly upregulated genes (fold change>2, FDR< 0.05) in progenitor-like (red, n=2 biological replicates), terminally exhausted (green, n=2 biological replicates), or memory precursor (orange, n=3 biological replicates) cells are color coded. FDR is determined by edgeR. (c-f) Normalized H3K27ac profiles at Tcf7 (c), Klrg1 (d), Gzmb (e), and Tox (f) loci in progenitor-like (red), terminally exhausted (green), memory precursor (orange), and short-lived effector (blue) CD8+ T cells. Data is representative of two independent experiments.
Fig. 6.
Fig. 6.. TOX promotes persistence of virus-specific CD8+ T cells during chronic LCMV infection.
P14 CD8+ T cells transduced with control MSCV-IRES-GFP (pMIG) or TOX overexpression constructs were transferred to C57BL/6 mice that were infected with LCMV clone 13. (a) Representative FACS plots of control or TOX-overexpressing P14 cells within CD8+ T cells on day 7, 14, and 28 post-infection. (b) Numbers of control or TOX-overexpressing splenic P14 cells on day 7 (pMIG: n=5; TOX: n=5), 14 (pMIG: n=5; TOX: n=4), and 28 (pMIG: n=8; TOX: n=10) post-infection. (c) Percentages of TCF1hiTim3lo control or TOX-overexpressing P14 cells on day 7 (pMIG: n=5; TOX: n=5) and 14 (pMIG: n=5; TOX: n=4) post-infection. (d) Day 7 control or TOX overexpression Tim3hi splenic P14 cells were transferred into infection-matched mice (200,000 cells/recipient; n=5 mice per group). Representative FACS plots (left, gated on CD8+ cells) and numbers (right) of splenic donor control or TOX-overexpressing P14 cells on day 5 post-transfer are shown. (e) A heatmap of gene expression in day 7 control or TOX-overexpressing progenitor-like (Tim3loLy108hi) or terminally exhausted (Tim3hiLy108lo) P14 cells. Color scale is based on relative fold change. Genes with TOX binding sites are underlined. (f-g) GSEA by clusterProfiler illustrating the enrichment of module 12, defined in Fig. 3e, in TOX-overexpressing versus control progenitor-like (f) or terminally exhausted (g) P14 cells. Normalized Enrichment Scores (NES) and adjusted P-values (adj P) are indicated. (h) GSEA by clusterProfiler illustrates the activated or suppressed pathways in TOX-overexpressing versus control progenitor-like (left) or terminally exhausted (right) P14 cells. Circle size reflects the count of enriched genes. Adjusted P-values are color-coded. (i-j) Phospho-AKT(S473) (i) and phospho-S6(S235/236) (j) staining in splenic control (pMIG: n=5) and TOX-overexpressing (n=5) P14 cells on day 7 post-infection after 30-min re-stimulation with 1μg/mL GP33 peptide. Data in a-d and i-j are representative of two independent experiments. Three biological replicates per group were used to generate RNA-seq data in e-h. In b-d and i-j, each dot represents one mouse; statistical significance was determined by two-sided Student’s t-test; centers and error bars represent the mean and SD. *P< 0.05, **P< 0.01, ***P< 0.001, ****P< 0.0001.
Fig. 7.
Fig. 7.. TOX is required for progenitor-like CD8+ T cell differentiation and persistent antiviral CD8+ T cell responses.
Mixed-bone marrow chimeras that received wild-type CD45.1 and wild-type CD45.2 (WT + WT) or Tox−/− CD45.1 and wild-type CD45.2 bone marrows (WT + KO) were infected with LCMV clone 13. (a) Representative FACS plots of TCF1 and Tim3 staining in splenic H-2Db GP33 tetramer+ CD45.1 or CD45.2 CD8+ T cells in chimeras on day 7. (b) Frequencies of TCF1hiTim3lo cells within H-2Db GP33 tetramer+ CD45.2 wild-type (white) and CD45.1 wild-type or Tox–/– (filled) splenic CD8+ T cells on day 7. N=5 mice in each group. (c-f) H-2Db GP33 tetramer+ wild-type and Tox–/– CD8+ T cells were collected from mixed-bone marrow chimeras on day 7 post-infection and analyzed by scRNA-seq. (c) t-SNE plots of wild-type (n=4,409 cells) and Tox–/– (n=5,296 cells) CD8+ T cells, determined by Seurat 2. (d) t-SNE plots of wild-type (n=4,409 cells) and Tox–/– (n=5,296 cells) cells that were assigned to four clusters and color-coded based on clusters. (e) A heatmap of top 10 genes expressed in each cluster defined in Fig. 7d. Columns correspond to cells; rows correspond to genes. Cells are grouped by clusters. Color scale is based on z-score distribution from −2 (purple) to 2 (yellow). (f) Violin plots of Batf, Ccr2, Gzma, Gzmb, Hif1a, Klrg1, Mt1, and Pdcd1 expression in wild-type (n=4,409 cells) and Tox–/– (n=5,296 cells) cells. The violin represents the probability density at each value; each dot represents one cell. (g) Representative FACS plots of H-2Db GP33 tetramer staining on CD45.1 or CD45.2 CD8+ T cells in the spleen of chimeras 4 weeks after infection. (h) Frequencies of H-2Db GP33 tetramer+ cells within CD45.2 wild-type (white) and CD45.1 wild-type or Tox–/– (filled) splenic CD8+ T cells four weeks after infection. N=7 mice in the WT+WT group; n=9 mice in the WT+KO group. Data in a, b, g, h are representative of two independent experiments. In b, h, statistical significance was determined by two-sided paired t-test; centers and error bars represent the mean and SD. *P< 0.05, **P< 0.01, ***P< 0.001.

Comment in

References

    1. Ahmed R & Gray D Immunological memory and protective immunity: understanding their relation. Science 272, 54–60 (1996). - PubMed
    1. Hashimoto M et al. CD8 T Cell Exhaustion in Chronic Infection and Cancer: Opportunities for Interventions. Annu Rev Med 69, 301–318 (2018). - PubMed
    1. Thommen DS & Schumacher TN T Cell Dysfunction in Cancer. Cancer cell 33, 547–562 (2018). - PMC - PubMed
    1. Kaech SM & Wherry EJ Heterogeneity and cell-fate decisions in effector and memory CD8+ T cell differentiation during viral infection. Immunity 27, 393–405 (2007). - PMC - PubMed
    1. Blackburn SD, Shin H, Freeman GJ & Wherry EJ Selective expansion of a subset of exhausted CD8 T cells by alphaPD-L1 blockade. Proc Natl Acad Sci U S A 105, 15016–15021 (2008). - PMC - PubMed

Publication types

MeSH terms