. 2019 Aug;20(8):1046-1058.
doi: 10.1038/s41590-019-0414-1. Epub 2019 Jun 17.

A temporal thymic selection switch and ligand binding kinetics constrain neonatal Foxp3+ Treg cell development

Affiliations

A temporal thymic selection switch and ligand binding kinetics constrain neonatal Foxp3+ Treg cell development

Brian D Stadinski et al. Nat Immunol. 2019 Aug.

Abstract

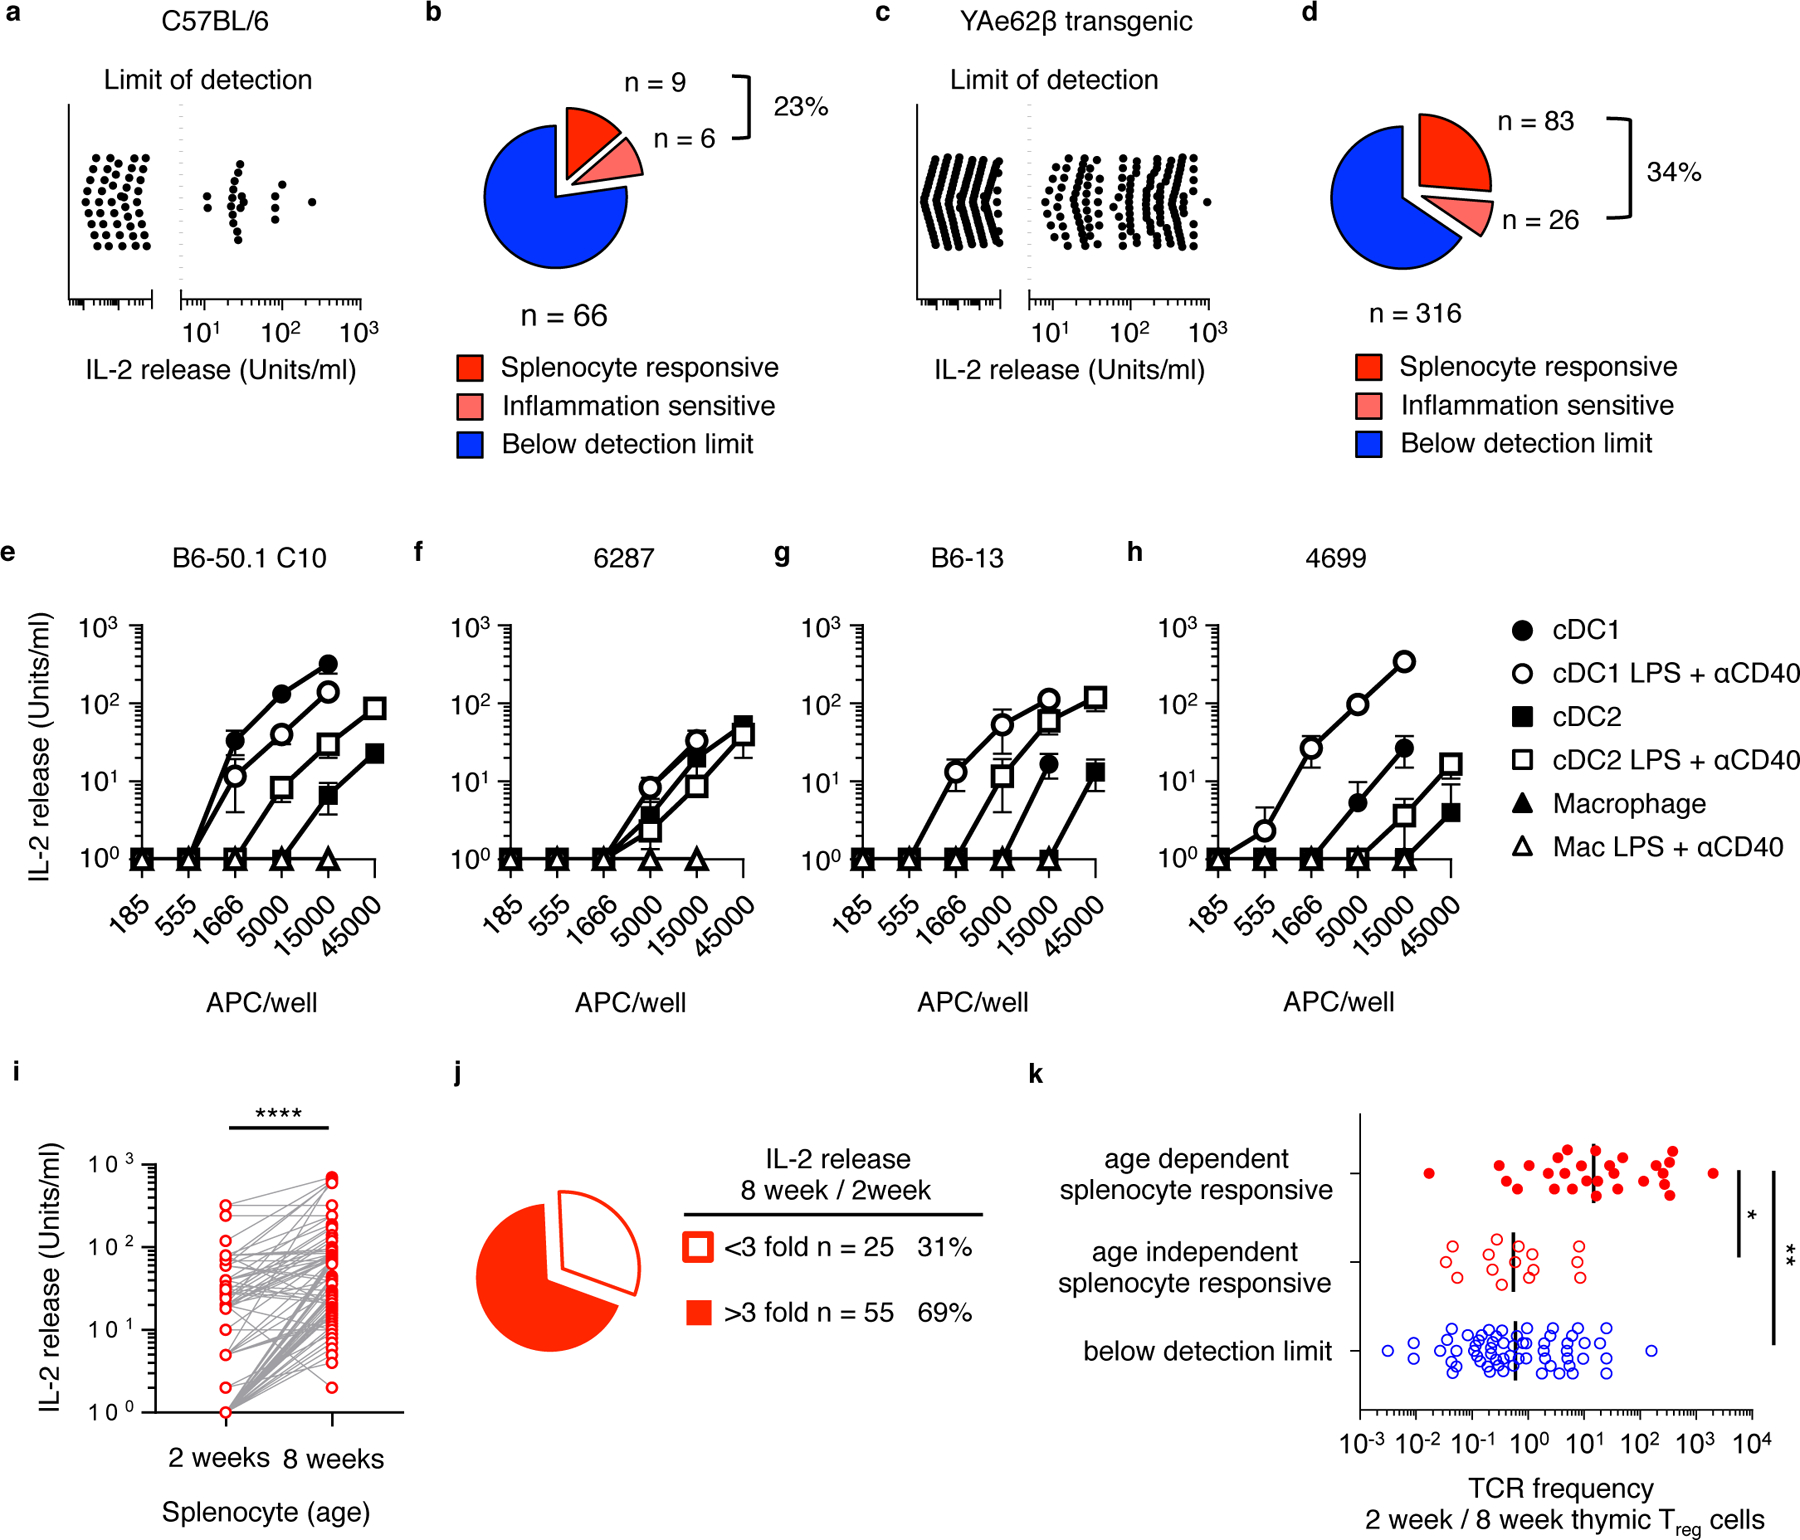
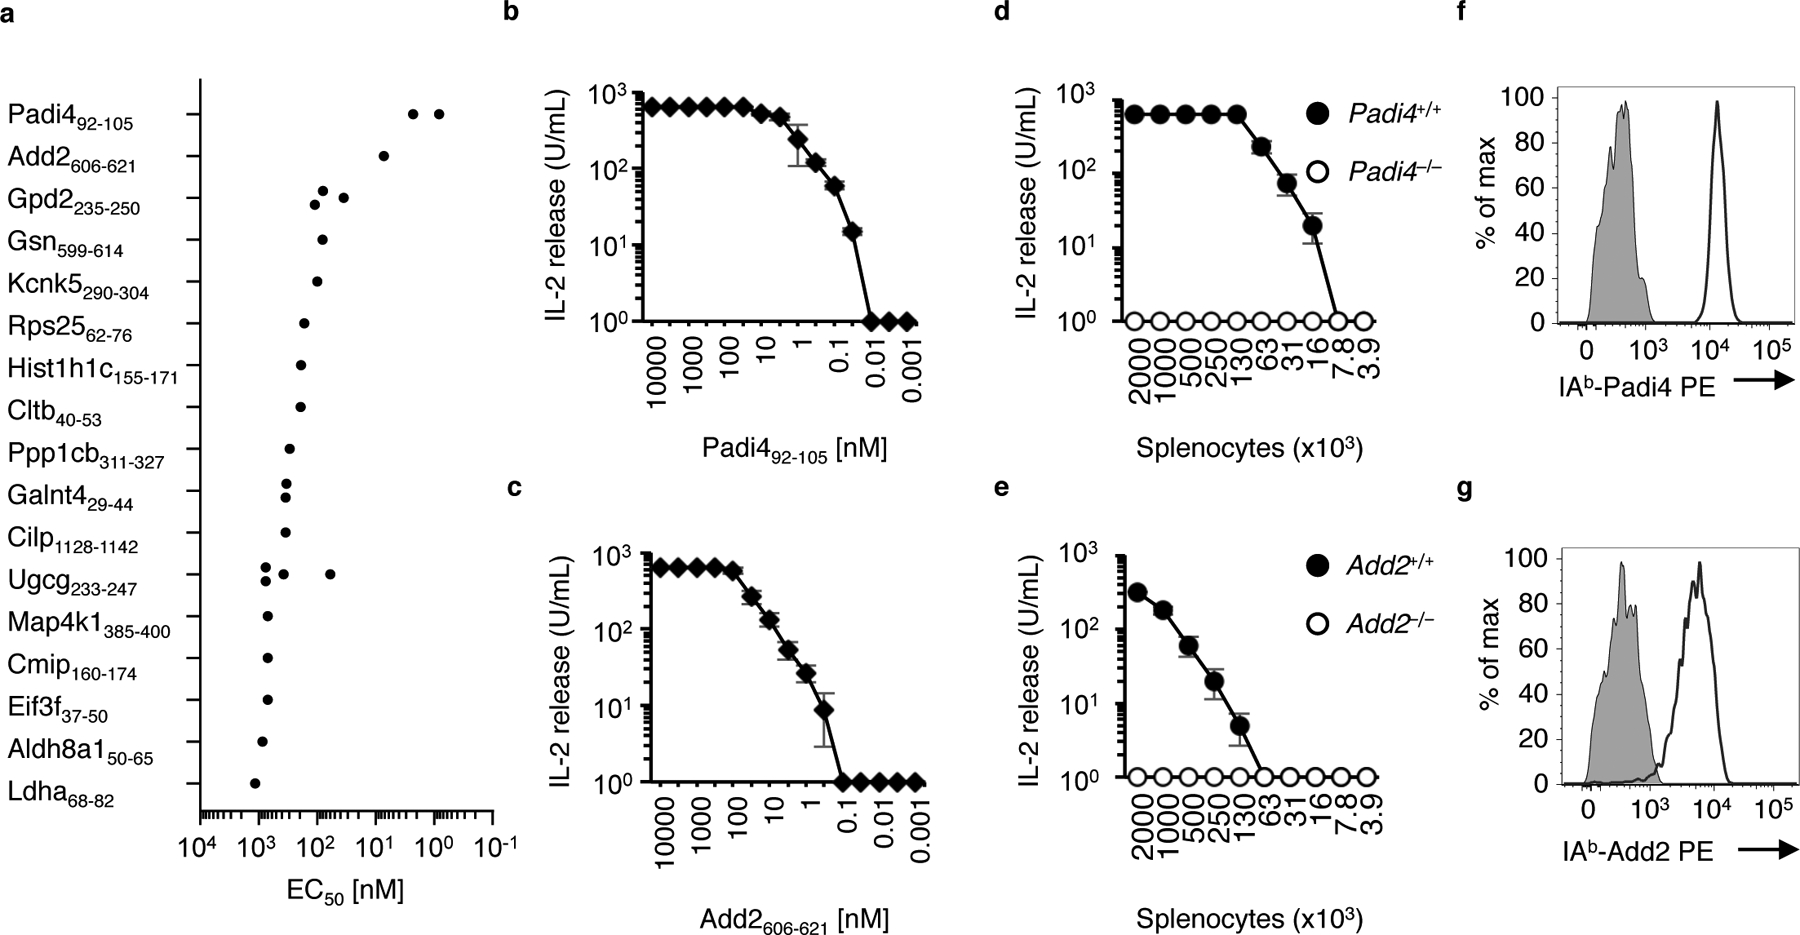
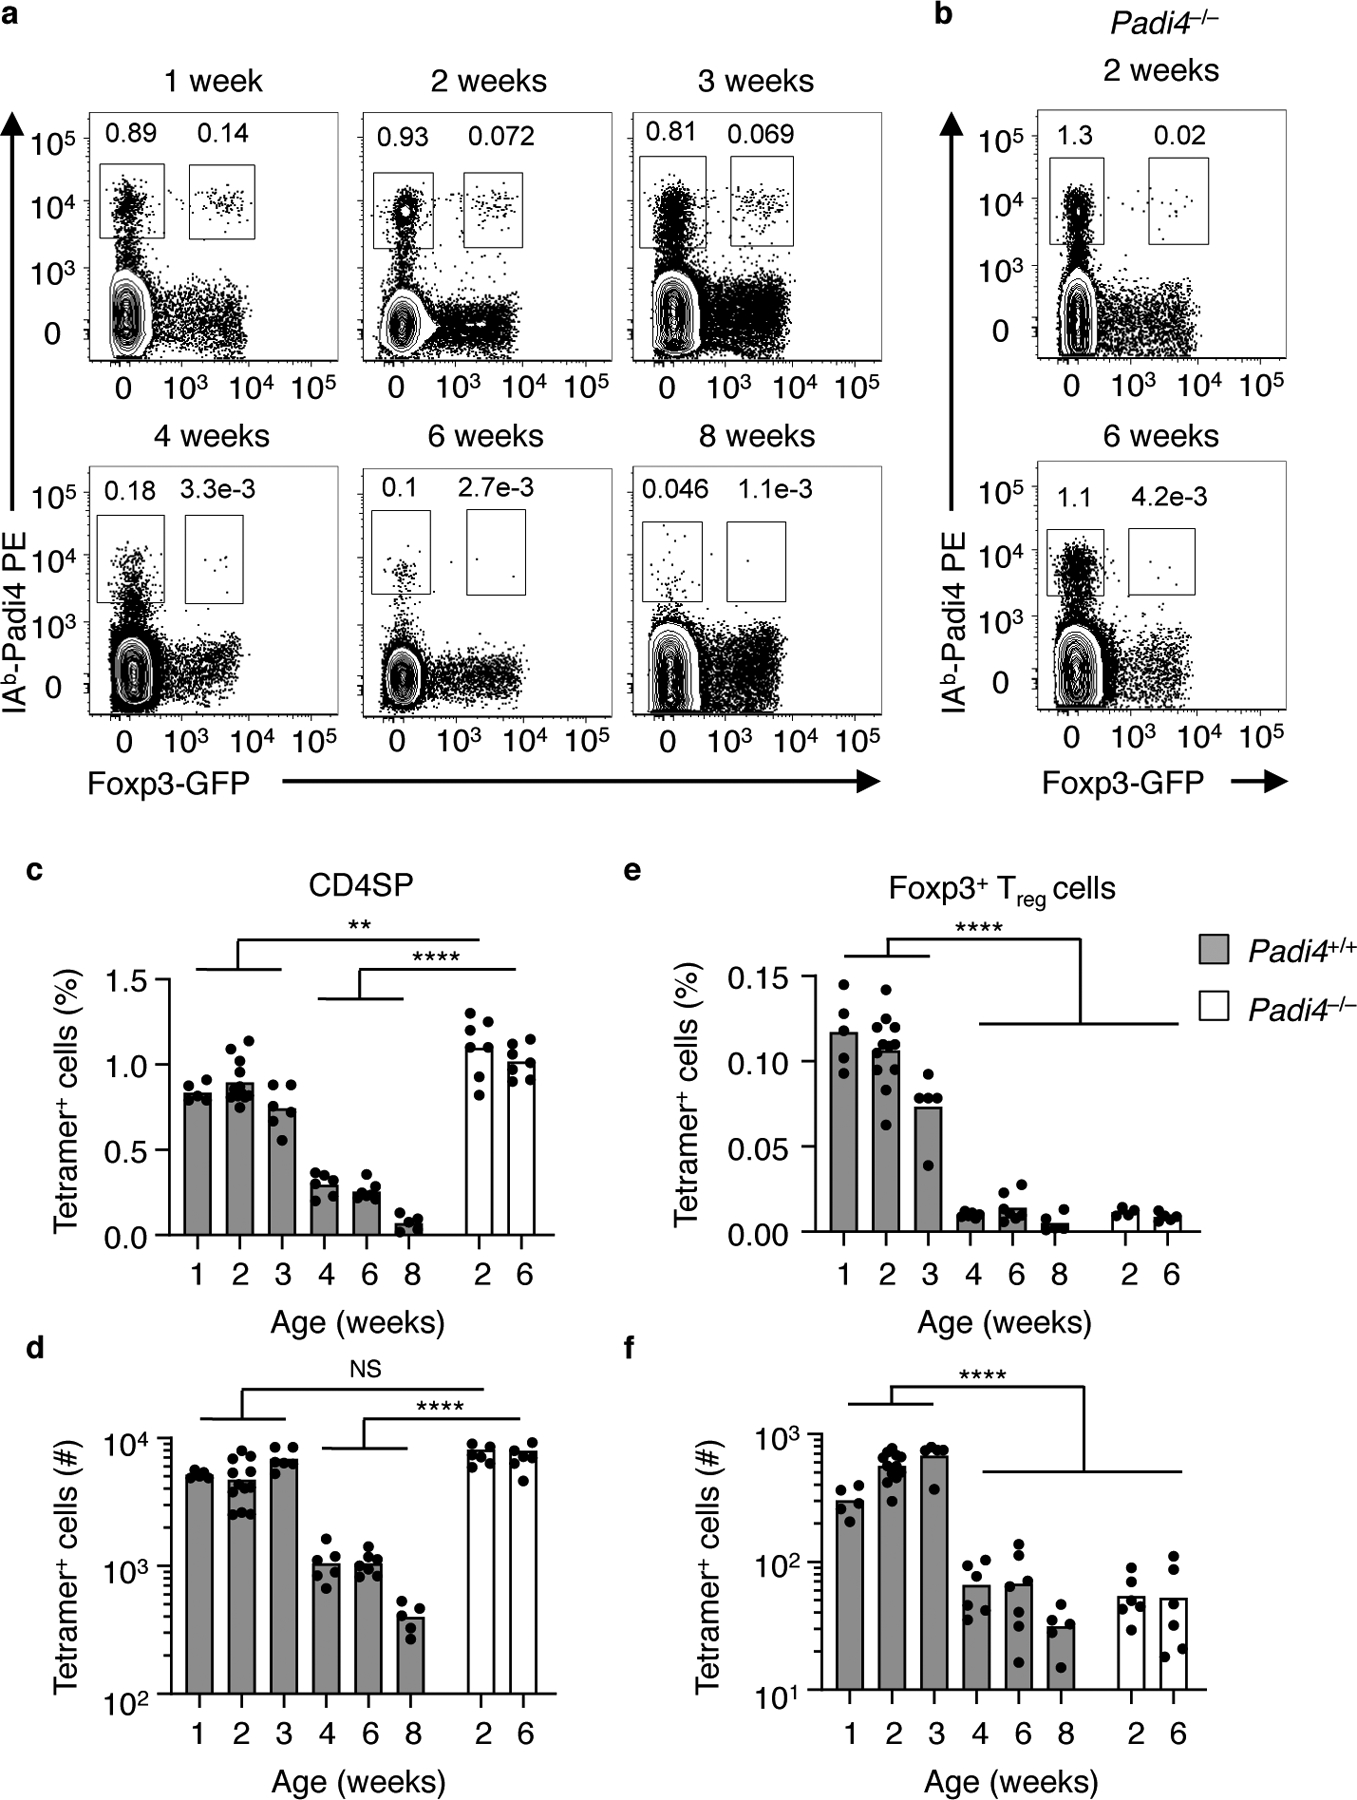
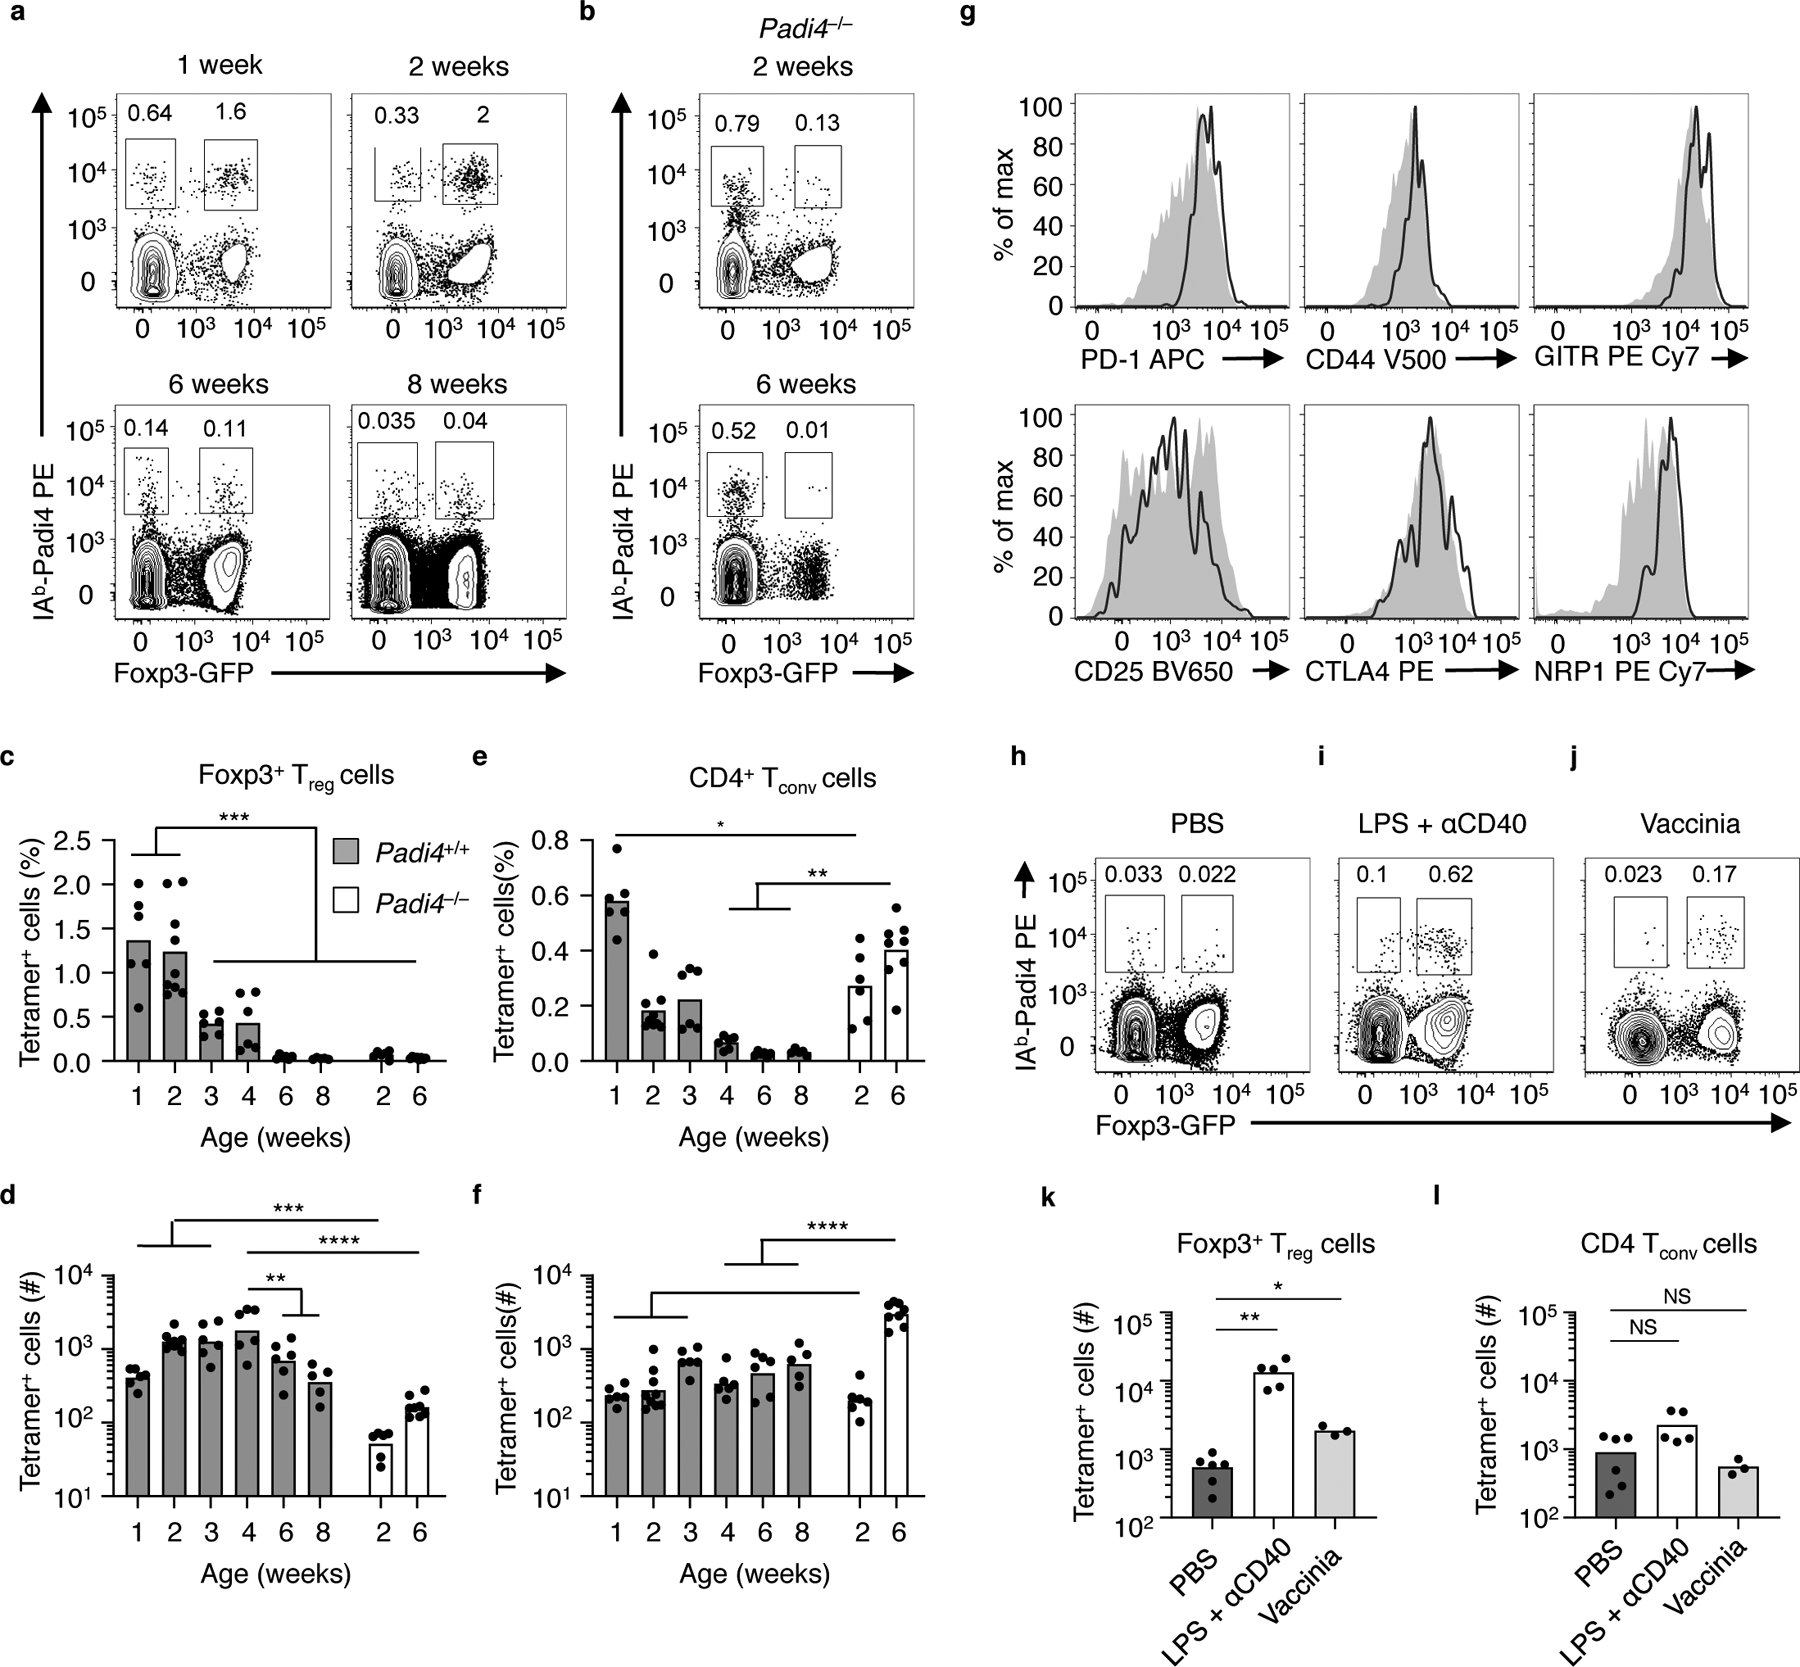
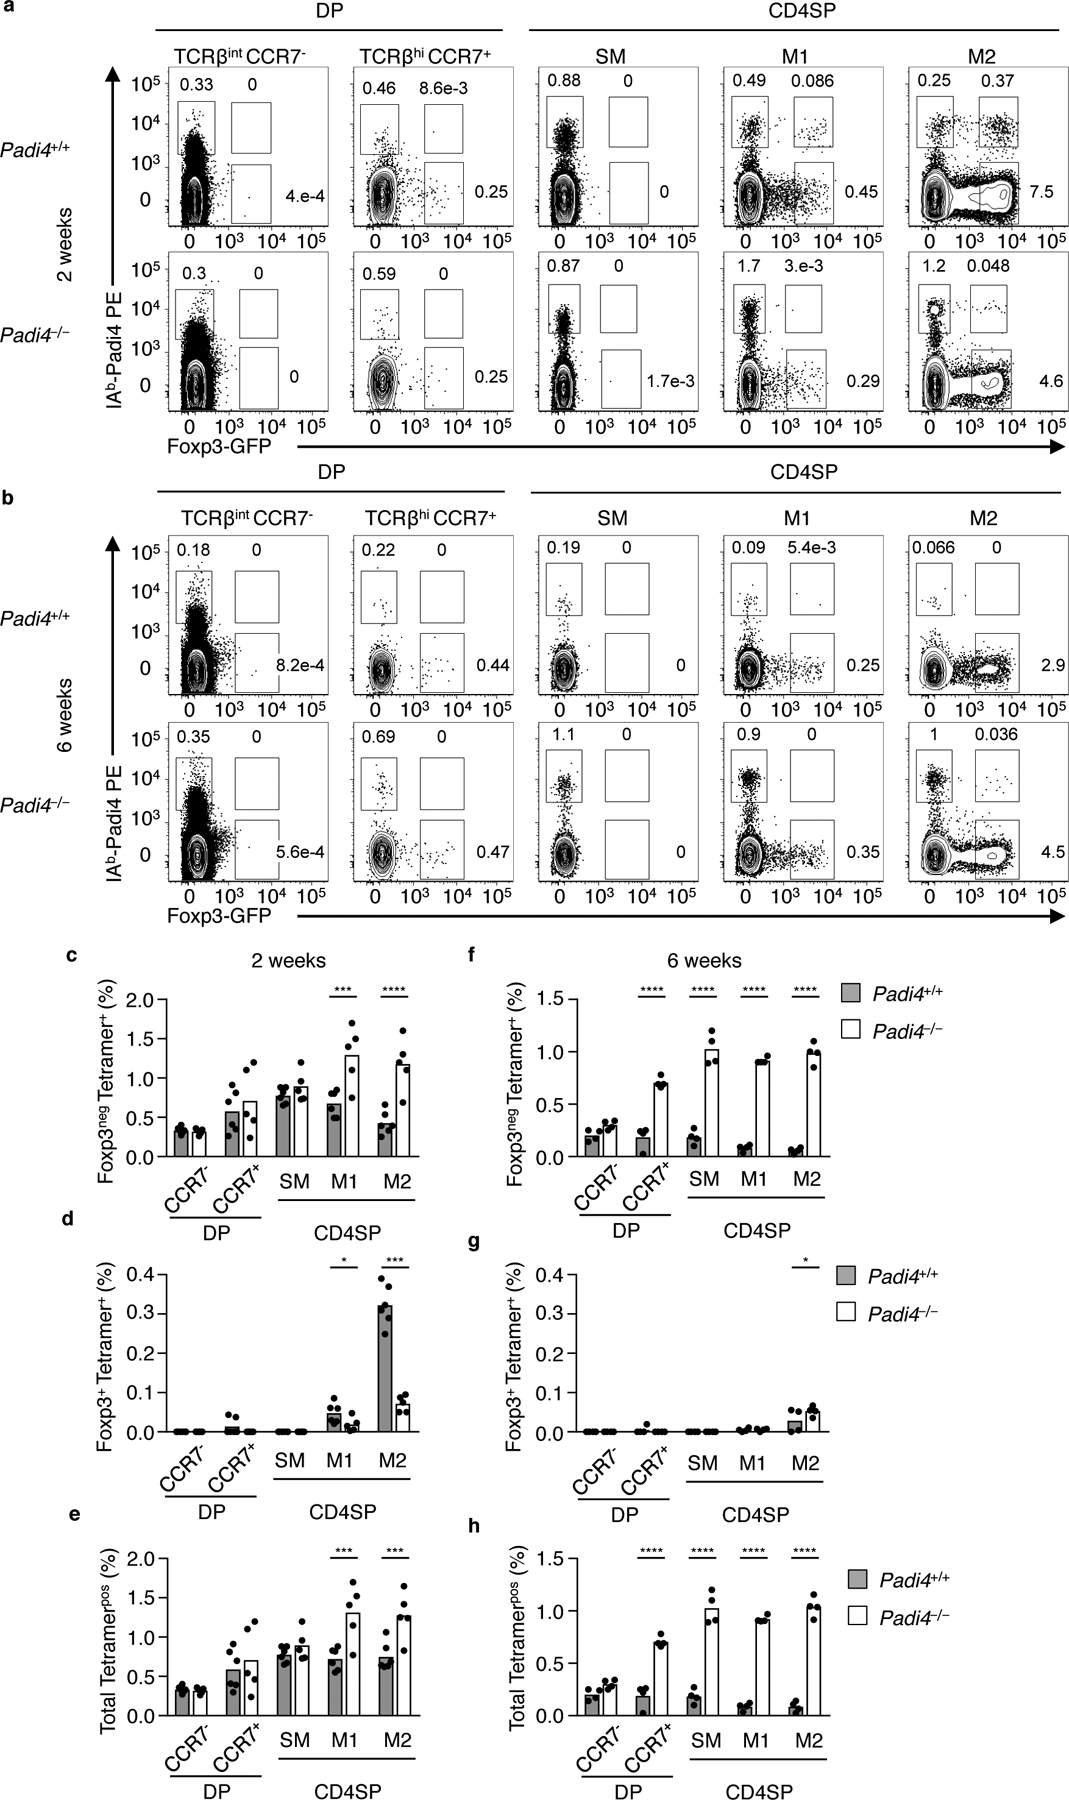
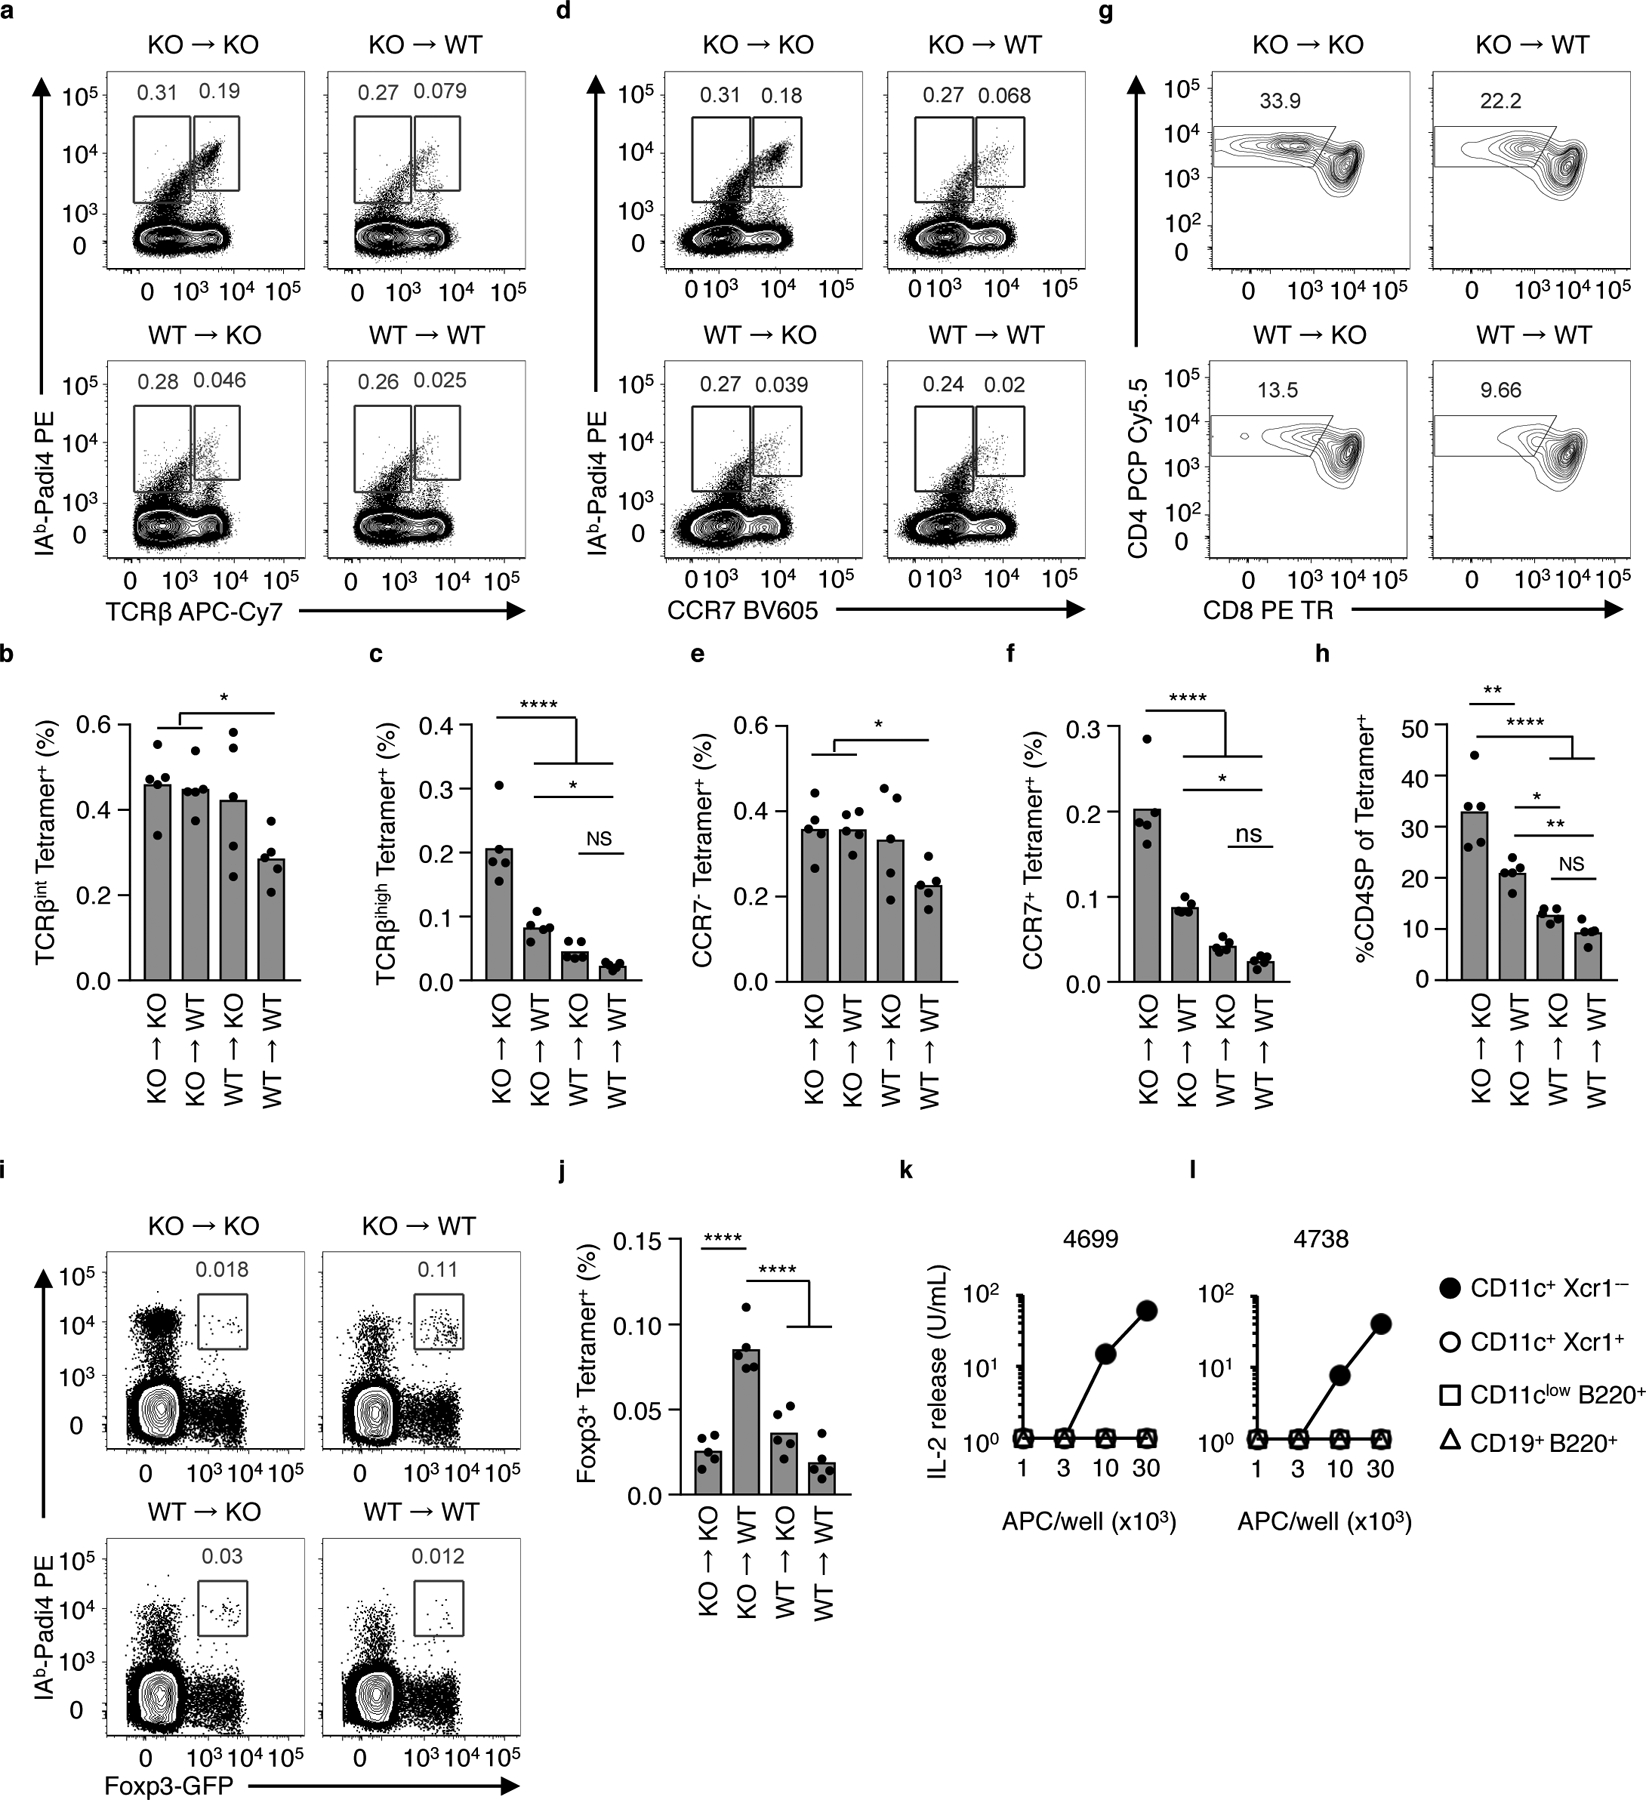
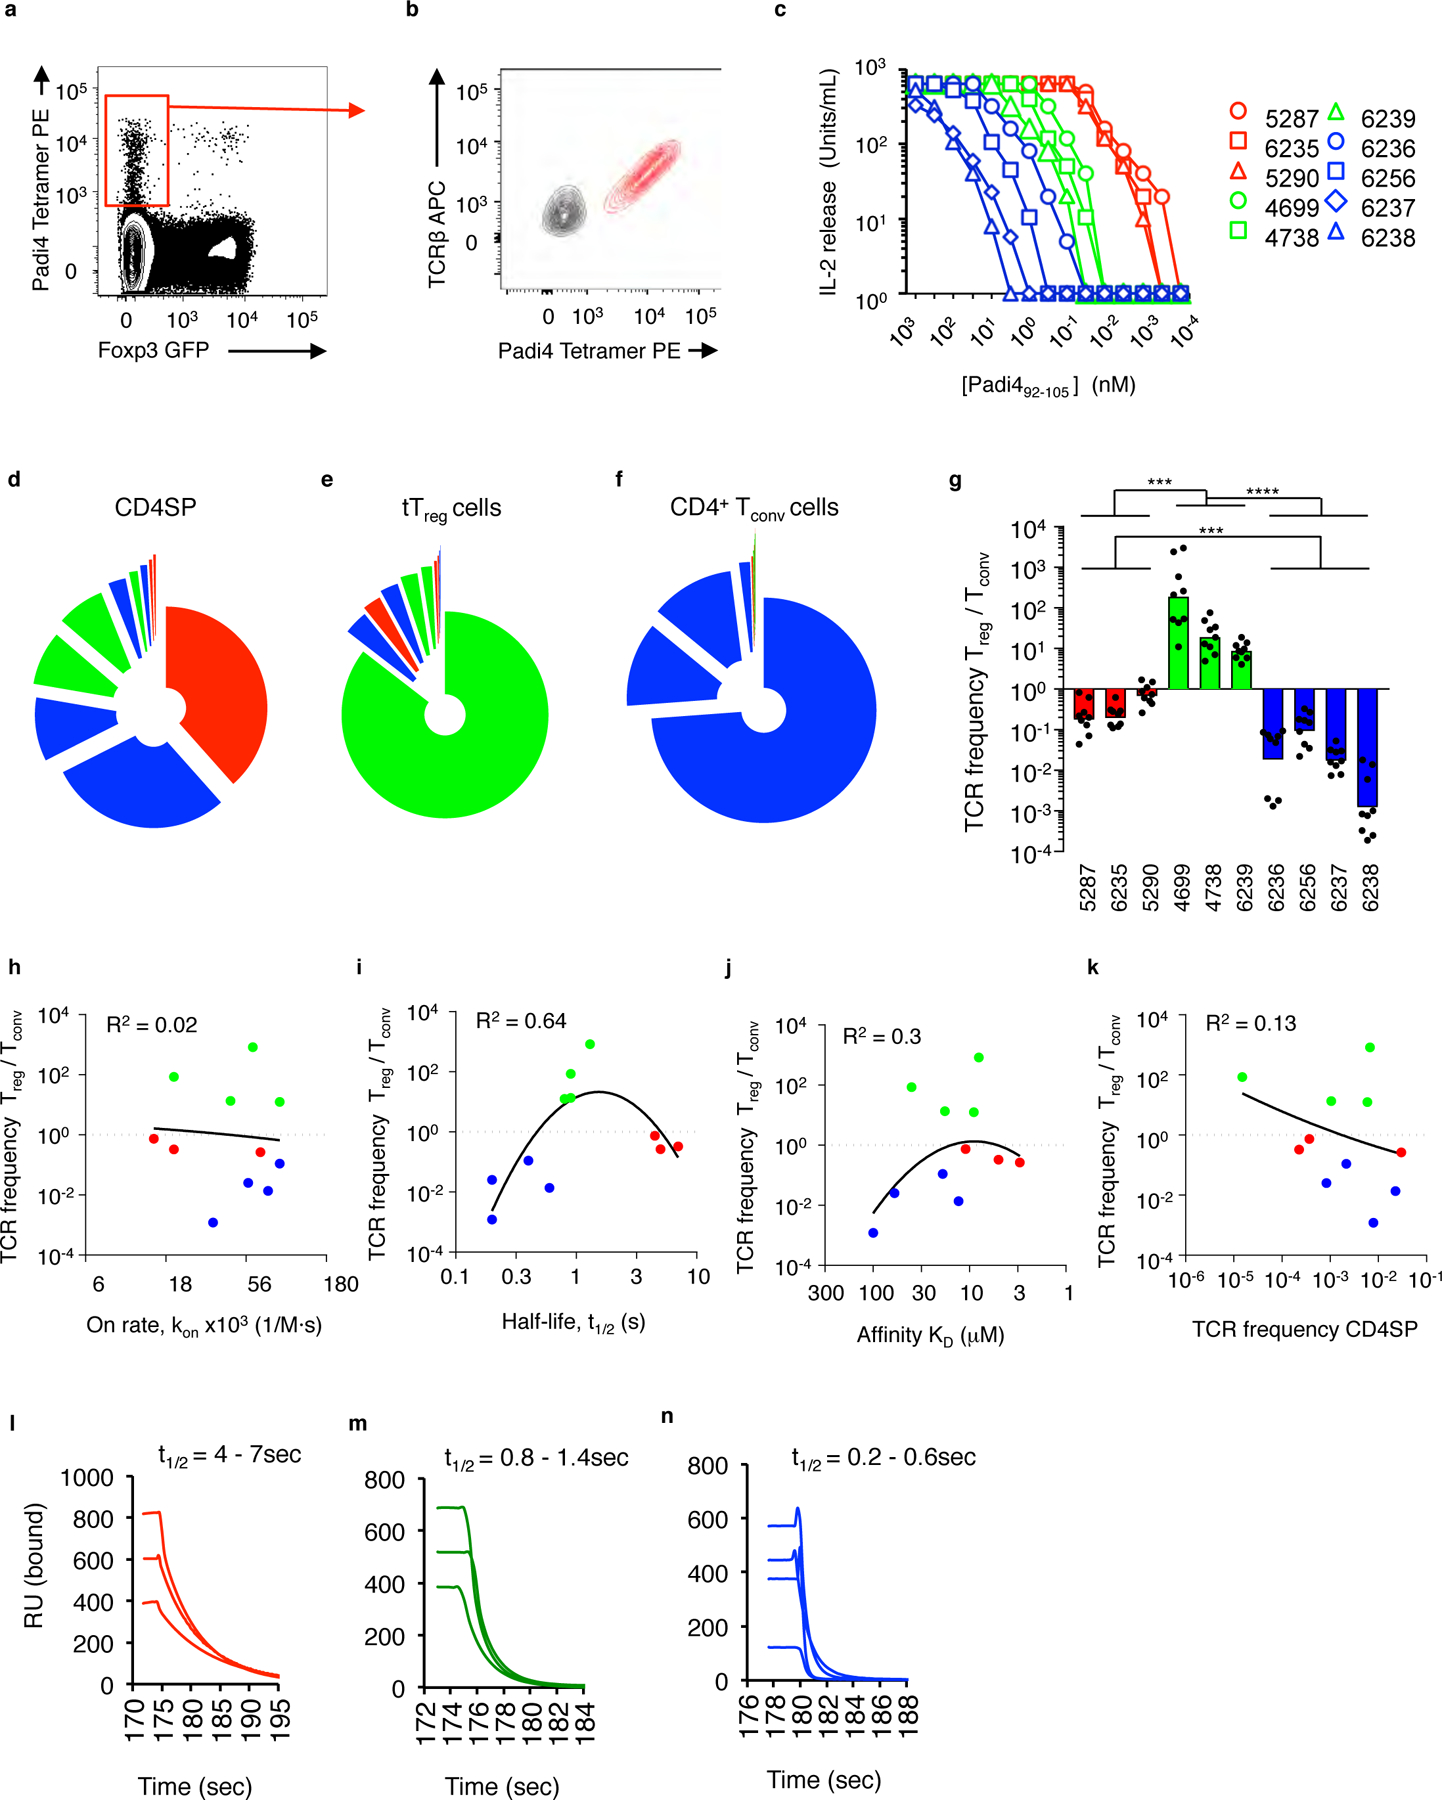
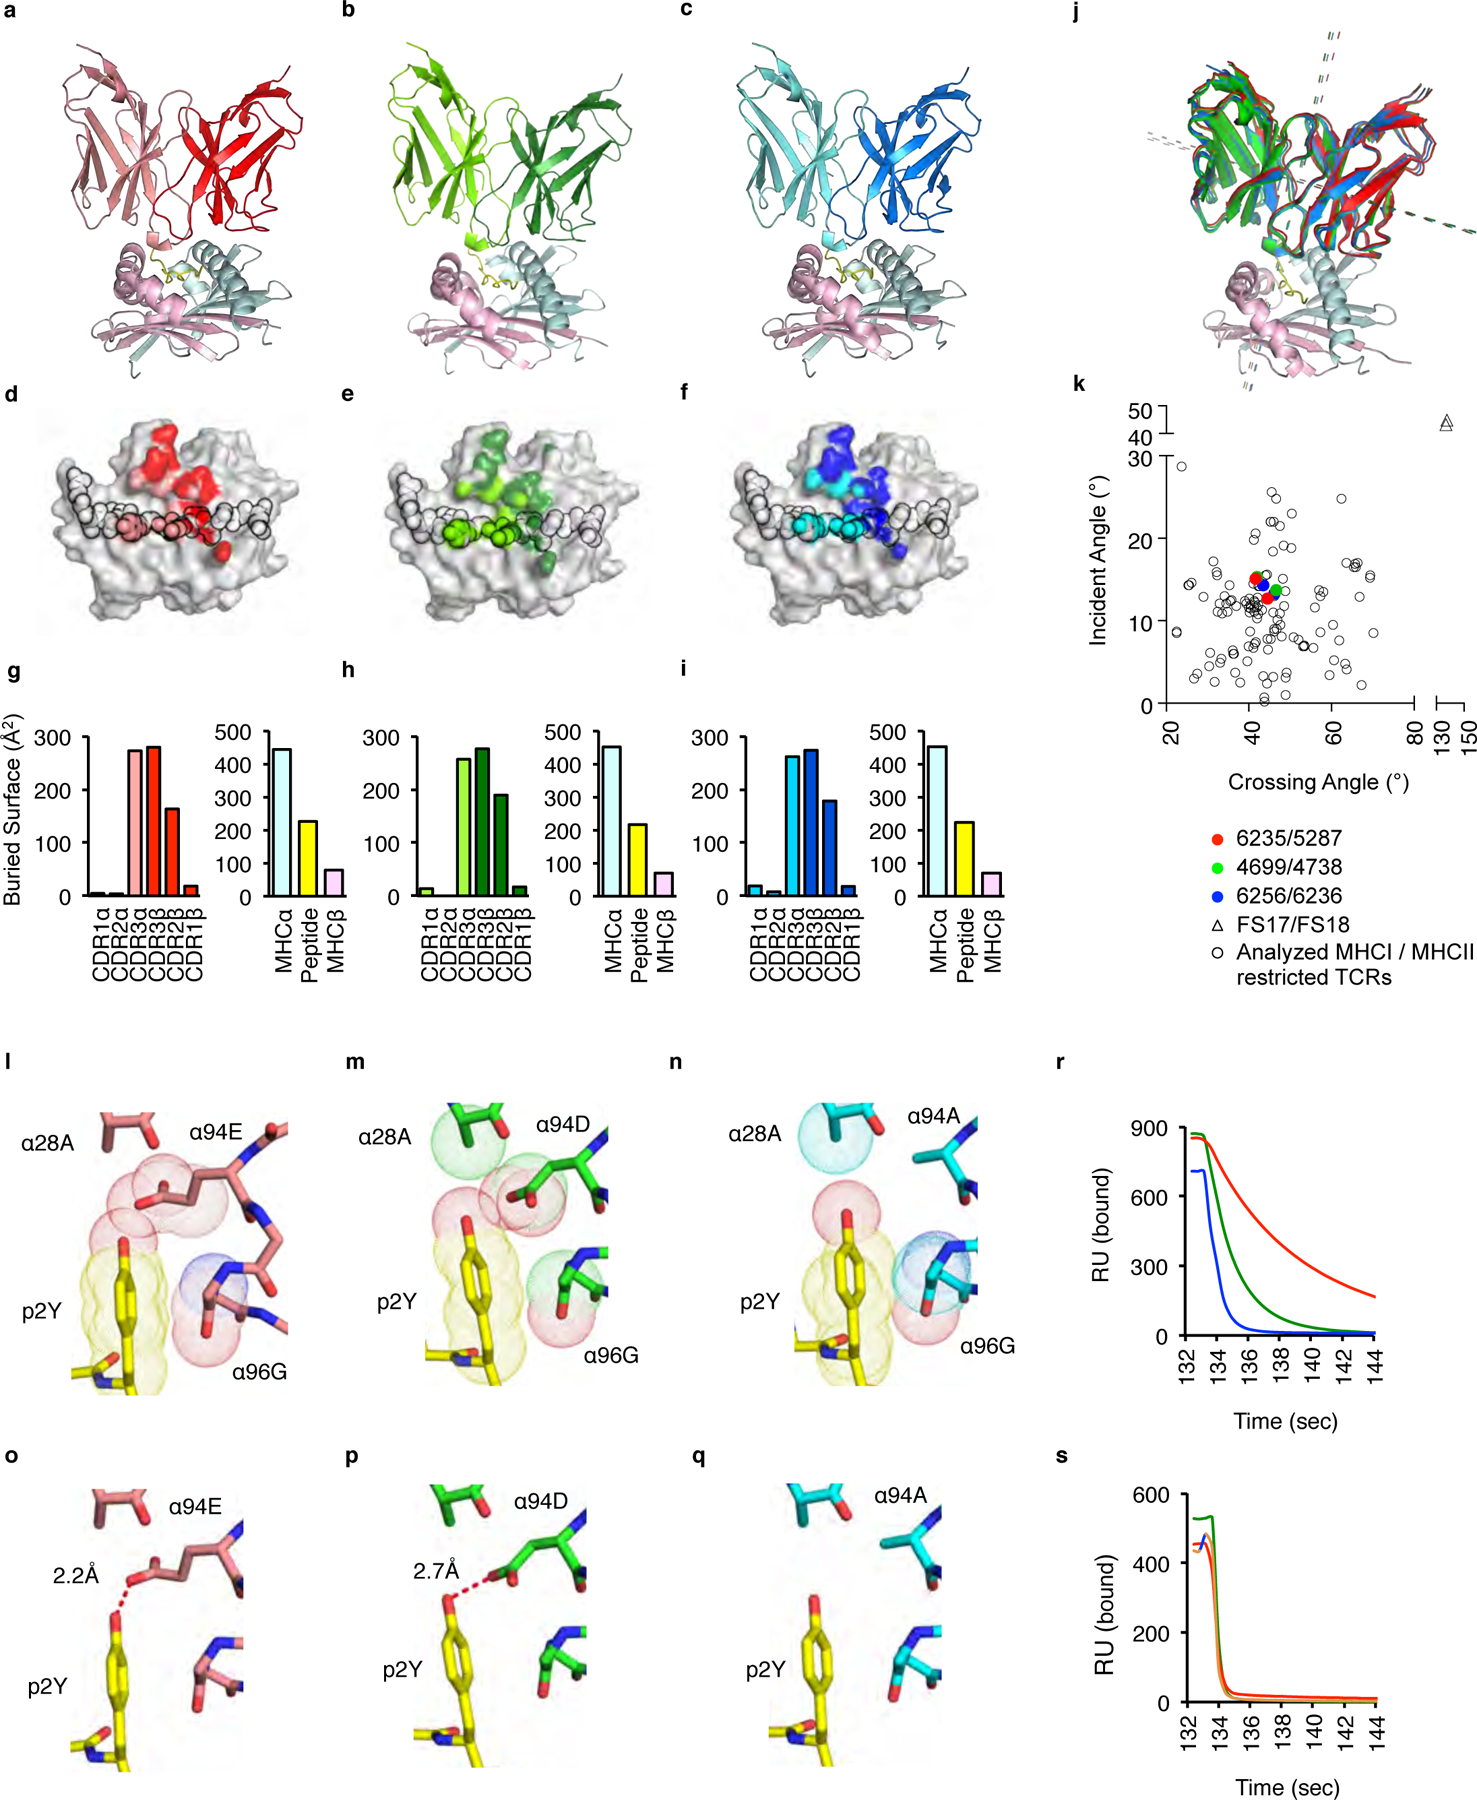
The neonatal thymus generates Foxp3+ regulatory T (tTreg) cells that are critical in controlling immune homeostasis and preventing multiorgan autoimmunity. The role of antigen specificity on neonatal tTreg cell selection is unresolved. Here we identify 17 self-peptides recognized by neonatal tTreg cells, and reveal ligand specificity patterns that include self-antigens presented in an age- and inflammation-dependent manner. Fate-mapping studies of neonatal peptidyl arginine deiminase type IV (Padi4)-specific thymocytes reveal disparate fate choices. Neonatal thymocytes expressing T cell receptors that engage IAb-Padi4 with moderate dwell times within a conventional docking orientation are exported as tTreg cells. In contrast, Padi4-specific T cell receptors with short dwell times are expressed on CD4+ T cells, while long dwell times induce negative selection. Temporally, Padi4-specific thymocytes are subject to a developmental stage-specific change in negative selection, which precludes tTreg cell development. Thus, a temporal switch in negative selection and ligand binding kinetics constrains the neonatal tTreg selection window.


Conflict of interest statement

Competing interests

The authors declare no competing interests

Figures

Figure 1.
Figure 1.
T cell receptors expressed on neonate-derived tTreg cells can recognize steady state, inflammation- and age-dependent self-antigens. (a) IL-2 release and (b) frequency at which 66 C57BL/6-derived tTreg hybridomas and (c, d) 316 Yae62β+ tTreg hybridomas react with splenocytes isolated from adult naïve mice (red) or mice pretreated with LPS and αCD40 (pink). (e) IL-2 response of B6–50.1C10, (f) 6287, (g) B6–13 and (h) 4699 tTreg hybridomas cultured with titrating numbers of cDC1, cDC2 and macrophages isolated from naïve mice (filled symbol) or mice pretreated with LPS and αCD40 (open symbol). Data are an example of three independent experiments giving similar results. Error bars show standard deviation. (i) IL-2 release by 80 in vitro splenocyte-reactive tTreg hybridomas cultured with spleen cells isolated from 2 week old and 8 week old C57BL/6 mice. Results are from two independent experiments with similar results. (j) Quantification of splenocyte-reactive hybridomas that increase IL-2 production in response to adult v. neonatal spleen cells. (k) The frequency of age-dependent (red, filled circles), age-independent in vitro splenocyte-responsive (red, open circles) and below detection limit (blue) TRAV14+ (Vα2+) tTreg TCRs carried in the thymic Foxp3+ tTreg pool at 2 weeks of age as compared to 8 weeks of age. Lines represent the data geometric mean. Data are from (i,j) 80 self-reactive and (k) 103 Va2+ clonotypes; 28 age-dependent, 12 age-independent and 63 below limit of detection. (i) ****P<0.0001 ratio paired 2-tailed t test, (k) *P<0.05, **P<0.01 one-way ANOVA Tukey multiple comparisons test.
Figure 2.
Figure 2.
Identification of self-ligands recognized by neonatal tTreg TCR using an immunopeptidome library screen. (a) Chart of EC50 values of IL-2 release for tTreg hybridomas responding to titrating concentrations of library-identified self-peptides. (b-e) IL-2 release of the (b) 4699 tTreg hybridoma and (c) 6287 4699 tTreg hybridoma cultured with titrating concentrations of identified Padi492–105 or Add2606–621 presented by IAb expressing mouse fibroblasts, or (d) with titrating concentrations of C57BL/6 or Padi4−/− splenocytes, or (e) with titrating concentrations of C57BL/6 or Add2−/− splenocytes. Data are example of three independent experiments giving similar results. Error bars show standard deviation. (f) IAb-Padi4 tetramer staining of the 4699 tTreg hybridoma, and (g) IAb-Add2 tetramer staining of the 6287 tTreg hybridoma (black line). Gray negative control stains are the IAb-Add2 tetramer staining of the 4699 tTreg hybridoma and the IAb-Padi4 tetramer staining the 6287 tTreg hybridoma.
Figure 3.
Figure 3.
Development of Padi492–105-specific tTreg cells is restricted to the neonatal thymus. (a, b) Flow cytometry of Vα2+ CD4+CD8 thymocytes in (a) YAe62β.Foxp3-GFP and (b) Padi4−/−.YAe62β.Foxp3-GFP mice at different ages; numbers adjacent to outlined areas indicate percent IAb-Padi4 tetramer+ Foxp3-GFP (left) and Foxp3-GFP+ (right). (c-f) Frequency and total cell numbers of IAb-Padi4+ (c, d) CD4+CD8 Foxp3 and (e, f) Foxp3-GFP+ tTreg cells in WT and Padi4−/− YAe62β.Foxp3-GFP mice at different ages. Bars represent the data mean, n = 6, 12, 6, 6, 6, 6 WT mice at 1, 2, 3, 4, and 8 weeks old, n = 7 Padi4−/− 2 and 6 weeks old. (c-f) NS P>0.05, **P<0.01, ***P<0.01, ****P<0.0001 one-way ANOVA Tukey multiple comparisons test.
Figure 4.
Figure 4.
Padi4-specific tTreg cells seed the peripheral repertoire during the neonatal window and respond to inflammation. (a, b) Flow cytometry of splenic Vα2+ CD4+ T cells in (a) YAe62β.Foxp3-GFP mice and (b) Padi4−/−.YAe62β.Foxp3-GFP mice at different ages (weeks). (c-f) Frequency and (d) total numbers of IAb-Padi4 tetramerpos Vα2+ CD4+ Foxp3-GFPpos tTreg cells and (e, f) Vα2+ CD4+ Foxp3-GFPneg CD4 Tconv cells in YAe62β.Foxp3-GFP and Padi4−/−.YAe62β.Foxp3-GFP mice at different ages. (g) Flow cytometry analyzing the expression of PD-1, CD44, GITR, CD25, CTLA4 and Nrp1 on IAb-Padi4 tetramerpos Vα2+CD4+Foxp3-GFPpos tTreg cells isolated from 2 week old YAe62β.Foxp3-GFP mice (black line). Gray histograms are IAb-Padi4 tetramerneg Vα2+CD4+Foxp3-GFPpos tTreg cells in the same mice. (h-l) Flow cytometry of Vα2+ CD4+ T cells isolated from 8 week old YAe62β.Foxp3-GFP mice following i.p. injection of (h) PBS, (i) LPS + αCD40 and (j) rVaccina virus 5 days prior. Quantification of IAb-Padi4 tetramerpos (k) CD4+Foxp3-GFPpos tTreg cells and (l) Foxp3-GFPneg CD4 Tconv cells present in YAe62β.Foxp3-GFP mice following i.p. injection of PBS, LPS+αCD40 or rVac virus. (a g) Data are derived from 3 independent experiments giving similar results, bars represent the data mean, n = 6, 9, 6, 6, 6, 6 WT mice at 1, 2, 3, 4, and 8 weeks old, n = 6 and 8 Padi4−/− 2 and 6 weeks old. (h-l) Data pooled from 3 independent experiments with similar results, with 9, 5 and 6 mice per group, bars represent the data mean. Significance identified using a one-way ANOVA Tukey multiple comparisons test, and (k,l) non-parametric Dunn’s multiple comparison test. ns P>0.05, *P<0.05, **P<0.01, ***P<0.001, ****P<0.0001.
Figure 5.
Figure 5.
Padi4-specific thymocytes are subject to temporally regulated, stage-specific changes in negative selection. Flow cytometry analyses of (a) neonatal and (b) adult Vα2+ DP and CD4SP thymocytes isolated from Padi4+/+.YAe62β.Foxp3-GFP (top row) and Padi4−/−.YAe62β.Foxp3-GFP (bottom row) mice for Foxp3 expression and IAb-Padi4 tetramer binding. Subsets shown are pre-selection DP (CD4+ CD8+ TCRβint CCR7neg), post-selection DP (CD4+CD8+ TCRβhi CCR7pos), and TCRβhi CCR7pos CD4SP thymocytes pre-gated on CD69+ MHC-Ilo (SM), CD69+ MHC-Ihi (M1) and CD69lo MHC-Ihi (M2). (c-g) Quantification of the frequency of IAb-Padi4 tetramerpos (c,f) Foxp3neg, (d,g) Foxp3pos and (e,h) total (Foxp3neg + Foxp3+) thymocytes within each thymic subset. (c-h) Data are derived from 3 independent experiments giving similar results, bars represent the data mean, n = 6 WT and Padi4−/− mice at 2 and 6 weeks old. Significance identified using a one-way ANOVA Sidak’s multiple comparison test. ns P>0.05, *P<0.05, **P<0.01, ***P<0.001, ****P<0.0001.
Figure 6.
Figure 6.
Limiting Negative Selection restores development of Padi4-specific tTreg cells in the adult thymus. (a-j) Eliminating Padi4 expression in BM derived cells increases the frequency of Padi4-specific TCRβhi CCR7+ CD4SP thymocytes and tTreg cells. Flow cytometry analyses of thymocytes isolated from mixed WT and Padi4−/− (KO) YAe62β bone marrow chimeric mice. (a, b) Total Vα2+ thymocytes analyzed for IAb-Padi4 tetramer binding and (a) TCRβ and (b) CCR7 expression. (c) Flow cytometry analyses of total Vα2+ IAb-Padi4 tetramerpos thymocytes for CD4 and CD8 expression. (d-h) Quantification of Vα2+ IAb-Padi4 tetramerpos (d) TCRβint (e) TCRβhi (f) CCR7neg (g) CCR7pos and (h) CD4SP thymocytes. (i) Vα2+ CD4SP thymocytes analyzed for IAb-Padi4 tetramer binding and Foxp3 expression, and (j) quantification of IAb-Padi4 tetramerpos Foxp3-GFP+ CD4SP thymocytes. Data is from two independent experiments giving similar results, n = 5 mice per group, bars represent the data mean. (k,l) IL-2 response of the (k) 4699 and (l) 4738 tTreg hybridomas cultured with titrating numbers of CD11c+ Xcr1neg cDC (filled circle), CD11c+ Xcr1pos cDC (open circle), CD11clo B220+ pDC (open squares) and CD19+ B220+ B cells (open triangle) isolated from thymus of adult C57BL/6 mice. Data is from two independent experiments giving similar results. Significance identified using a one-way ANOVA Tukey multiple comparisons test, ns P>0.05, *P<0.05, **P<0.01, ***P<0.001, ****P<0.0001.
Figure 7.
Figure 7.
Padi4-specific neonatal tTreg cells express TCRs with modest dwell times. (a) IAb-Padi4 tetramerpos Vα2+ Foxp3-GFPneg CD4SP thymocytes isolated from YAe62β.Foxp3-GFP were sorted, and (b) TCRs cloned and re-expressed in T cell hybridomas. (c) IL-2 response of Padi4-reactive T cell hybridomas cultured with IAb-expressing fibroblasts and titrating concentration of soluble Padi492–105 peptide; see key for name of individual TCRs. (d-f) Relative distribution of Padi4-reactive TCR clonotypes carried in the (d) thymic Foxp3-GFPneg CD4SP, (e) splenic CD4+ Foxp3-GFPpos tTreg and (f) splenic CD4+ Foxp3-GFPneg Tconv cell repertoires of 2-week old YAe62β.Foxp3-GFP mice. Colored pie slices represent individual TCRs described in (c). (g) Frequency distribution of individual Padi4-reactive T cell clonotypes carried in splenic CD4+ tTreg versus CD4+ Tconv cell repertoires of 2-week old YAe62β.Foxp3-GFP mice. Data are derived from 4 independent experiments, (d-f) represented as mean fraction of repertoire, (g) bars represent the data geometric mean. (h-k) Centered second order non-linear regression analysis of 11 Padi4- and Add2-specific TCRs comparing the tTreg/Tconv cell frequency bias versus the TCR:self-pMHC (h) on-rate, kon (i) half-life, t1/2 and (j) equilibrium affinity, KD, and (k) the clonal frequency in Foxp3neg CD4SP thymocytes. Correlation plots are based on probable cure fit using Akaike’s Information Criteria, Prism 7.04. R2 values represent goodness of fit analysis. (l-n) Time scale of soluble (l) 5287, 6235, 5290, (m) 4699, 4783, 6239, and (n) 6236, 6256, 6237, 6238 TCRs disassociating from immobilized IAb-Padi4 measured by surface plasmon resonance. Sensograms are background subtracted from each TCR interacting with a non-cognate ligand. Data are derived from 4 biological replicates with similar results. (g) Significance identified using a Kruskal-Wallis test and Dunn’s multiple comparisons test, ***P<0.001, ****P<0.0001.
Figure 8.
Figure 8.
TCRs that promote neonatal negative selection, tTreg differentiation or CD4 Tconv cell development use conventional docking orientations on IAb-Padi4. (a-c) Ribbon diagrams of (a) 6235 (pdb: 6MNO), (b) 4699 (pdb:6MKD) and (c) 6256 (pdb: 6MNM) TCRs binding IAb-Padi4. The 6235 TCR is colored red (TCRβ) and pink (TCRα); the 4699 TCR is colored dark green (TCRβ) and light green (TCRα); The 6256 TCR is colored dark blue (TCRβ) and light blue (TCRα). IAb-Padi4 is colored cyan (IAbα chain), yellow (peptide), and magenta (IAbβ chain). (d-f) Projections of the (d) 6235, (e) 4699 and (f) 6256 TCRs bound to IAb-Padi4. The peptide residues are outlined in black. (g-i) The amount of buried surface area (BSA) of the (g) 6235:IAb-Padi4, (h) 4699:IAb-Padi4 and (i) 6256:IAb-Padi4 complexes contributed by TCRα and TCRβ loops, and the peptide or MHC chains. Figures were made with PyMol. (j) Overlay of 6235, 5287, 4699, 4378, 6256 and 6236 TCRs binding IAb-Padi4. Dashed lines indicate the crossing and incident angles. (k) Plot of the 6235, 5287, 4699, 4378, 6256 and 6236 TCR:IAb-Padi4 crossing and incident angles, compared to 129 human and mouse MHC-I and MHC-II TCR:pMHC complexes, including two iTreg reverse orientation (triangles). (l-q) Van der Waals interactions between the (l) 6235, (m) 4699 and (n) 6256 TCRα chains with the Padi4 P2Y residue, and (o-q) the presence, absence and distance of a hydrogen bond (red dash line) between the CDR3α 94 residue and the Padi4 P2Y hydroxyl moiety. (r, s) Time scale of soluble 6235 (red), 4699 (green) and 6256 (blue) TCRs disassociating from immobilized (r) IAb-Padi4 and (s) IAb-Padi4 p2F measured by surface plasmon resonance. Sensograms are background subtracted from each TCR interacting with a non-cognate IAb-Add2 ligand. SPR data are examples of 4 independent experiments, giving similar results.

Similar articles

Cited by

References

    1. Hogquist KA, Jameson SC. The self-obsession of T cells: how TCR signaling thresholds affect fate ‘decisions’ and effector function. Nat Immunol 2014, 15(9): 815–823. - PMC - PubMed
    1. Klein L, Robey EA, Hsieh CS. Central CD4(+) T cell tolerance: deletion versus regulatory T cell differentiation. Nat Rev Immunol 2019, 19(1): 7–18. - PubMed
    1. Sakaguchi S, Yamaguchi T, Nomura T, Ono M. Regulatory T cells and immune tolerance. Cell 2008, 133(5): 775–787. - PubMed
    1. Yang S, Fujikado N, Kolodin D, Benoist C, Mathis D. Immune tolerance. Regulatory T cells generated early in life play a distinct role in maintaining self-tolerance. Science 2015, 348(6234): 589–594. - PMC - PubMed
    1. Li MO, Rudensky AY. T cell receptor signalling in the control of regulatory T cell differentiation and function. Nat Rev Immunol 2016, 16(4): 220–233. - PMC - PubMed

Publication types