. 2019 Aug;20(8):980-991.
doi: 10.1038/s41590-019-0425-y. Epub 2019 Jun 17.

Subsets of ILC3-ILC1-like cells generate a diversity spectrum of innate lymphoid cells in human mucosal tissues

Affiliations

Subsets of ILC3-ILC1-like cells generate a diversity spectrum of innate lymphoid cells in human mucosal tissues

Marina Cella et al. Nat Immunol. 2019 Aug.

Erratum in

Abstract

Innate lymphoid cells (ILCs) are tissue-resident lymphocytes categorized on the basis of their core regulatory programs and the expression of signature cytokines. Human ILC3s that produce the cytokine interleukin-22 convert into ILC1-like cells that produce interferon-γ in vitro, but whether this conversion occurs in vivo remains unclear. In the present study we found that ILC3s and ILC1s in human tonsils represented the ends of a spectrum that included additional discrete subsets. RNA velocity analysis identified an intermediate ILC3-ILC1 cluster, which had strong directionality toward ILC1s. In humanized mice, the acquisition of ILC1 features by ILC3s showed tissue dependency. Chromatin studies indicated that the transcription factors Aiolos and T-bet cooperated to repress regulatory elements active in ILC3s. A transitional ILC3-ILC1 population was also detected in the human intestine. We conclude that ILC3s undergo conversion into ILC1-like cells in human tissues in vivo, and that tissue factors and Aiolos were required for this process.


Conflict of interest statement

Competing Interests

R.G., S.Z., W.G., J.S., L.-L.L., M.B. and S.A.J. are Pfizer employees. M. Colonna received funding from Pfizer to study ILC biology in Inflammatory Bowel Disease. The other authors declare no conflicts of interests.

Figures

Fig. 1.
Fig. 1.. Identification of ILC3a, ILC3b, ILC1b and ILC1a by flow cytometry.
a (left), Gating strategy to identify ILC3s, intraepithelial ILC1s and putative transitional population based on NKp44 and CD103 expression. A gate was applied on CD56+CD3CD19 cells. Top right, expression of CD300LF and CD196 on NKp44+CD103 cells; P1=ILC3a. Bottom right, expression of CD300LF and CD196 on NKp44+CD103+ cells. P2=ILC3b, P3=ILC1b, P4=ILC1a. One donor representative of 25 tested is presented. b, Percentages of ILC3a, ILC3b, ILC1b and ILC1a populations in children’s inflamed tonsils of different donors (n=25). Data are mean±s.d.
Fig. 2.
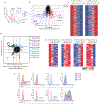
Fig. 2.. Transcriptome analysis places ILC3b and ILC1b between ILC3a and ILC1a.
a, PCA of the ILC subsets using the top 10% most variable genes. Numbers along the axes indicate relative scaling of the principle variables. b, Volcano plot identifying genes significantly (P≤0.05, Student’s t-test) expressed more than twofold in ILC3a versus ILC1a (red) or ILC1a versus ILC3a (blue) (322 and 277 genes, respectively). c, Heat maps representing the relative abundance of genes identified in b across the different ILC subsets. d, Transcripts upregulated in single comparisons between ILC1a/ILC1b and ILC3a/ILC3b or in two comparisons combined together (colors in plot match key). Caption indicates the numbers of transcripts upregulated at least twofold in each comparison. e, Heat maps representing the relative abundance across the ILC subsets of transcripts differentially expressed in ILC3a>ILC3b (first panel on the left), ILC3b<ILC3a (second panel on the left), ILC1a>ILC1b (third panel on the left) or ILC1b<ILC1a (right panel). f, Intracellular content of IL-22 and IFN-γ in ILC3a, ILC3b, ILC1b and ILC1a after short-term in vitro expansion. APC, allophycocyanin; PE, phycoerythrin. One experiment representing two is shown. Data in a, b, c, d, and e are derived from independent biological replicates (ILC3a, n=4; ILC3b, n=3; ILC1b, n=4; ILC1a, n=4).
Fig. 3.
Fig. 3.. Molecules with progressively decreased or increased expression in the ILC3-ILC1 spectrum.
a-c, Heat maps representing the mRNA expression of selected genes across the ILC subsets. Genes were grouped in three categories: cell surface receptors (a); soluble factors and molecules relevant to cytotoxicity (b); transcription factors (c). Each column represents an individual biological replicate. d,e, Flow cytometry validation of cell surface receptors and intracellular molecules (S100a4) gradually decreasing from ILC3a to ILC3b to ILC1b to ILC1a. d, Histograms for one representative donor; e, Mean fluorescent intensity (MFI) in different donors (n=8). f,g, Flow cytometry validation of cell surface receptors and intracellular molecules (CD247) gradually increasing from ILC3a to ILC3b to ILC1b to ILC1a. f, Histograms for one representative donor. g, MFI or percentages of positive cells in different donors (n=6–8). Significance was calculated using an ordinary, one-way analysis of variance (ANOVA), multiple comparison test with Prism v.7 software. *P≤0.05, **P≤0.001, ***P≤0.005, ****P≤0.0001. e, g, Data are mean±s.d.
Fig. 4.
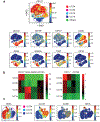
Fig. 4.. Mass spectrometry analysis separates the ILC3-ILC1 spectrum and NK cells.
a, The viSNE analysis of tonsil NKp44+ cells based on 36 selected markers and colored by intensity of expression. Each plot shows expression of the indicated cell surface marker. Populations corresponding to ILC3a, ILC3b, ILC1b and ILC1a are delineated in the CD127 plot. Cell subsets that lack CD103, but express CD94, NKG2A and CD127 are indicated as “Others”. b, Heat maps show graded expression of the indicated markers in the ILC subsets. Two donors analyzed in parallel on the same day are shown for consistency. c, The viSNE map of NKp44+CD103+ cells shows 3 clusters in which the degree of expression of CD127 and CCR6 inversely correlates with that of CD94. The viSNE analysis also identifies a small ILC1 cluster expressing CD16. Data are representative of six donors. Cells were gated based on NKp44 and CD161 (a,b) or NKp44, CD161 and CD103 (c) before running viSNE. Contaminating CD3+CD19+FceR+TREM1+CD14+ cells were excluded by manual gating.
Fig. 5.
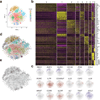
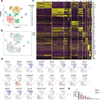
Fig. 5.. The scRNA-seq of the ILC3-ILC1 spectrum identifies an intermediate cluster transitioning to ILC1s.
a, Unsupervised t-SNE analysis of ILC3-ILC1 subsets to define clusters. b, Heat map showing the top ten differentially expressed genes in each cluster. c, The t-SNE of representative ILC3-related or ILC1-related genes. d, e, RNA velocity analysis based on spliced and unspliced mRNAs to predict cell dynamics. One donor representing two is shown.
Fig. 6.
Fig. 6.. Cytokine production in clones derived from ILC3a, ILC3b, ILC1b and ILC1a.
a, IFN-γ and IL-22 production by two of the most represented clones (panels on the left and in the middle) and by one of the least represented clones (panels on the right) derived from ILC3a, ILC3b, ILC1b and ILC1a. b, Percentages of cells producing IL-22 only, IFN-γ + IL-22, or IFN-γ only in each clone tested. Data are mean±s.d. A total of 109 clones was tested (ILC3a=31; ILC3b=25; ILC1b=28; ILC1a=25). One donor representing two is shown. The significance was calculated using ordinary, one-way ANOVA, multiple comparison test using the Prism v.7 software. *P≤0.05, **P≤0.001, ***P≤0.005, ****P≤0.0001.
Fig. 7.
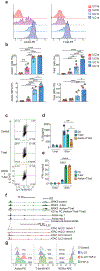
Fig. 7.. Aiolos represses ILC3 lineage genes in cooperation with T-bet.
a, Histograms showing expression of Aiolos and T-bet in ILCa/b subsets ex vivo from one donor that represent six. b, Cumulative data for percentages and MFIs of Aiolos and T-bet expression in different donors. Circles with the same color indicate the same individual (n=6). Data are mean±s.d. Significance was calculated using an ordinary, one-way ANOVA, multiple comparison test with Prism v.7 software. *P≤0.05, **P≤0.001, ***P≤0.005, ****P≤0.0001. c, Intracellular content of IL-22 and IL-17a in control MNK3 cells or MNK3 transduced with T-bet or both Aiolos and T-bet, after stimulation with IL-23 and IL-1b. d, e, Quantification of IL-22 (d) and IFN-γ (e) in culture supernatants of control MNK3 and MNK3 transduced with T-bet, or both Aiolos and T-bet; cells were stimulated with IL-23+IL-1b or a combination of IL-23, IL-12 and IL-18 (n=3). Significance was calculated using an ordinary, one-way ANOVA, multiple comparison test with Prism v.7 software. *P≤0.05, **P≤0.001, ****P≤0.0001. One experiment representing four (c) or two (d, e) is shown. f, UCSC snapshots of the Il22 locus. Tracks represent cut and run for H3K27ac (green, 0–300 RPKM), Aiolos (blue, 0 to 100 RPKM) or ATAC-seq (red, 0 to 100 RPKM). Fold change plots below H3K27ac tracks represent differences between H3K27ac in MNK3 expressing T-bet and both Aiolos and T-bet. Conserved IKZF3 motifs between mouse loci (top snapshots) and human loci (bottom snapshots) are indicated as dashed lines. Relative kilobase scale and gene locations are indicated on top.Two independent cut and run experiments were performed. rep=replicate; ieILC, intraepithelial ILCs. g, TGF-β and IL-23 stimulation induces expression of Aiolos and T-bet while downregulating Rorγt in ILC3a. Numbers indicate MFI. One experiment representing five is shown.
Fig. 8.
Fig. 8.. Identification of ILC clusters in small intestinal lamina propria of controls and CD patients.
a, Unsupervised t-SNE analysis of ILC subsets. ILCs were pooled from two controls and two CD patients with similar number of total cells (2068 control, 1836 CD). b, Color representation of single cells in each cluster based on disease status. c, Heat map showing the top ten differentially expressed genes in each cluster. d, The t-SNE of representative ILC3-related or ILC1-related genes. e, Number of cells detected in each cluster and separated by disease status. Ctr, control.

References

    1. Diefenbach A, Colonna M & Koyasu S Development, differentiation, and diversity of innate lymphoid cells. Immunity 41, 354–365 (2014). - PMC - PubMed
    1. Eberl G, Colonna M, Di Santo JP & McKenzie AN Innate lymphoid cells. Innate lymphoid cells: a new paradigm in immunology. Science 348, aaa6566 (2015). - PMC - PubMed
    1. Klose CS & Artis D Innate lymphoid cells as regulators of immunity, inflammation and tissue homeostasis. Nat. Immunol 17, 765–774 (2016). - PubMed
    1. Ebbo M, Crinier A, Vely F & Vivier E Innate lymphoid cells: major players in inflammatory diseases. Nat. Rev. Immunol 17, 665–678 (2017). - PubMed
    1. Huang Q, Seillet C & Belz GT Shaping Innate Lymphoid Cell Diversity. Front. Immunol 8, 1569 (2017). - PMC - PubMed

Publication types

MeSH terms