. 2019 Jul;411(19):4683-4700.
doi: 10.1007/s00216-019-01885-0. Epub 2019 Jun 17.

Supporting non-target identification by adding hydrogen deuterium exchange MS/MS capabilities to MetFrag

Affiliations

Supporting non-target identification by adding hydrogen deuterium exchange MS/MS capabilities to MetFrag

Christoph Ruttkies et al. Anal Bioanal Chem. 2019 Jul.

Abstract

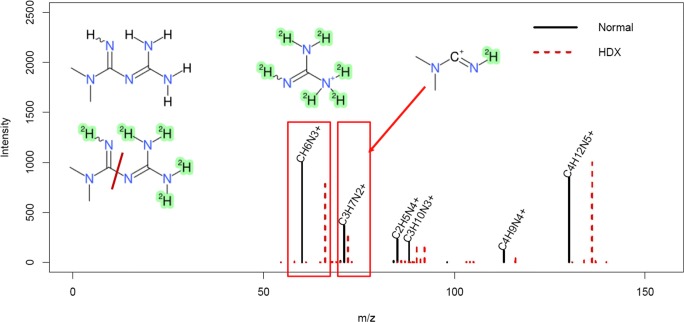
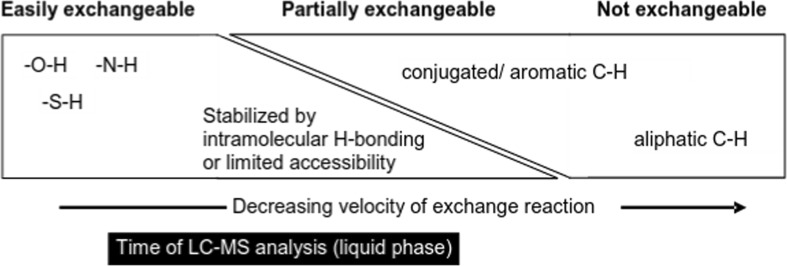
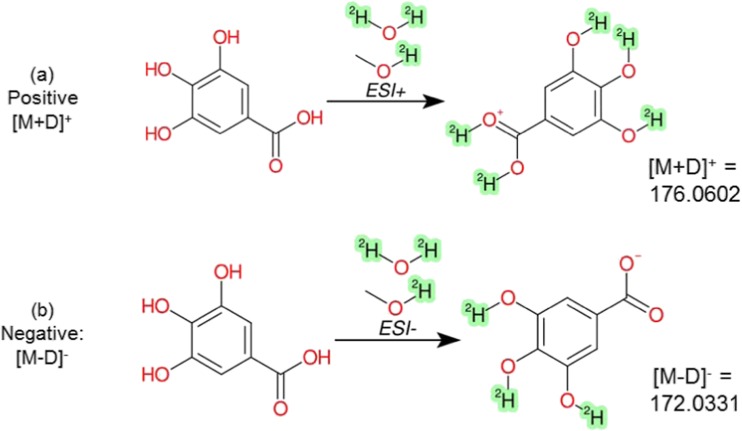
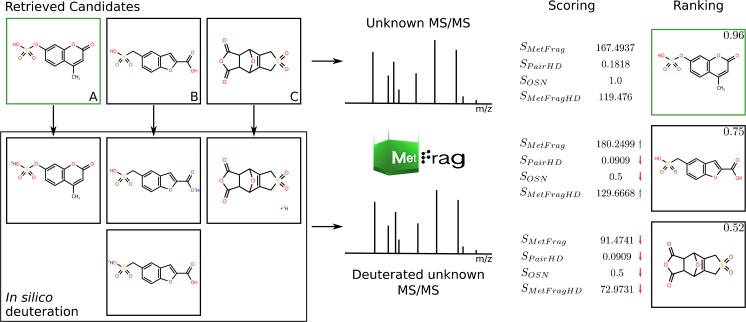
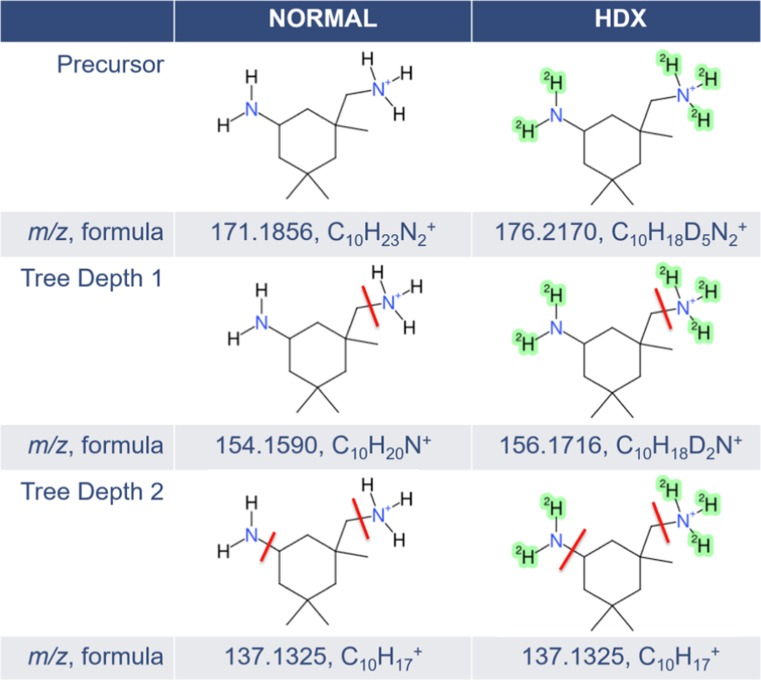
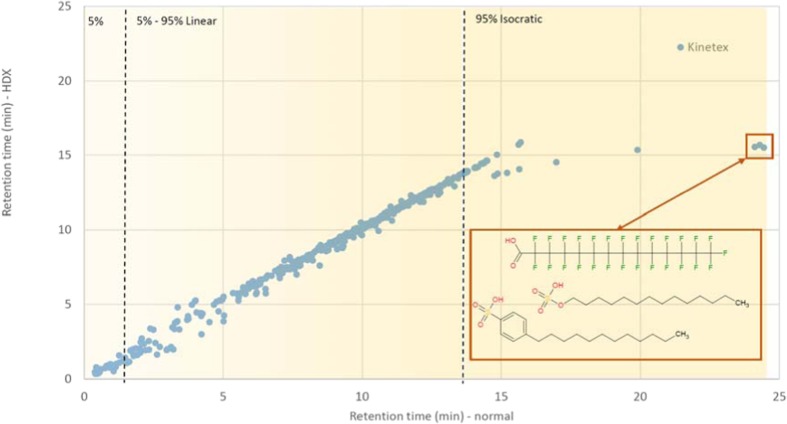
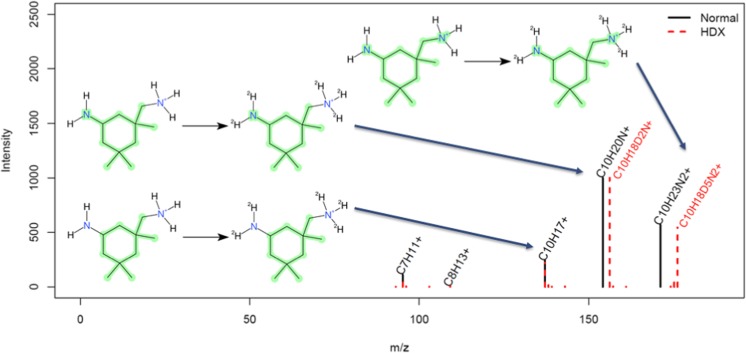
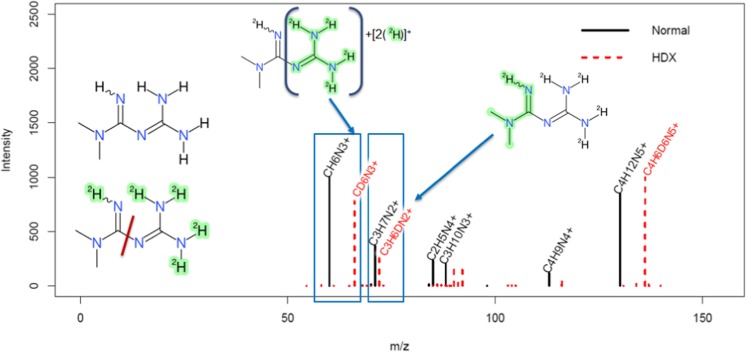
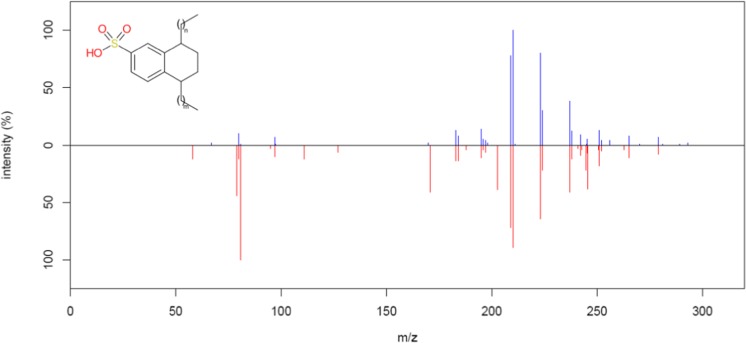
Liquid chromatography coupled with high-resolution mass spectrometry (LC-HRMS) is increasingly popular for the non-targeted exploration of complex samples, where tandem mass spectrometry (MS/MS) is used to characterize the structure of unknown compounds. However, mass spectra do not always contain sufficient information to unequivocally identify the correct structure. This study investigated how much additional information can be gained using hydrogen deuterium exchange (HDX) experiments. The exchange of "easily exchangeable" hydrogen atoms (connected to heteroatoms), with predominantly [M+D]+ ions in positive mode and [M-D]- in negative mode was observed. To enable high-throughput processing, new scoring terms were incorporated into the in silico fragmenter MetFrag. These were initially developed on small datasets and then tested on 762 compounds of environmental interest. Pairs of spectra (normal and deuterated) were found for 593 of these substances (506 positive mode, 155 negative mode spectra). The new scoring terms resulted in 29 additional correct identifications (78 vs 49) for positive mode and an increase in top 10 rankings from 80 to 106 in negative mode. Compounds with dual functionality (polar head group, long apolar tail) exhibited dramatic retention time (RT) shifts of up to several minutes, compared with an average 0.04 min RT shift. For a smaller dataset of 80 metabolites, top 10 rankings improved from 13 to 24 (positive mode, 57 spectra) and from 14 to 31 (negative mode, 63 spectra) when including HDX information. The results of standard measurements were confirmed using targets and tentatively identified surfactant species in an environmental sample collected from the river Danube near Novi Sad (Serbia). The changes to MetFrag have been integrated into the command line version available at http://c-ruttkies.github.io/MetFrag and all resulting spectra and compounds are available in online resources and in the Electronic Supplementary Material (ESM). Graphical abstract.

Keywords: Compound identification; High-resolution mass spectrometry; Hydrogen deuterium exchange; In silico fragmentation; Metabolomics; Structure elucidation.


Conflict of interest statement

The authors declare that they have no conflict of interest.

Figures

None
Graphical abstract
Fig. 1
Fig. 1
Conceptual view of the degree of exchangeability of hydrogens relative to the timescale of LC-MS analysis
Fig. 2
Fig. 2
Example of expected HDX behavior of gallic acid (DTXSID0020650) in the experiment performed here in a positive ESI mode to produce [M+D]+ and b negative ESI mode to produce [M-D], along with the calculated ion masses that were subsequently observed in the experimental measurements. The quadruply deuterated species of gallic acid is available here (DTXSID60892625). Images created using CDK Depict [27] with SMARTS highlighting to indicate the deuterium. Note that while we refer to deuterium as “D” throughout the manuscript for simplicity, the depiction with 2H here is consistent with the standard representation of isotopes and enables the SMARTS-based highlighting shown
Fig. 3
Fig. 3
Workflow for MetFrag to analyze deuterated MS/MS spectra using the example of 4-methylumbelliferyl sulfate (a, green border) of the large standard set. The mass difference of the determined neutral precursor masses of the normal (256.0042 Da) and the deuterated (257.0104 Da) spectrum indicated X = 1, i.e., one exchanged hydrogen as shown for (a).Two additional selected candidates (b, c) illustrate different in silico deuteration cases where the retrieved candidate can result in two deuterated candidates (b) or one candidate of variable deuterium location as no easily exchangeable H is present (c). Processing normal and deuterated candidates with MetFrag-HDX results in four scoring terms for each candidate, which are combined in a consensus score using weight parameters retrieved during the cross-validation (~ 0.109, ~ 0.004, 0.497, ~ 0.39; see Methods; note, scores are normalized to range [0, 1]). This resulted in a top 1 ranking of the correct candidate 4-methylumbelliferyl sulfate. Green and red arrows mark scores that are higher or lower compared to those of the correct candidate. Candidate b is the top scoring candidate using SMetFrag alone (without HDX information). This example illustrates both the workflow and the benefit of the additional scoring terms
Fig. 4
Fig. 4
Modified in silico fragmentation workflow, demonstrated on isophorone diamine (DTXSID6027503). In silico–generated fragments from normal mode (left) are modified by exchanging and adding deuteriums at predicted positions (right, green shading) from the precursor molecule. The normal precursor is used to determine possible positions of hydrogen/deuterium exchange (here the amino groups). This information is used during the in silico fragmentation to perform mass calculation of deuterated fragments (left)
Fig. 5
Fig. 5
Retention time (in minutes) of all (unique) substances detected in normal (x axis) and HDX (y axis) conditions for the substances measured on the Kinetex column (both ESI positive and negative modes). The gradient and percentage of methanol (normal) are marked with yellow highlighting and dashed lines. Examples for the extreme retention time shifts observed are given in the box and in ESM Fig. S4; for explanations, see text
Fig. 6
Fig. 6
Observed normal (black) and HDX (red dashed) MS/MS fragments for isophorone diamine (DTXSID6027503) showing the [M+D]+ ion (shifted by 5 mass units, as expected when 4D are exchanged plus an additional D is gained in ionization), then a NH3/ND3 loss to yield a fragment pair with a 2 mass unit shift, then a subsequent NH2/ND2 loss to yield the identical C10H17+ fragment with no more deuterium present. Images created using CDK Depict; the highlighting indicates the remaining “backbone” of the structure, as represented in MetFrag
Fig. 7
Fig. 7
Metformin (DTXSID2023270) in the Novi Sad sample; black in normal conditions and red dashed as observed under HDX conditions. The shift of the major fragments clearly shows the origins of the fragments (see red line indicating the major “split” in the inset). Green highlighting in the fragments indicates the remaining backbone as represented in MetFrag
Fig. 8
Fig. 8
Head to tail plot of MS/MS fragments from C11-DATS (where m + n = 5) in the Novi Sad sample. Blue: normal; red: HDX fragmentation. As only 1 D can be exchanged, which is lost during ionization, no D is observed in the structure of the ion. Shifts in the peaks in the lower masses are still observed due to the presence of D in the collision cell interacting with the aromatic structure, likely arising from other (deuterated) precursor ions included within the isolation window. Note that the high-intensity precursor peaks (m/z 309.1530) have been excluded from both spectra to allow for better visualization of the fragmentation patterns. A lower intensity (~ 10%) precursor mass of m/z 308.6758 was observed in the full scan data for the HDX measurements, which would have been included in the isolation window for the HDX MS/MS data and could have been the source of deuterium. This mass was only visible at 2% in the MS/MS spectrum

Similar articles

Cited by

References

    1. Frainay C, Schymanski E, Neumann S, Merlet B, Salek R, Jourdan F, Yanes O. Mind the gap: mapping mass spectral databases in genome-scale metabolic networks reveals poorly covered areas. Metabolites. 2018;8:51. doi: 10.3390/metabo8030051. - DOI - PMC - PubMed
    1. Blaženović I, Kind T, Ji J, Fiehn O. Software tools and approaches for compound identification of LC-MS/MS data in metabolomics. Metabolites. 2018;8:31. doi: 10.3390/metabo8020031. - DOI - PMC - PubMed
    1. Freund DM, Hegeman AD. Recent advances in stable isotope-enabled mass spectrometry-based plant metabolomics. Curr Opin Biotechnol. 2017;43:41–48. doi: 10.1016/j.copbio.2016.08.002. - DOI - PubMed
    1. Mahieu NG, Patti GJ. Systems-level annotation of a metabolomics data set reduces 25 000 features to fewer than 1000 unique metabolites. Anal Chem. 2017;89:10397–10406. doi: 10.1021/acs.analchem.7b02380. - DOI - PMC - PubMed
    1. Ruttkies C, Schymanski EL, Wolf S, Hollender J, Neumann S. MetFrag relaunched: incorporating strategies beyond in silico fragmentation. J Cheminform. 2016;8(1):3. doi: 10.1186/s13321-016-0115-9. - DOI - PMC - PubMed

LinkOut - more resources