

Partnership for defining the impact of 12 selected rare CNS tumors: a report from the CBTRUS and the NCI-CONNECT
- PMID: 31209773
- PMCID: PMC8127387
- DOI: 10.1007/s11060-019-03215-x
Partnership for defining the impact of 12 selected rare CNS tumors: a report from the CBTRUS and the NCI-CONNECT
Abstract
Purpose: Population-based cancer statistics, including histology-specific incidence, prevalence, and survival are essential to evaluating the total burden due to disease in a population. The National Cancer Institute's (NCI) Comprehensive Oncology Network Evaluating Rare CNS Tumors (NCI-CONNECT) was developed to better understand tumor biology and patient outcomes for 12 selected brain and other central nervous system (CNS) tumor histologies that are rare in adults to improve approaches to care and treatment. The aim of this study was to determine the incidence, prevalence, and survival of these selected rare histologies.
Methods: Data from the Central Brain Tumor Registry of the United States (CBTRUS) from 2000 to 2014 were used to calculate average annual age-adjusted incidence rates (AAIR) per 100,000 population overall and by sex, race, ethnicity, and age. NCI's Surveillance, Epidemiology and End Results (SEER) data were used to calculate relative survival (RS) estimates. Point prevalence for 2014 was estimated using annual age-specific incidence and survival from CBTRUS and SEER, respectively.
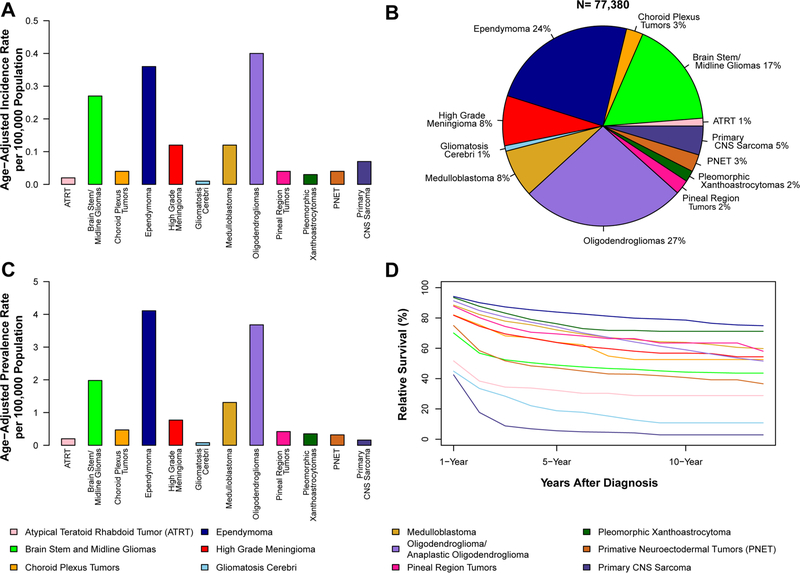
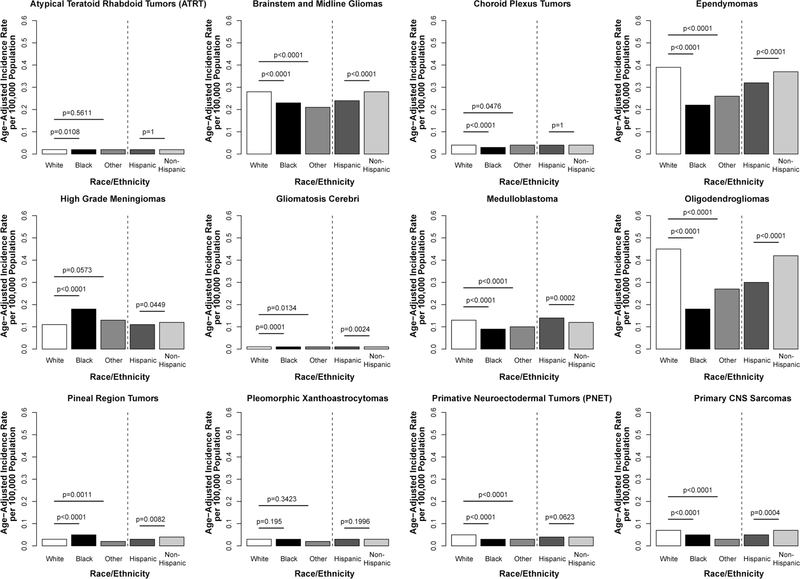
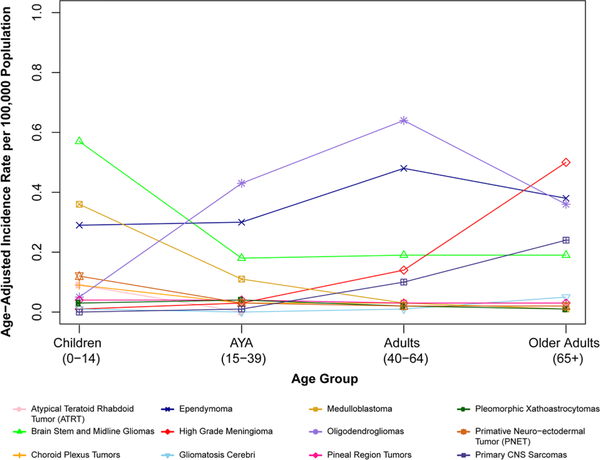
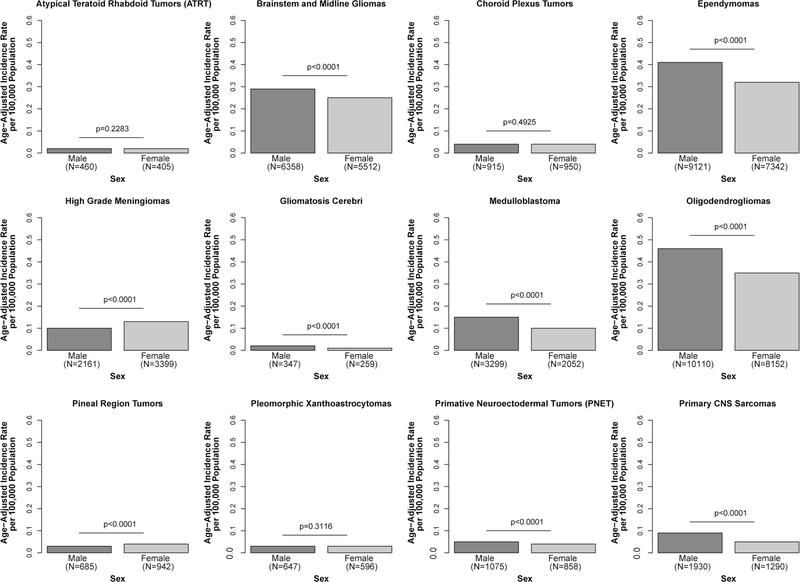
Results: Overall AAIR was 1.47 per 100,000 for all 12 rare histologies combined, with the highest histology-specific incidence in oligodendrogliomas (AAIR = 0.40/100,000). Overall, most histologies were more common in males, adults (age 40 + ), Whites, and non-Hispanics. Ependymomas were the most prevalent histology at 4.11 per 100,000; followed by oligodendrogliomas at 3.68 per 100,000. Relative survival at 1-, 5-, and 10-years was 82.3%, 64.0%, and 55.4%, respectively for all 12 selected brain and other CNS tumor types combined. Ependymomas had the highest RS (1-year = 94.2%, 5-year = 83.9%, 10-year = 78.6%) and gliosarcomas had the lowest relative survival rate (1-year = 42.5%, 5-year = 5.6%, 10-year = 2.9%) at all three time points.
Conclusions: Incidence and prevalence of these rare brain and other CNS tumor histologies have not been previously reported. Along with survival, these data provide a statistical foundation to understand the impact of these cancers and provide important disease-specific data for the design of prospective clinical trials.
Keywords: CNS tumors; Incidence; Prevalence; Rare tumors; Survival.
Conflict of interest statement
Figures
References
-
- Louis DNOH, Wiestler OD, Cavanee WK (eds) (2016) WHO classification of tumours of the central nervous system. International Agency for Research on Cancer, Lyon, France
-
- Surveillance E, and End Results (SEER) Program (2000–2014) SEER*Stat Database: Incidence - SEER 18 Regs Research Data + Hurricane Katrina Impacted Louisiana Cases, Nov 2016 Sub (2000–2014) <Katrina/Rita Population Adjustment> In: National Cancer Institute D, Surveillance Research Program; (ed).
-
- Fay MP (1999) Approximate confidence intervals for rate ratios from directly standardized rates with sparse data. Commun Stat Theory Methods 28:2141–2160. 10.1080/03610929908832411 - DOI
-
- Fay MP, Tiwari RC, Feuer EJ, Zhaohui Z (2006) Estimating average annual percent change for disease rates without assuming constant change. Biometrics 62:847–854 - PubMed
MeSH terms
Grants and funding
LinkOut - more resources
Full Text Sources
