. 2019 Sep;23(9):6024-6033.
doi: 10.1111/jcmm.14465. Epub 2019 Jun 18.

LncRNA FOXD2-AS1 as a competitive endogenous RNA against miR-150-5p reverses resistance to sorafenib in hepatocellular carcinoma

Affiliations

LncRNA FOXD2-AS1 as a competitive endogenous RNA against miR-150-5p reverses resistance to sorafenib in hepatocellular carcinoma

Chengjun Sui et al. J Cell Mol Med. 2019 Sep.

Abstract

The current study elucidated the role of a long non-coding RNA (lncRNA), FOXD2-AS1, in the pathogenesis of hepatocellular carcinoma (HCC) and the regulatory mechanism underlying FOXD2-AS1/miR-150-5p/transmembrane protein 9 (TMEM9) signalling in HCC. Microarray analysis was used for preliminary screening of candidate lncRNAs in HCC tissues. qRT-PCR and Western blot analyses were used to detect the expression of FOXD2-AS1. Cell proliferation assays, luciferase assay and RNA immunoprecipitation were performed to examine the mechanism by which FOXD2-AS1 mediates sorafenib resistance in HCC cells. FOXD2-AS1 and TMEM9 were significantly decreased and miR-150-5p was increased in SR-HepG2 and SR-HUH7 cells compared with control parental cells. Overexpression of FOXD2-AS1 increased TMEM9 expression and overcame the resistance of SR-HepG2 and SR-HUH7 cells. Conversely, knockdown of FOXD2-AS1 decreased TMEM9 expression and increased the sensitivity of HepG2 and Huh7 cells to sorafenib. Our data also demonstrated that FOXD2-AS1 functioned as a sponge for miR-150-5p to modulate TMEM9 expression. Taken together, our findings revealed that FOXD2-AS1 is an important regulator of TMEM9 and contributed to sorafenib resistance. Thus, FOXD2-AS1 may serve as a therapeutic target against sorafenib resistance in HCC.

Keywords: hepatocellular carcinoma (HCC); long non-coding RNA (lncRNA); pathogenesis; proliferation; resistance; sorafenib.


Conflict of interest statement

The authors declare that they have no competing interests.

Figures

Figure 1
Figure 1
Down‐regulation of FOXD2‐AS1 was correlated with sorafenib resistance in hepatocellular carcinoma (HCC) cells. (A) IC50 values of sorafenib in HCC cells. *P < 0.05, **P < 0.01. (B) Differential expression levels of lncRNAs between SR‐HepG2 and SR‐HUH7 cells were detected by microarray analysis. (C) qRT‐PCR verified 10 differentially expressed lncRNAs in SR‐HepG2 and SR‐HUH7 cells. *P < 0.05, **P < 0.01. (D) The expression profile of differentially expressed lncRNAs was compared by microarray gene chip and qRT‐PCR. (E) The mRNA expression levels of FOXD2‐AS1 in HCC cells. **P < 0.01. (F) qRT‐PCR was performed to detect the expression of FOXD2‐AS1 mRNA in HepG2 and Huh7 cells treated with sorafenib at different doses. *P < 0.05 vs the 0 μmol/L group
Figure 2
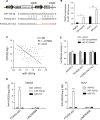
Figure 2
FOXD2‐AS1 directly acts on miR‐150‐5p. (A) Schematic diagram of miR‐150‐5p binding sites in FOXD2‐AS1. (B) qRT‐PCR showed the relative expression of miR‐150‐5p in SR‐HepG2 and SR‐HUH7 cells compared with that in respective parent cells. *P < 0.05,**P < 0.01. (C) Correlation analysis between miR‐150‐5p and FOXD2‐AS1 expression in hepatocellular carcinoma samples (r = −0.7903, P < 0.01). (D) Anti‐AGO2 RIP was performed in HepG2 and HUH7 cells, ***P < 0.001 vs miR‐NC. (E) Luciferase activity in HEK293T cells cotransfected with miR‐150‐5p and pmirGL3, FOXD2‐AS1 or FOXD2‐AS1‐mut. **P < 0.01 vs miR‐NC
Figure 3
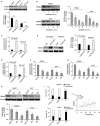
Figure 3
FOXD2‐AS1 regulates TMEM9 expression. (A) TMEM9 expression in HepG2, HUH7, RS‐HepG2 and RS‐HUH7 cells. (B) TMEM9 in HepG2 and HUH7 cells treated with sorafenib. (C) FOXD2‐AS1 expression in SR‐HepG2 and SR‐HUH7 cells 48 h after transfection with lentivirus expressing FOXD2‐AS1 or empty vector. (D,E) TMEM9 expression in SR‐HepG2 and SR‐HUH7 cells overexpressing FOXD2‐AS1. (F) FOXD2‐AS1 expression in HepG2 and Huh7 cells 48 h after shRNA1 or 2. (G‐H) The expressions of TMEM9 in SR‐HepG2 and SR‐HUH7 cells overexpressing FOXD2‐AS1. (I) FOXD2‐AS1 was mainly distributed in the cell cytoplasm. (J) Pearson correlation analysis was conducted to evaluate the correlation between fox FOXD2‐AS1 and TMEM9 mRNA in hepatocellular carcinoma tissue samples. *P < 0.05
Figure 4
Figure 4
FOXD2‐AS1 targets TMEM9 by acting as a ceRNAof miR‐150‐5p. (A) Schematic diagram of miR‐150‐5p binding sites in 3′‐UTR of TEEM9. (B) Luciferase activity in HEK293T cells, **P < 0.01 vs miR‐NC. (C) Plasmids overexpressing WT or Mut FOXD2‐AS1 and luciferase reporter vector containing TMEM9 3′‐UTR or empty vector were cotransfect into SR‐HepG2 and SR‐HUH7 cells. (D‐E) The expression of TMEM9in SR‐HEPG2 and SR‐HUH7 cells transfected with FOXD2‐AS1 or FOXD2‐AS1‐mut plasmids with or without miR‐150‐5p mimics. (F‐G) qRT‐PCR and Western blot detected the expression of TMEM 9 in HepG2 and Huh7 cells transfected with FOXD2‐AS1shRNA1 with or without miR‐150‐5p inhibitor. *P < 0.05. **P < 0.01
Figure 5
Figure 5
FOXD2‐AS1 reverses sorafenib resistance by miR‐150‐5p/TMEM9 axis. (A) TMEM9 in FOXD2‐AS1 overexpressed SR‐HepG2 and SR‐HUH7 cells transfected with TMEM9 siRNA or miR‐150‐5p mimics. (B) IC50 of sorafenib in FOXD2‐AS1‐overexpressing SR‐HepG2 and SR‐HUH7 cells transfected with TMEM9 siRNA or miR‐150‐5p mimics. (C) Apoptosis rates of transfected SR‐HepG2 and SR‐HUH7 cells after treatment with sorafenib for 48 h. *P < 0.05. (D) IC50 of sorafenib in HepG2 and HUH7 cells with FOXD2‐AS1 knockdown transfected with TMEM9‐FLAG plasmid or miR‐150‐5p inhibitor. (E) Apoptosis rates of transfected HepG2 and Huh7 cells after sorafenib treatment. *P < 0.05, **P < 0.01
Figure 6
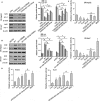
Figure 6
FOXD2‐AS1 regulates Nrf2 signalling pathway. (A) Nrf2 and HO‐1 in FOXD2‐AS1‐overexpressing cells transfected with TMEM9 siRNA or miR‐150‐5p mimics. *P < 0.05 vs Con for Nrf2 comparison; # P < 0.05 vs Con for HO‐1 comparison. (B) The expression levels of Nrf2 and HO‐1 in FOXD2‐AS1‐silencing cells transfected with TMEM9‐FLAG plasmid or miR‐150‐5p inhibitor. *P < 0.05 vs Con for Nrf2 comparison; # P < 0.05 vs Con for HO‐1 comparison. (C) In the presence or absence of miR‐150‐5p mimics, FOXD2‐AS1 or FOXD2‐AS1‐mut plasmids were transfected into SR‐HepG2 and SR‐Huh7 cells. (D) In the presence or absence of miR‐150‐5p inhibitor, shRNA‐FOXD2‐AS1 or FOXD2‐AS1‐mut plasmids were transiently transfected into HEPG2 and HUH7 cells; *P < 0.05 vs the 0 μmol/L group, ΔP<0.05 compared with the 20 μmol/L group

Similar articles

Cited by

References

    1. Ng KT, Lo CM, Guo DY, et al. Identification of transmembrane protein 98 as a novel chemoresistance‐conferring gene in hepatocellular carcinoma. Mol Cancer Ther. 2014;13:1285‐1297. - PubMed
    1. Pogribny IP, Rusyn I. Role of epigenetic aberrations in the development and progression of human hepatocellular carcinoma. Cancer Lett. 2014;342:223‐230. - PMC - PubMed
    1. Deng Y, Du Y, Zhang Q, Han X, Cao G. Human cytidine deaminases facilitate hepatitis B virus evolution and link inflammation and hepatocellular carcinoma. Cancer Lett. 2014;343:161‐171. - PubMed
    1. Yu C, Wang Z, Xu X, Xiang W, Huang X. Circulating hepatocellular carcinoma cells are characterized by CXCR4 and MMP26. Cell Physiol Biochem. 2015;36:2393‐2402. - PubMed
    1. Zhu H, Zhou X, Ma C, et al. Low expression of miR‐448 induces EMT and promotes invasion by regulating ROCK2 in hepatocellular carcinoma. Cell Physiol Biochem. 2015;36:487‐498. - PubMed

Publication types

MeSH terms