. 2019 Sep;12(5):946-961.
doi: 10.1111/1751-7915.13447. Epub 2019 Jun 18.

Expression fusion immunogen by live attenuated Escherichia coli against enterotoxins infection in mice

Affiliations

Expression fusion immunogen by live attenuated Escherichia coli against enterotoxins infection in mice

Ni Feng et al. Microb Biotechnol. 2019 Sep.

Abstract

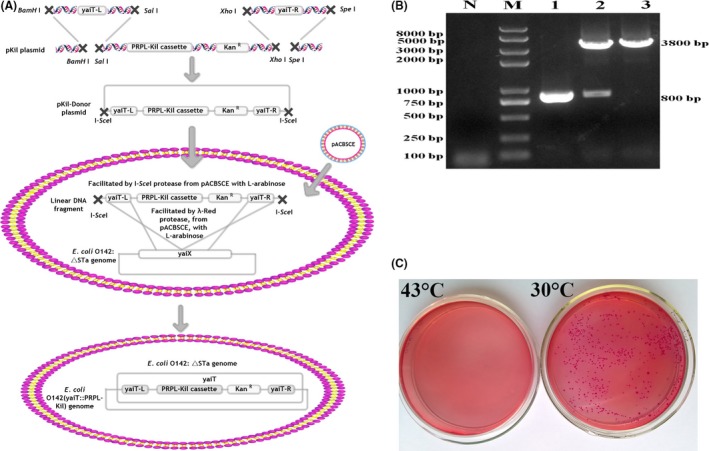
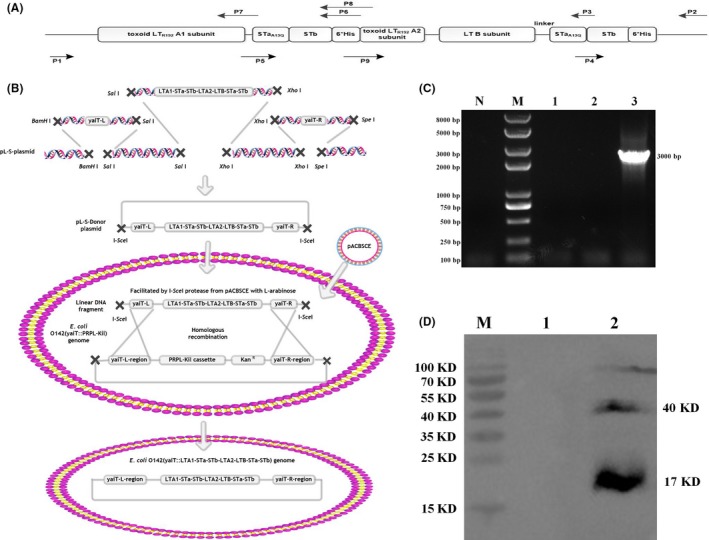
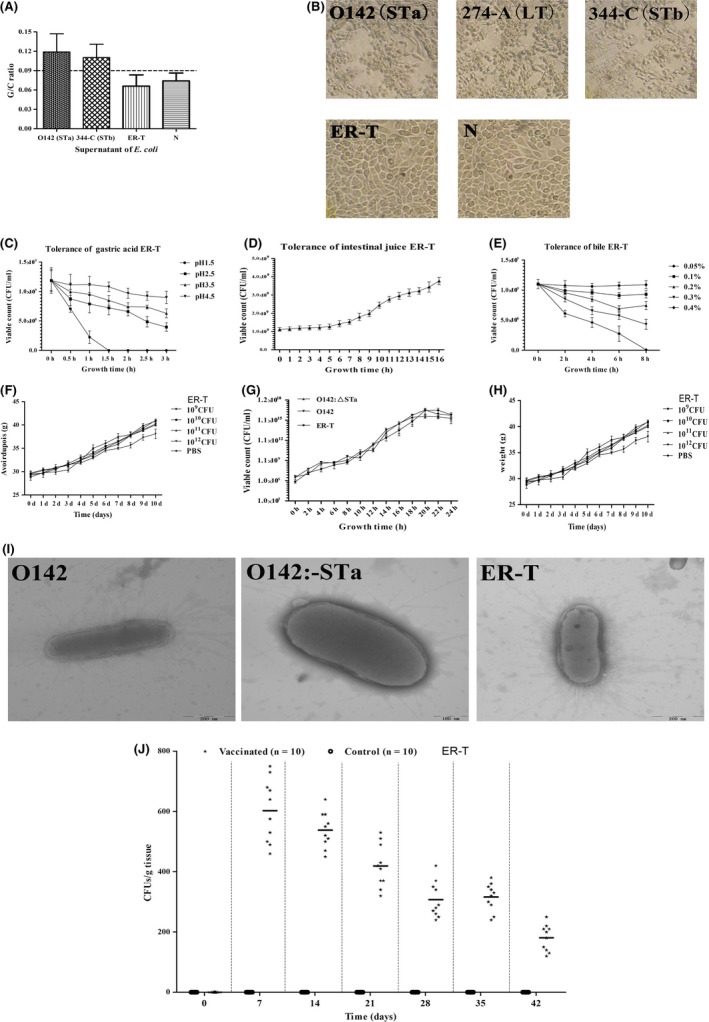
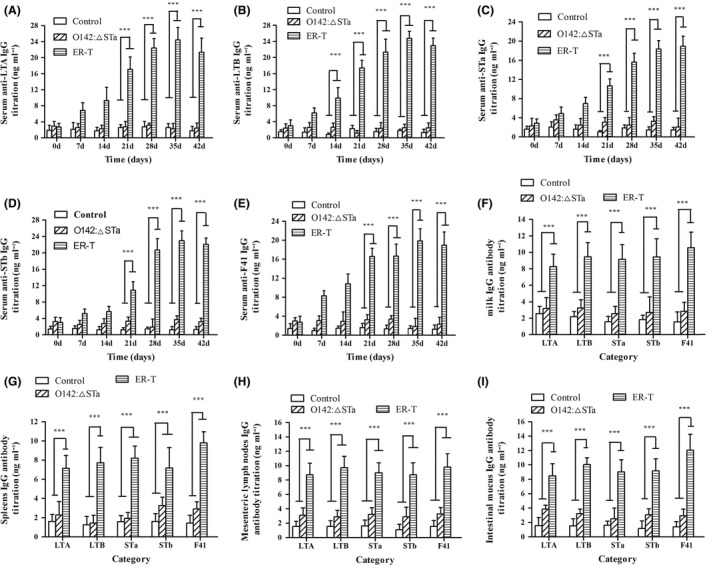
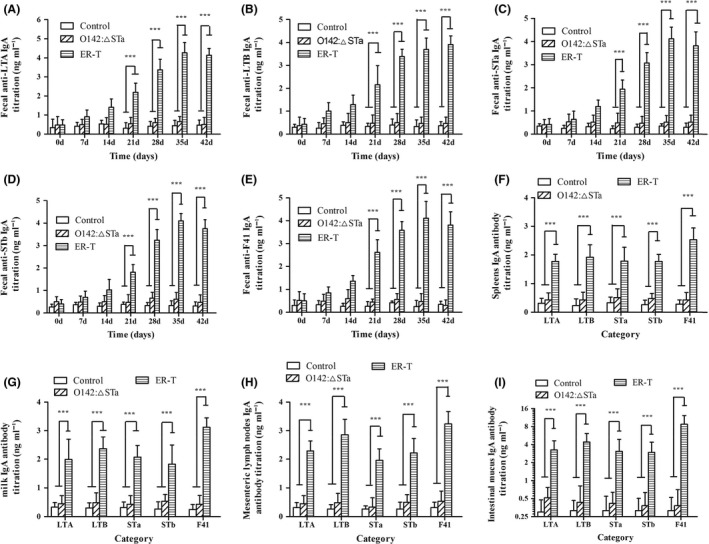
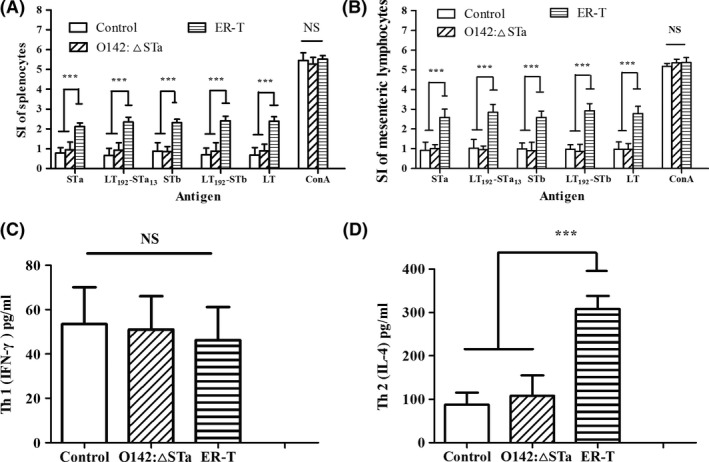
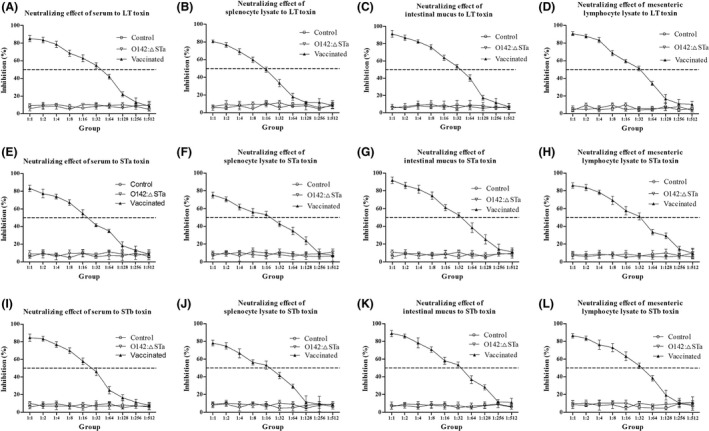
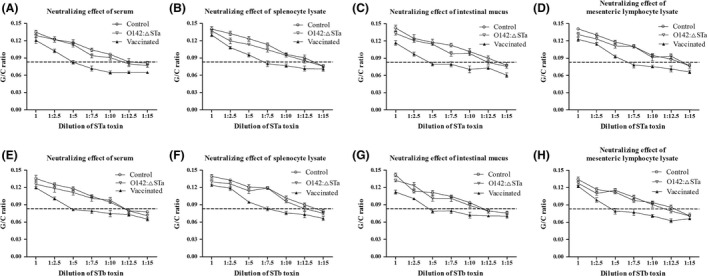
Previous epidemiological studies have shown that enterotoxins from enterotoxigenic Escherichia coli (ETEC) appear to be the most important causes of neonatal piglet and porcine post-weaning diarrhoea (PWD). Thus, it is necessary to develop an effective vaccine against ETEC infection. In the present study, the Kil cassette was inserted into the pseudogene yaiT by homologous recombination to create an attenuated E. coli double selection platform O142(yaiT-Kil). After that, PRPL-Kil was replaced with a fusion gene (LTA1-STa13 -STb-LTA2-LTB-STa13 -STb) to establish oral vaccines O142(yaiT::LTA1-STa13 -STb-LTA2-LTB-STa13 -STb) (ER-T). Subsequently, BALB/c mice were orally immunized with ER-T. Results showed that serum IgG and faecal sIgA responded against all ETEC enterotoxins and induced F41 antibody in BALB/c mice by orogastrically inoculation with recombinant E. coli ER-T. Moreover, the determination of cellular immune response demonstrated that the stimulation index (SI) was significantly higher in immunized mice than in control mice, and a clear trend in the helper T-cell (Th) response was Th2-cell (IL-4) exceed Th1-cell (IFN-γ).Our results indicated that recombinant E. coli ER-T provides effective protection against ETEC infection.


Conflict of interest statement

None declared.

Figures

Figure 1
Figure 1
The schematic outline of the recombinant strategy for constructing the double selection platform. Panel A. Construction of the double selection platform O142(yaiT::PRPL‐Kil) by homologous recombination. The pKil‐donor plasmid and the pACBSCE plasmid are co‐transformed into the Attenuated E. coli O142:△STa. L‐arabinose induction promotes expression of the I‐SceI recombinase system and the λ‐Red endonuclease. I‐SceI generates a linear DNA fragment from the pKil‐donor plasmid that is a substrate for recombination with the pseudogene mediated by the λ‐Red system. Panel B. PCR analysis of chromosomal DNA from double selection platform O142(yaiT::PRPL‐Kil) by using the primers T1 and T4. N: PCR negative control; M: molecular size marker; 1: PCR product of E. coli O142: △STa; 2: PCR product of O142: △STa/pKil‐donor; 3: PCR product of O142(yaiT::PRPL‐Kil). Panel C. Inversion screen test of the double selection platform. a: O142(yaiT::PRPL‐Kil) incubated at 43°C, cannot grow on MacConkey agar plates; b: O142(yaiT::PRPL‐Kil) incubated at 30°C, grown normally.
Figure 2
Figure 2
The schematic outline of the recombinant strategy for constructing the recombinant E. coli O142(yaiT::LTA1‐STa13‐STb‐LTA2‐LTBSTa13‐STb) for oral vaccine candidate. Panel A. The full‐length porcine LT192 operon was used conjugate with LT192, STa13, STb for generating LTA1‐STa13‐STb‐LTA2‐LTBSTa13‐STb fusion antigen and the native LT promoter was retained which expressed without induction. PCR primers P1 and P2 amplified the entire LT cassette including the native LT promoter and terminator. Primers P2 paired with P4 amplified the STa13‐6 × His‐terminator chimeric gene. Primers A1 and A7 mutated the LT gene for LT192. Panel B. Construction of the recombinant E. coli O142(yaiT::LTA1‐STa13‐STb‐LTA2‐LTBSTa13‐STb) according to Gene Doctoring method. The pL‐S‐donor plasmid and the recombineering plasmid pACBSCE are co‐transformed into the double selection platform. Arabinose induction promotes expression of the λ‐Red gene products and I‐SceI. I‐SceI cleaves the pL‐S‐donor plasmid resulting in generation of the linear DNA fragment for λ‐Red mediated recombination to generate the recombinant E. coli O142(yaiT:: LTA1‐STa13‐STb‐LTA2‐LTBSTa13‐STb). Panel C. PCR reaction for the verifying of the recombinant E. coli strain ER‐T by using the primers yaiT‐L‐arm and P2. M: molecular size marker; N: PCR negative control; 1: PCR product of E. coli O142: △STa; 2: PCR product of O142(yaiT::PRPL‐Kil); 3: PCR product of ER‐T. Panel D. Detection of the LTA1‐STa13‐STb‐LTA2‐LTBSTa13‐STb fusion protein in the Western blot assay. anti‐His (ZSGBBIO Co.; 1:500) were used as primary antibody and secondary antibody by (HRP)‐conjugated goat anti‐mouse IgG (ZSGBBIO Co.; 1:2000), development following the manufacturer's instructions of ECL Plus Reagent Kit (7 Sea Biotech, China) M: Protein marker; 1: E. coli O142: △STa as the negative control; 2: E. coli ER‐T.
Figure 3
Figure 3
Feasibility of recombinant E. coli ER‐T for oral vaccine candidate. Panel A. Suckling mice assay for identifying the toxicity of ER‐T. The toxicity of ER‐T was eliminated. Panel B. ZYMDIEC02 cells inoculated with supernatant of E. coli. a: cells inoculated with supernatant of O142 showed significant cell death; b: cells inoculated with supernatant of 274‐A showed significant cell death; c: cells inoculated with supernatant of 344‐C showed significant cell death; d: cells inoculated with supernatant of ER‐T grew normally; e: non‐treated cells grew normally. Panel C. The gastric acid tolerance of ER‐T, from using the plate method to enumerate the amounts of ER‐T that survived in different pH levels of gastric acid. Panel D. The intestinal juice tolerance of ER‐T, from using the plate method to enumerate the amounts of ER‐T. Panel E. The bile tolerance of ER‐T, from using the plate method to enumerate the amounts of ER‐T that survived in different pH concentrations of bile. Panel F. The daily appetite of mice orally fed with ER‐T. Panel G. The growth curve of ER‐T. Fed ER‐T was determined by the number of CFU at the time points indicated. Panel H. The change of avoirdupois in mice orally fed with ER‐T. Panel I. Electron microscope observations of the structure of fimbriae of E. coli O142, O142: △STa, ER‐T, (magnification 30 000×). Panel J. Colonization efficacy of ER‐T in intestinal tracts of mice. Mean values are shown, and error bars represent standard deviations.
Figure 4
Figure 4
ELISA analysis of sera IgG from mice inoculated intragastrically with ER‐T. A. IgG‐specific of anti‐LTA in the serum. B. IgG‐specific of anti‐LTB in the serum. C. IgG‐specific of anti‐STa in the serum. D. IgG‐specific of anti‐STb in the serum. E. IgG‐specific of anti‐F41 in the serum. F. IgG‐specific in the milk samples. G. IgG‐specific in the spleen samples. H. IgG‐specific in the mesenteric lymph node samples. I. IgG‐specific in the intestinal mucus samples. Because LTA1‐STa13‐STb‐LTA2‐LTBSTa13‐STb insertion causes ER‐T systemic antibody responses have a slight advantage. Error bars represent standard deviations, and mean values are shown. *< 0.05; **< 0.01; ***< 0.001.
Figure 5
Figure 5
ELISA analysis of faecal IgA from mice inoculated intragastrically with ER‐T. A. IgA‐specific of anti‐LTA in the faecal. B. IgA‐specific of anti‐LTB in the faecal. C. IgA‐specific of anti‐STa in the faecal. D. IgA‐specific of anti‐STb in the faecal. E. IgA‐specific of anti‐F41 in the faecal. F. IgA‐specific in the spleen samples. G. IgA‐specific in the milk samples. H. IgA‐specific in the mesenteric lymph node samples. I. IgA‐specific in the intestinal mucus samples. ER‐T mucosal antibody responses are stronger by inserting foreign genes into pseudogenes. Error bars represent standard deviations, and mean values are shown. *< 0.05; **< 0.01; ***< 0.001.
Figure 6
Figure 6
Characterization of lymphocyte and cytokines proliferation responses in mice by orally administered ER‐T. A. Splenocyte samples stimulated with different purified antigens by MTT method. B. Mesenteric lymphocyte samples stimulated with different purified antigens by MTT method. C. The levels of IFN‐γ concentration in the culture supernatant were measured by ELISA. D. The levels of IL‐4 concentration in the culture supernatant were measured by ELISA. Error bars represent standard deviations, and mean values are shown. *< 0.05; **< 0.01; ***< 0.001.
Figure 7
Figure 7
In vitro neutralization assays of samples from group ER‐T neutralized to LT, STa and STb toxin. A–D. Serum, splenocyte lysate, intestinal mucus and mesenteric lymphocyte lysate from immunized mice showed neutralization efficiency to LT toxin when compared with that from control mice. E–H. Serum, splenocyte lysate, intestinal mucus and mesenteric lymphocyte lysate from immunized mice showed neutralization efficiency to STa toxin when compared with that from control mice. I–L. Serum, splenocyte lysate, intestinal mucus and mesenteric lymphocyte lysate from immunized mice showed neutralization efficiency to STb toxin when compared with that from control mice. The ratios on the figure are the dilution gradient of toxins, the immune mice produced antibodies that protected ZYMDIEC02 cells (cell death < 50%), the control group did not protect ZYMDIEC02 cells.
Figure 8
Figure 8
Enterotoxins neutralization assay with suckling mice, samples from ER‐T mix with serially diluted toxins STa and STb respectively. A. Serum neutralization of STa toxin activity compared with control and E. coli O142: △STa mice. B. Splenocyte lysate neutralization of STa toxin activity compared with control and E. coli O142: △STa mice. C. Intestinal mucus neutralization of STa toxin activity compared with control and E. coli O142: △STa mice. D. Mesenteric lymphocyte lysate neutralization of STa toxin activity compared with control and E. coli O142: △STa mice. E. Serum neutralization of STb toxin activity compared with control and E. coli O142: △STa mice. F. Splenocyte lysate neutralization of STb toxin activity compared with control and E. coli O142: △STa mice. G. Intestinal mucus neutralization of STb toxin activity compared with control and E. coli O142: △STa mice. H. Mesenteric lymphocyte lysate neutralization of STb toxin activity compared with control and E. coli O142: △STa mice. Samples from control and E. coli O142: △STa suckling mice resisted 1:15 dilution of the toxin, ER‐T resistant to 1:5 dilution of toxins. Experimental results show that recombinant ER‐T has certain ability to protect suckling mice. Error bars represent standard deviations, and mean values are shown.
Figure 9
Figure 9
In vivo neutralization assays using milk‐immunized suckling mice ER‐T challenge with STa and STb toxin in serial dilutions respectively. A. The group of ER‐T G/C ratios challenged with STa toxin negative value at 1:20 dilution below than that of control. B. The group of ER‐T G/C ratios challenged with STb toxin negative value at 1:15 dilution below than that of control. Error bars represent standard deviations, and mean values are shown.

Similar articles

Cited by

References

    1. Ascon, M.A. , Hone, D.M. , Walters, N. , and Pascual, D.W. (1998) Oral immunization with a Salmonella typhimurium vaccine vector expressing recombinant enterotoxigenic Escherichia coli K99 fimbriae elicits elevated antibody titers for protective immunity. Infect Immun 66: 5470–5476. - PMC - PubMed
    1. Balakirev, E.S. , and Ayala, F.J. (2003) Pseudogenes: are they “junk” or functional DNA? Annu Rev Genet 37: 123–151. - PubMed
    1. Bischoff, K.M. , White, D.G. , McDermott, P.F. , Zhao, S. , Gaines, S. , Maurer, J.J. , and Nisbet, D.J. (2002) Characterization of chloramphenicol resistance in beta‐hemolytic Escherichia coli associated with diarrhea in neonatal swine. J Clin Microbiol 40: 389–394. - PMC - PubMed
    1. Blanco, M. , Blanco, J.E. , Gonzalez, E.A. , Mora, A. , Jansen, W. , Gomes, T.A. , et al (1997) Genes coding for enterotoxins and verotoxins in porcine Escherichia coli strains belonging to different O:K: H serotypes: relationship with toxic phenotypes. J Clin Microbiol 35: 2958–2963. - PMC - PubMed
    1. Charles, I. , and Dougan, G. (1990) Gene expression and the development of live enteric vaccines. Trends Biotechnol 8: 117–121. - PubMed

Publication types

MeSH terms

Associated data