. 2019 Jun 18:8:e45421.
doi: 10.7554/eLife.45421.

A FRET sensor of C-terminal movement reveals VRAC activation by plasma membrane DAG signaling rather than ionic strength

Affiliations

A FRET sensor of C-terminal movement reveals VRAC activation by plasma membrane DAG signaling rather than ionic strength

Benjamin König et al. Elife. .

Abstract

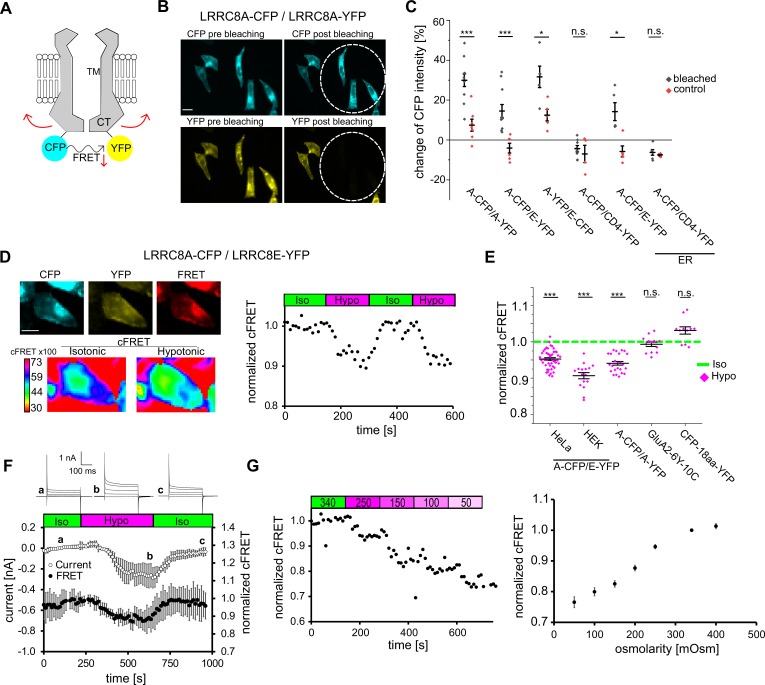
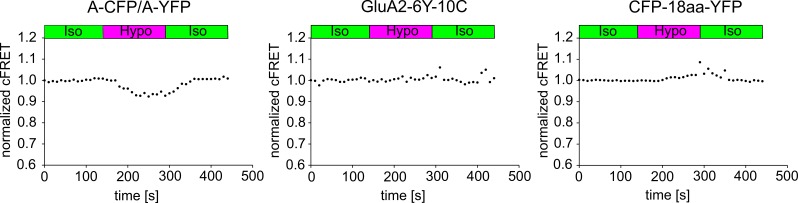
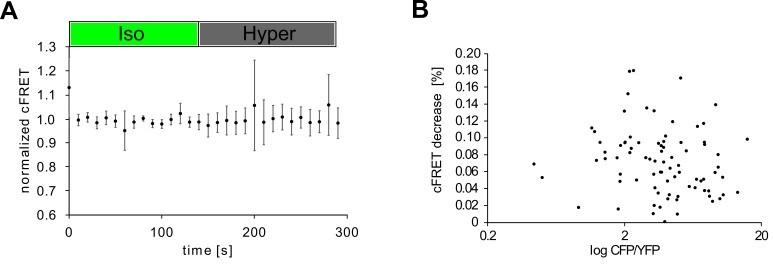
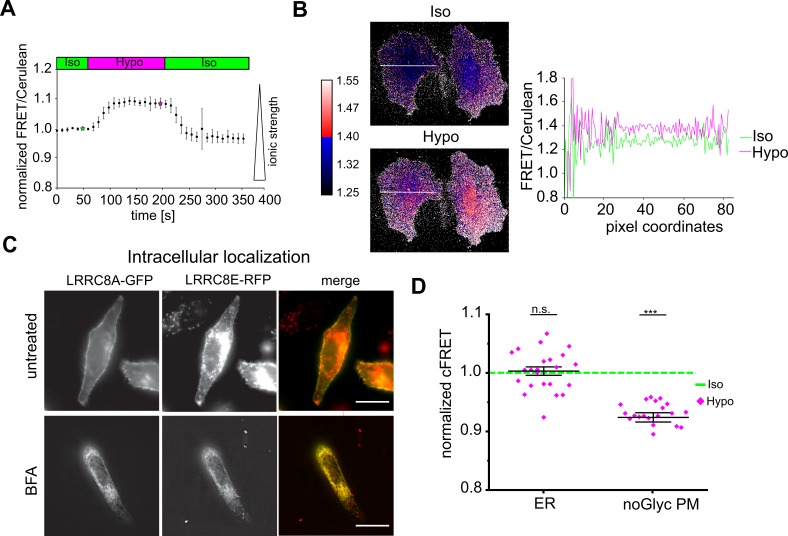
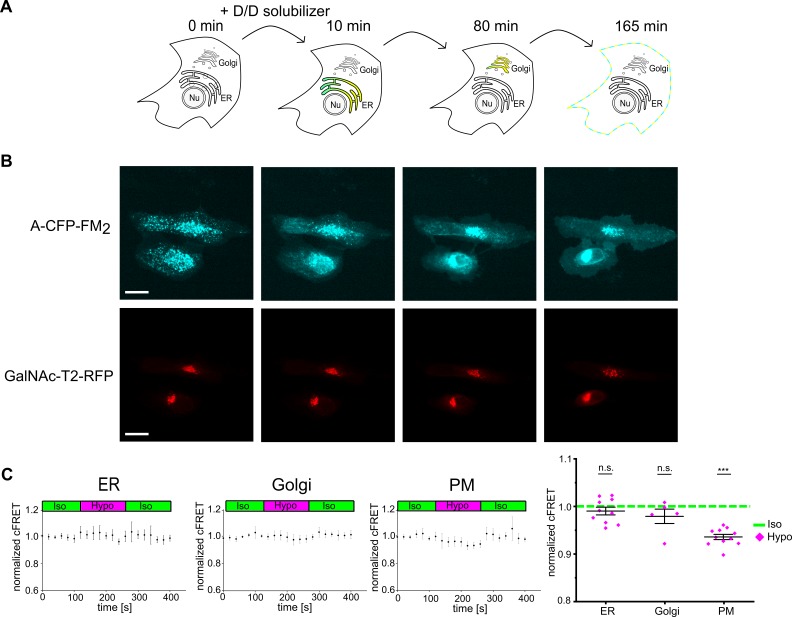
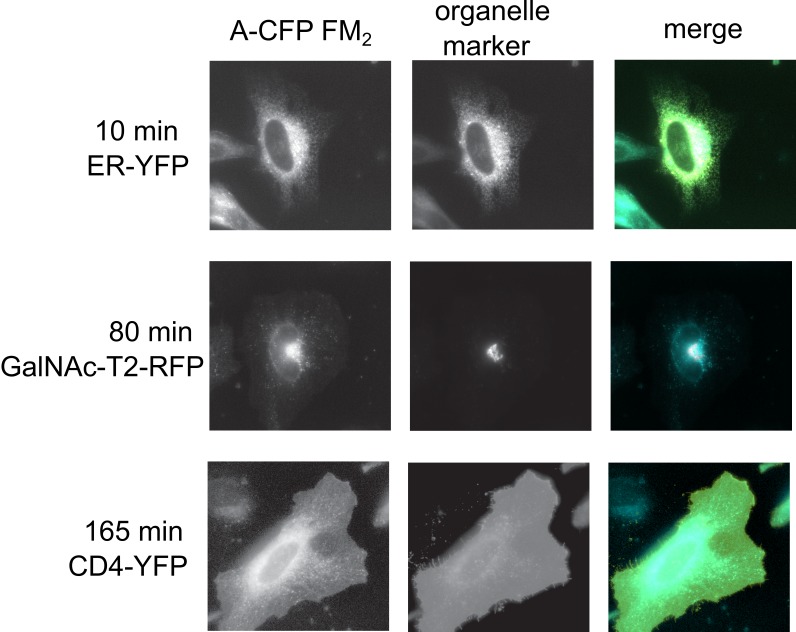
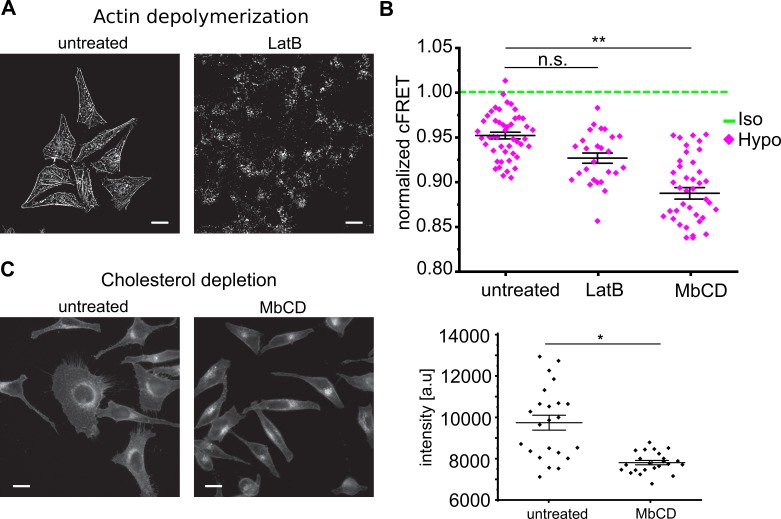
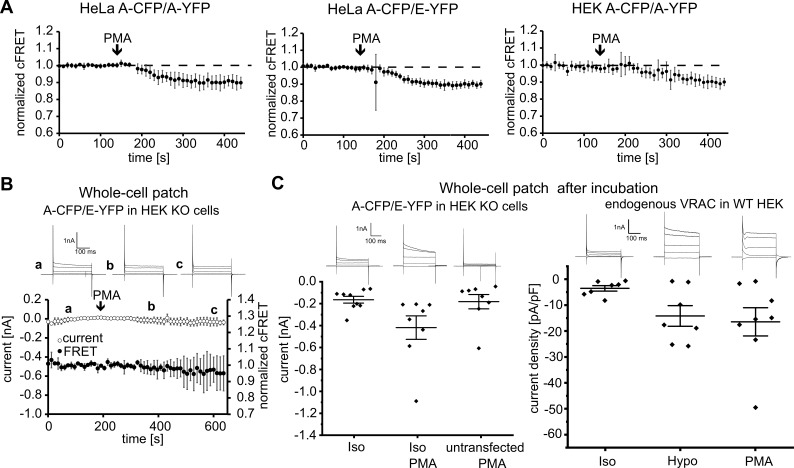
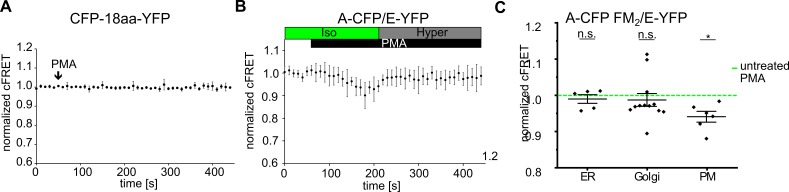
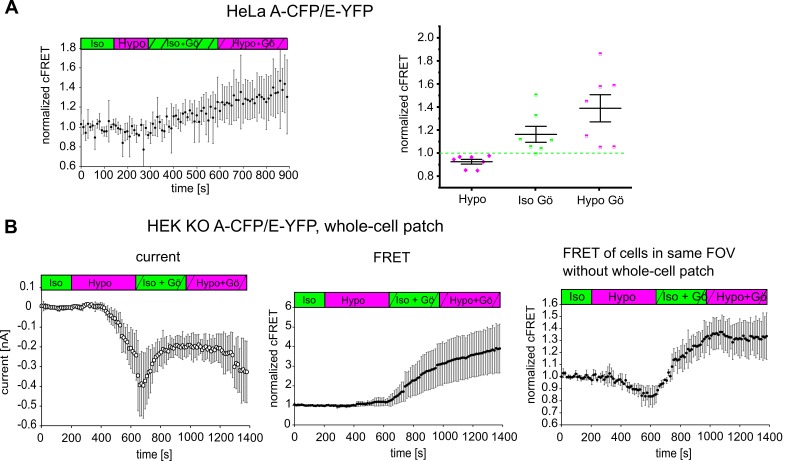
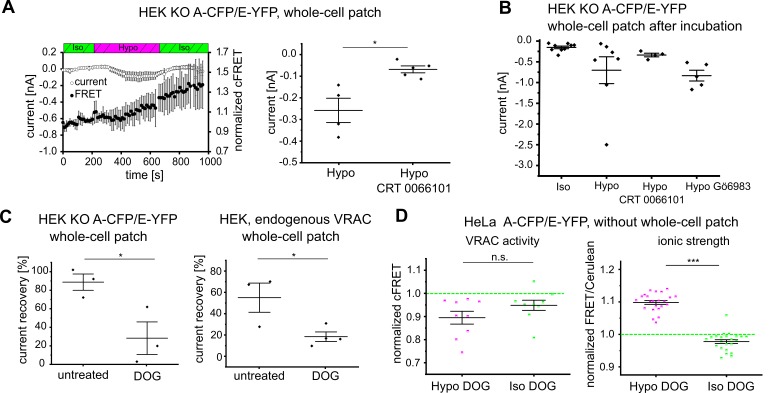
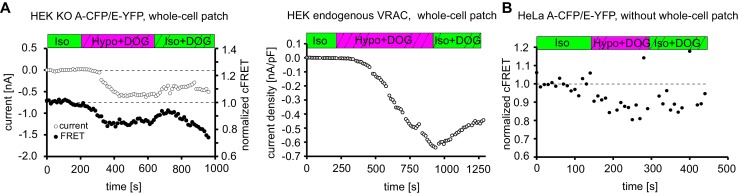
Volume-regulated anion channels (VRACs) are central to cell volume regulation. Recently identified as hetero-hexamers formed by LRRC8 proteins, their activation mechanism remains elusive. Here, we measured Förster resonance energy transfer (FRET) between fluorescent proteins fused to the C-termini of LRRC8 subunits. Inter-subunit FRET from LRRC8 complexes tracked VRAC activation. With patch-clamp fluorometry, we confirmed that the cytoplasmic domains rearrange during VRAC opening. With these FRET reporters, we determined VRAC activation, non-invasively, in live cells and their subcompartments. Reduced intracellular ionic strength did not directly activate VRACs, and VRACs were not activated on endomembranes. Instead, pharmacological manipulation of diacylglycerol (DAG), and protein kinase D (PKD) activity, activated or inhibited plasma membrane-localized VRACs. Finally, we resolved previous contradictory reports concerning VRAC activation, using FRET to detect robust activation by PMA that was absent during whole-cell patch clamp. Overall, non-invasive VRAC measurement by FRET is an essential tool for unraveling its activation mechanism.

Keywords: FRET; LRRC8 heteromer; VSOR; cell biology; channel gating; human; ionic strength; molecular biophysics; structural biology; volume regulation.


Conflict of interest statement

BK, YH, SS, AP, TS No competing interests declared

Figures

Figure 1.
Figure 1.. FRET between fluorescent proteins fused to LRRC8 C-termini and its changes with VRAC activity.
(A) Schematic view of two VRAC subunits of a hexamer fused with the FRET pair CFP and YFP at their C-termini. Hypothetical movement of the intracellular C-terminal domain leads to FRET changes. (B) Wide-field images of HeLa cells expressing A-CFP/A-YFP before and after bleaching YFP. White circles indicate the size of the closed field diaphragm to bleach this part of the FOV. Scale bar, 20 µm. (C) Quantification of acceptor photo-bleach experiments. For each experiment, CFP intensity was measured before and after bleaching for individual cells within (bleached, black diamonds) and outside (control, red diamonds) of the bleached part of the FOV. ER: overexpressed proteins were trapped in the endoplasmic reticulum by 5 µg/ml BFA during expression. Data represent percentage of CFP intensity change for individual cells (diamonds) and mean ± s.e.m. (D) Representation of an seFRET experiment with an A-CFP/E-YFP-expressing cell. Left: images of the acquired channels (donor CFP, acceptor YFP, FRET) with the calculated cFRET map for two time points in isotonic and hypotonic buffer below. Scale bar, 10 µm. Images were acquired in 10 s intervals with 8 × 8 binning. Right: normalized cFRET values during buffer exchange experiment. (E) Measurements of cFRET, normalized to the value in isotonic buffer, when switching to hypotonic buffer for cells expressing A-CFP/E-YFP (n = 9 dishes with 47 HeLa cells; n = 8 with 29 HEK293 cells), A-CFP/A-YFP (n = 8, 24 HeLa cells), glutamate receptor GluA2-6Y-10C (n = 4, 13 HEK293 cells) and CFP-18aa-YFP (n = 4, 11 HeLa cells). Data represent individual cells (diamonds) and mean ± s.e.m. (F) Simultaneous measurements of whole-cell current at −80 mV (open circles) and normalized cFRET values (solid circles) during buffer exchange experiment with A-CFP/E-YFP-expressing HEK293 KO cells. Data represent mean of 4 cells ± s.d. Above, representative current traces from voltage-step protocols at the indicated time points (a, b, c). (G) Left: normalized cFRET in a time-course for a single cell with application of decreasing osmolarities (as indicated above in mOsm). Right: summary of experiments with different osmolarity steps to cover the titration curve from 50 to 400 mOsm. In total, 68 cells were measured for the titration curve, n = 7–21 depending on osmolarity. Data represent mean ± s.e.m. Statistics: *p<0.05; ***p<0.0005; n.s., not significant, Student’s t-test, comparing bleached and control (C) or hypotonic with isotonic (E).
Figure 1—figure supplement 1.
Figure 1—figure supplement 1.. Representative seFRET measurements during buffer exchange experiments with individual HeLa cells expressing A-CFP/A-YFP or CFP-18aa-YFP and a HEK293 cell expressing GluA2-6Y-10C (out of 24, 13 and 11 cells, respectively, for quantification in Figure 1E). cFRET values for CFP-18aa-YFP and GluA2-6Y-10C are unaffected by hypotonic treatment.
Figure 1—figure supplement 2.
Figure 1—figure supplement 2.. Hypertonicity does not affect FRET; hypotonicity-induced cFRET changes are independent of the A-CFP/E-YFP expression ratio.
(A) Summary of cFRET of HeLa cells expressing A-CFP/E-YFP challenged with hypertonicity (400 mOsm). Data represent mean of 17 cells ± s.d. (B) Relationship between the relative cFRET change (isotonic to hypotonic buffer) and the expression ratio of A-CFP/E-YFP represented by the ratio of their measured fluorescence intensities [a.u.] for 84 cells HeLa cells.
Figure 2.
Figure 2.. Hypotonicity reduces ionic strength over the whole cell, but does not activate intracellular VRACs.
(A) Changes of ionic strength measured in HeLa cells expressing the ratiometric RD sensor during hypotonic treatment. FRET intensity was divided by Cerulean intensity and normalized to basal values, with increasing values corresponding to decreasing ionic strength. Data represent mean of 10 cells ± s.d. (B) Ratio maps of two representative cells in isotonic (green star in panel A) and hypotonic (magenta star in panel A) buffer. Right: intensity profile along the white line shown in the ratio maps. (C) Epifluorescence images of A-GFP and E-RFP in live cells without (top row) and with (bottom row) 5 µg/ml brefeldin-A (BFA) treatment. Images of BFA-treated cells were background-subtracted by rolling-ball algorithm (radius = 50 pixels) and contrast increased by an unsharp mask (sigma = 3, weight = 0.7). Scale bar, 20 µm. (D) Normalized cFRET of A-CFP/E-YFP trapped in the ER by presence of BFA during expression (ER; n = 16 dishes with 23 cells) and AN66A,N83A-CFP/E-YFP without BFA (noGlyc PM; n = 7, 21 cells). Data represent individual cells (diamonds) and mean ± s.e.m. Statistics: ***p<0.0005; n.s., not significant, Student’s t-test, comparing hypotonic with isotonic.
Figure 3.
Figure 3.. Plasma membrane localization is required for VRAC activation.
(A) Scheme depicting the different subcellular localizations of VRACs using the reverse aggregation system. Upon addition of the D/D solubilizer, VRACs carrying FM dimerization domains disaggregate in the ER and travel through the Golgi complex to the plasma membrane. Indicated time points were deduced from experiments shown in (B) and (Figure 3—video 1). (B) Still images of HeLa cells expressing LRRC8A-CFP-FM2 and GalNAcT2-RFP as Golgi marker from Figure 3—video 1 at time points indicated in (A). Scale bar, 20 µm. (C) cFRET measured in HeLa cells expressing A-CFP-FM2/E-YFP. VRACs localizing to the ER (n = 4, 10 cells), Golgi (n = 5, 26 cells) and plasma membrane (PM; n = 5, 11 cells) were measured at 10, 80 and 165 min after addition of D/D solubilizer. Data in time traces represent mean ± s.d. Right: average normalized cFRET in of the first seven time points in isotonic and last three time points in hypotonic buffer. Data represent individual cells (ER, PM) or FOVs (Golgi) and mean ± s.e.m. Statistics: ***p<0.0005; n.s., not significant, Student’s t-test, comparing hypotonic with isotonic.
Figure 3—figure supplement 1.
Figure 3—figure supplement 1.. Trafficking of LRRC8 complexes through the secretory pathway.
Representative fluorescence images of HeLa cells co-expressing LRRC8A-CFP-FM2 (left, cyan in merge) and organelle markers (middle) ER-YFP (top, yellow in merge), GalNAcT2-RFP (middle, red in merge) and CD4-YFP (bottom, yellow in merge) at indicated time points after addition of D/D solubilizer.
Figure 3—figure supplement 2.
Figure 3—figure supplement 2.. Modulation of VRAC activity by the actin cytoskeleton and cholesterol content.
(A) Representative fluorescence images of control HeLa cells treated with 2 µM latrunculin B (LatB) or not (untreated) that were fixed and stained with Alexa Fluor 546-phalloidin. Image of untreated cells was deconvolved using the blind-algorithm package of LAS X. (B) Comparison of cFRET in isotonic and hypotonic buffer of HeLa cells expressing A-CFP/E-YFP and treated with latrunculin B (LatB; n = 8 dishes with 26 cells) as in (A) or methyl-β-cyclodextrin (MbCD; n = 10 dishes with 46 cells) as in (C) with untreated cells (data from Figure 1E). Data represent individual cells (diamonds) and mean ± s.e.m. (C) Left: Representative fluorescence images of control HeLa cells treated with 5 mM methyl-β-cyclodextrin (MbCD) or not (untreated) that were fixed and stained with filipin. Right: filipin fluorescence intensity of untreated and MbCD-treated HeLa cells. n = 5 with over 300 cells per condition, data represent individual FOVs (diamonds) and mean ± s.e.m. Scale bars, 20 µm. Statistics: *p<0.05; **p<0.005; n.s., not significant, Student’s t-test.
Figure 4.
Figure 4.. VRAC activation by PMA.
(A) Addition PMA (1 µM, indicated by arrows) activated VRACs composed of A-CFP/A-YFP (left; 11 cells), A-CFP/E-YFP (middle; 12 cells) in HeLa cells or A-CFP/A-YFP in HEK293 cells (right; 12 cells). Data represent mean ± s.d. (B) Simultaneous measurements of whole-cell current at −80 mV (open circles) and normalized cFRET values (solid circles) in A-CFP/E-YFP-expressing HEK293 KO cells with addition of 1 µM PMA (indicated by arrow). Data represent mean of 3 cells ± s.d. Above, representative current traces from voltage-step protocols at the depicted time points (a, b, c). (C) Whole-cell currents at −80 mV of A-CFP/E-YFP-expressing (and untransfected as control, n = 8 cells) HEK293 KO cells (left) and current densities of wild-type HEK293 cells (right) with whole-cell configuration established after pre-incubation with indicated buffers: isotonic buffer without (n = 9) or with 1 µM PMA (n = 8) (left), isotonic (n = 7) and hypotonic (n = 7) buffers without and isotonic buffer with 1 µM PMA (n = 8) (right). Data represent individual cells (diamonds) and mean ± s.e.m. Above, representative current traces from voltage-step protocols for each condition.
Figure 4—figure supplement 1.
Figure 4—figure supplement 1.. PMA activates plasma membrane-localized VRAC.
(A) Addition of PMA (1 µM, indicated by arrow) did not affect cFRET of CFP-18aa-YFP in HeLa cells (n = 21 HeLa cells). Data represent mean ± s.d. (B) Inactivation of PMA-activated VRAC by hypertonic treatment. Time traces of A-CFP/E-YFP-expressing HeLa cells (9 cells) with addition of the PKC activator PMA (1 µM) followed by a switch to hypertonic buffer (500 mOsm) supplemented with 1 µM PMA, as indicated. Data represent mean ± s.d. (C) A-CFP-FM2/E-YFP-containing VRACs were chased through the secretory pathway in HeLa cells by the reverse aggregation system. At 10 min (ER; n = 4 dishes with 5 cells), 80 min (Golgi; n = 5, 12 cells) or 165 min (PM; n = 5, 6 cells) after addition of D/D solubilizer, when VRACs have reached the respective compartments, cFRET was measured before (untreated) and after (PMA) addition of 1 µM PMA. Data represent individual cells (diamonds) and mean ± s.e.m. Statistics: *p<0.05; n.s., not significant, Student’s t-test, comparing before and after PMA application.
Figure 4—figure supplement 2.
Figure 4—figure supplement 2.. Effects of Gö6983 on cFRET and VRAC currents.
(A) Left: time traces of A-CFP/E-YFP-expressing HeLa cells with a switch from isotonic to hypotonic buffer followed by consecutive switches to isotonic and hypotonic buffers containing 1 µM Gö6983 (7 cells). Data represent mean ± s.d. Right: average cFRET of the last five time points per condition (except for Iso, where all 15 time points were averaged). Data represent individual cells and mean ± s.e.m. (B) Simultaneous measurements of whole-cell currents (left) and normalized cFRET values (middle) during a buffer exchange experiment with A-CFP/E-YFP-expressing HEK293 KO cells. Isotonic and hypotonic buffers without and with 1 µM Gö6983, as indicated above. Right: normalized cFRET values of an unclamped HEK293 KO cell expressing A-CFP/E-YFP in the same FOV. Data represent mean of 3 cells ± s.d.
Figure 5.
Figure 5.. DAG and PKD as determinants of VRAC activity.
(A) Left: simultaneous measurements of whole-cell current at −80 mV (open circles) and normalized cFRET values (solid circles) during buffer exchange experiment with A-CFP/E-YFP-expressing HEK293 KO cells, after 15 min pre-incubation with 5 µM CRT 0066101 in the presence of CRT 0066101. Data represent mean of 5 cells ± s.d. Right: average currents of the last five time points in hypotonicity with (data from left panel) and without (data from Figure 1F) CRT 0066101; data represent individual cells (diamonds) and mean ± s.e.m. (B) Whole-cell currents of HEK293 KO cells expressing A-CFP/E-YFP clamped at −80 mV after pre-incubation with indicated buffers: isotonic buffer (n = 9), hypotonic buffer (n = 7), hypotonic buffer with 5 µM CRT 0066101 (n = 4) or 1 µM Gö6983 (n = 5). Data represent individual cells (diamonds) and mean ± s.e.m. (C) Recovery of whole-cell currents in HEK293 cells expressing A-CFP/E-YFP (left) and wild-type HEK293 (right) at −80 mV to basal levels after switching from extracellular hypotonicity to isotonicity in the absence or presence of the DAG kinase inhibitor dioctanoylglycol (100 µM DOG). In HEK293 KO, n = 3 for untreated (from measurements in Figure 1F) and n = 3 for DOG-treated; in wild-type HEK293, n = 3 for untreated and n = 4 for DOG-treated. Data represent individual cells (diamonds) and mean ± s.e.m. (D) cFRET was measured for HeLa cells expressing either VRACs containing A-CFP/E-YFP (left, n = 7 dishes with 9 cells) or the RD sensor for ionic strength (right, n = 6, 23 cells) consecutively in isotonic buffer, hypotonic buffer supplemented with 100 µM DOG and isotonic buffer with DOG. Average cFRET of the last five time points per condition. Data represent individual cells and mean ± s.e.m. Statistics: *p<0.05; ***p<0.0005; n.s., not significant, Student’s t-test.
Figure 5—figure supplement 1.
Figure 5—figure supplement 1.. Dioctanoylglycol (DOG) reduces VRAC inactivation after induction by hypotonicity.
(A) Whole-cell currents at −80 mV of a HEK293 KO cell expressing A-CFP/E-YFP (left, open circles) and of a HEK293 cell with endogenous VRAC (right) monitored during a buffer exchange experiment, switching from isotonic buffer to hypotonic buffer with 100 µM DOG and then to isotonic buffer with DOG. Cells are representative for the experiments yielding the values in Figure 5C. Left: normalized cFRET values (solid circles) measured simultaneously with whole-cell currents are additionally shown. Dashed lines indicate basal current and cFRET levels. (B) Normalized cFRET values for a HeLa cell expressing A-CFP/E-YFP during a buffer exchange experiment; representative for the experiments yielding the values in Figure 5D.

References

    1. Abascal F, Zardoya R. LRRC8 proteins share a common ancestor with pannexins, and may form hexameric channels involved in cell-cell communication. BioEssays. 2012;34:551–560. doi: 10.1002/bies.201100173. - DOI - PubMed
    1. Akita T, Okada Y. Characteristics and roles of the volume-sensitive outwardly rectifying (VSOR) anion channel in the central nervous system. Neuroscience. 2014;275:211–231. doi: 10.1016/j.neuroscience.2014.06.015. - DOI - PubMed
    1. Baron CL, Malhotra V. Role of diacylglycerol in PKD recruitment to the TGN and protein transport to the plasma membrane. Science. 2002;295:325–328. doi: 10.1126/science.1066759. - DOI - PubMed
    1. Ben Soussia I, Mies F, Naeije R, Shlyonsky V. Melatonin down-regulates volume-sensitive chloride channels in fibroblasts. Pflügers Archiv - European Journal of Physiology. 2012;464:273–285. doi: 10.1007/s00424-012-1139-2. - DOI - PubMed
    1. Best L, Brown PD. Studies of the mechanism of activation of the volume-regulated anion channel in rat pancreatic beta-cells. Journal of Membrane Biology. 2009;230:83–91. doi: 10.1007/s00232-009-9189-x. - DOI - PubMed

Publication types