

Numerical and Experimental Analysis of Radiofrequency-Induced Heating Versus Lead Conductivity During EEG-MRI at 3 T
- PMID: 31210669
- PMCID: PMC6579539
- DOI: 10.1109/TEMC.2018.2840050
Numerical and Experimental Analysis of Radiofrequency-Induced Heating Versus Lead Conductivity During EEG-MRI at 3 T
Abstract
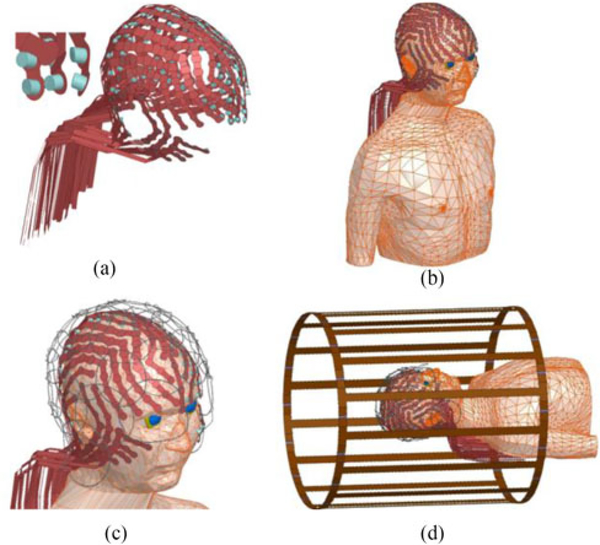
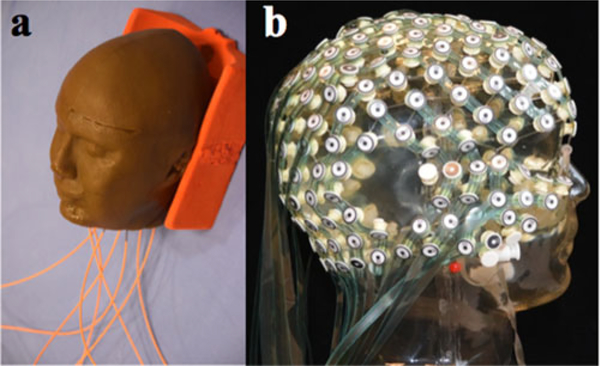
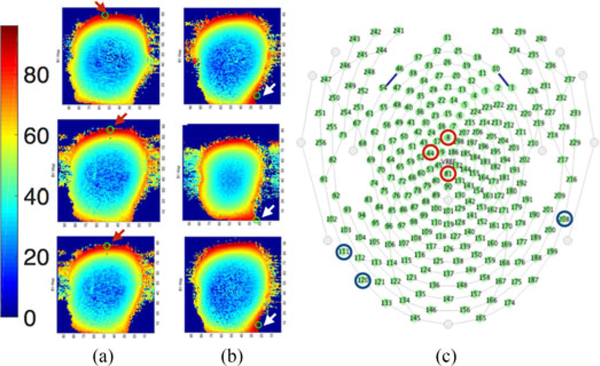
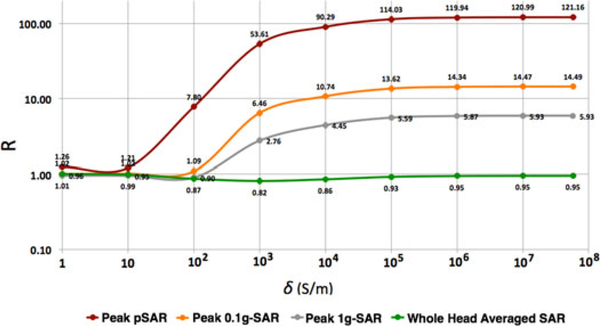
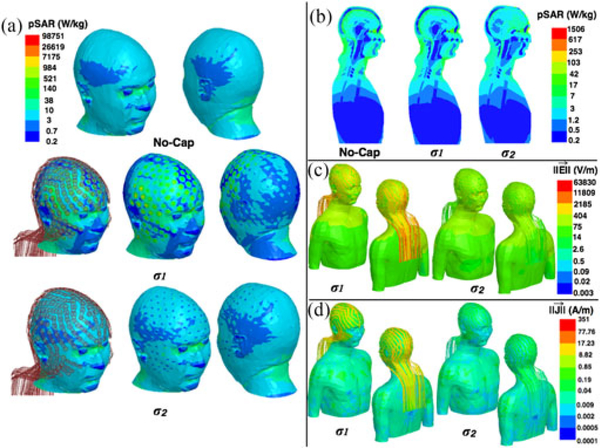
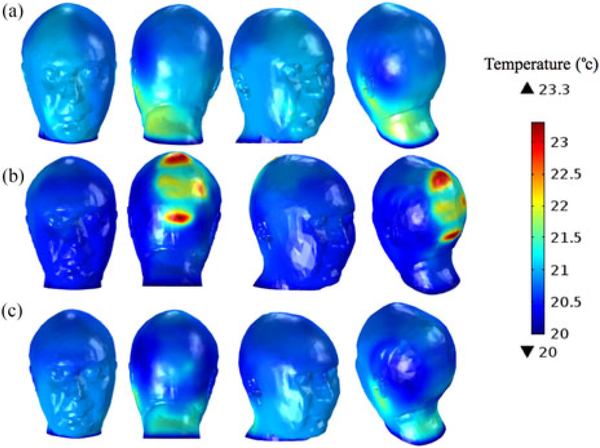
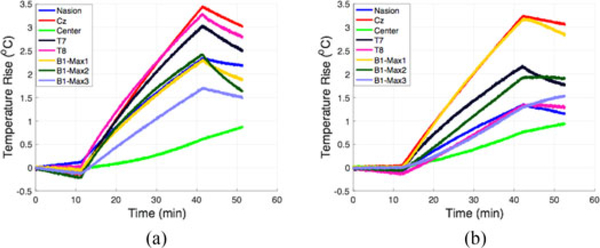
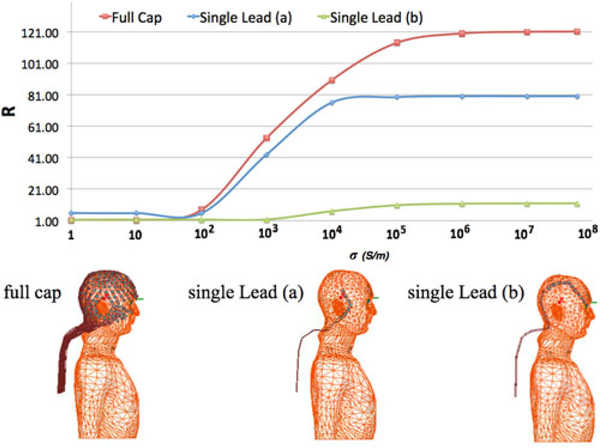
This study investigates radiofrequency (RF)-induced heating in a head model with a 256-channel electroencephalogram (EEG) cap during magnetic resonance imaging (MRI). Nine computational models were implemented each with different EEG lead electrical conductivity, ranging from 1 to 5.8 × 10⁷ S/m. The peak values of specific absorption rate (SAR) averaged over different volumes were calculated for each lead conductivity. Experimental measurements were also performed at 3-T MRI with a Gracilaria Lichenoides (GL) phantom with and without a low-conductive EEG lead cap ("InkNet"). The simulation results showed that SAR was a nonlinear function of the EEG lead conductivity. The experimental results were in line with the numerical simulations. Specifically, there was a ΔT of 1.7 °C in the GL phantom without leads compared to ΔT of 1.8 °C calculated with the simulations. Additionally, there was a ΔT of 1.5 °C in the GL phantom with the InkNet compared to a ΔT of 1.7 °C in the simulations with a cap of similar conductivity. The results showed that SAR is affected by specific location, number of electrodes, and the volume of tissue considered. As such, SAR averaged over the whole head, or even SAR averaged over volumes of 1 or 0.1 g, may conceal significant heating effects and local analysis of RF heating (in terms of peak SAR and temperature) is needed.
Keywords: Anatomical models; computational electromagnetic modeling; finite-element method (FEM); specific absorption rate (SAR).
Figures
Similar articles
-
Modeling radio-frequency energy-induced heating due to the presence of transcranial electric stimulation setup at 3T.MAGMA. 2020 Dec;33(6):793-807. doi: 10.1007/s10334-020-00853-5. Epub 2020 May 27. MAGMA. 2020. PMID: 32462558 Free PMC article.
-
RF-induced heating in tissue near bilateral DBS implants during MRI at 1.5 T and 3T: The role of surgical lead management.Neuroimage. 2019 Jan 1;184:566-576. doi: 10.1016/j.neuroimage.2018.09.034. Epub 2018 Sep 19. Neuroimage. 2019. PMID: 30243973 Free PMC article.
-
Deep brain stimulation lead-contact heating during 3T MRI: single- versus dual-channel pulse generator configurations.Int J Neurosci. 2014 Mar;124(3):166-74. doi: 10.3109/00207454.2013.840303. Epub 2013 Oct 8. Int J Neurosci. 2014. PMID: 24000873
-
MRI-induced heating of selected thin wire metallic implants-- laboratory and computational studies-- findings and new questions raised.Minim Invasive Ther Allied Technol. 2006;15(2):76-84. doi: 10.1080/13645700600640931. Minim Invasive Ther Allied Technol. 2006. PMID: 16754190 Review.
-
Using Anatomical Human Body Model for FEM SAR Simulation of a 3T MRI System.2020 Aug 6. In: Makarov SN, Noetscher GM, Nummenmaa A, editors. Brain and Human Body Modeling 2020: Computational Human Models Presented at EMBC 2019 and the BRAIN Initiative® 2019 Meeting [Internet]. Cham (CH): Springer; 2021. 2020 Aug 6. In: Makarov SN, Noetscher GM, Nummenmaa A, editors. Brain and Human Body Modeling 2020: Computational Human Models Presented at EMBC 2019 and the BRAIN Initiative® 2019 Meeting [Internet]. Cham (CH): Springer; 2021. PMID: 32966018 Free Books & Documents. Review.
Cited by
-
Numerical simulation of the radiofrequency safety of 128-channel hd-EEG nets on a 29-month-old whole-body model in a 3 Tesla MRI.IEEE Trans Electromagn Compat. 2021 Oct;63(5):1748-1756. doi: 10.1109/TEMC.2021.3097732. Epub 2021 Aug 16. IEEE Trans Electromagn Compat. 2021. PMID: 34675444 Free PMC article.
-
Modeling radio-frequency energy-induced heating due to the presence of transcranial electric stimulation setup at 3T.MAGMA. 2020 Dec;33(6):793-807. doi: 10.1007/s10334-020-00853-5. Epub 2020 May 27. MAGMA. 2020. PMID: 32462558 Free PMC article.
-
High-quality multimodal MRI with simultaneous EEG using conductive ink and polymer-thick film nets.J Neural Eng. 2024 Nov 5;21(6):10.1088/1741-2552/ad8837. doi: 10.1088/1741-2552/ad8837. J Neural Eng. 2024. PMID: 39419105 Free PMC article.
-
MRI-Induced Heating of Coils for Microscopic Magnetic Stimulation at 1.5 Tesla: An Initial Study.Front Hum Neurosci. 2020 Mar 13;14:53. doi: 10.3389/fnhum.2020.00053. eCollection 2020. Front Hum Neurosci. 2020. PMID: 32231526 Free PMC article.
-
Segmenting electroencephalography wires reduces radiofrequency shielding artifacts in simultaneous electroencephalography and functional magnetic resonance imaging at 7 T.Magn Reson Med. 2022 Sep;88(3):1450-1464. doi: 10.1002/mrm.29298. Epub 2022 May 16. Magn Reson Med. 2022. PMID: 35575944 Free PMC article.
References
-
- Gabriel C, Compilation of the Dielectric Properties of Body Tissues at RF and Microwave Frequencies. London, U.K.: King’s College London, 1996. [Online]. Available: http://niremf.ifac.cnr.it/docs/DIELECTRIC/Report.html
-
- Herrmann CS and Debener S, “Simultaneous recording of EEG and BOLD responses: A historical perspective,” Int. Psychophysiol, vol. 67, pp. 161–168, 2008. - PubMed
-
- Mullinger K and Bowtell R, “Combining EEG and fMRI,” in Magnetic Resonance Neuroimaging: Methods and Protocols, Modo M and Bulte WMJ, Eds. Totowa, NJ, USA: Humana Press, 2011, pp. 303–326. - PubMed
-
- Laufs H, “Functional imaging of seizures and epilepsy: evolution from zones to networks,” Curr. Opin. Neurol, vol. 25, pp. 194–200, 2012. - PubMed
-
- Lemieux L, Allen PJ, Franconi F, Symms MR, and Fish DK, “Recording of EEG during fMRI experiments: patient safety,” Magn. Reson. Med, vol. 38, pp. 943–952, 1997. - PubMed
Grants and funding
LinkOut - more resources
Full Text Sources
Research Materials
Miscellaneous