. 2019 Jun 18;5(14):e127729.
doi: 10.1172/jci.insight.127729.

Regulation of murine NK cell exhaustion through the activation of the DNA damage repair pathway

Affiliations

Regulation of murine NK cell exhaustion through the activation of the DNA damage repair pathway

Maite Alvarez et al. JCI Insight. .

Abstract

NK cell exhaustion (NCE) due to sustained proliferation results in impaired NK cell function with loss of cytokine production and lytic activity. Using murine models of chronic NK cell stimulation, we have identified a phenotypic signature of NCE characterized by up-regulation of the terminal differentiation marker KLRG1 and by down-regulation of eomesodermin and the activating receptor NKG2D. Chronic stimulation of mice lacking NKG2D resulted in minimized NCE compared to control mice, thus identifying NKG2D as a crucial mediator of NCE. NKG2D internalization and downregulations on NK cells has been previously observed in the presence of tumor cells with high expression of NKG2D ligands (NKG2DL) due to the activation of the DNA damage repair pathways. Interestingly, our study revealed that during NK cell activation there is an increase of MULT1, and NKG2DL, that correlates with an induction of DNA damage. Treatment with the ATM DNA damage repair pathway inhibitor KU55933 (KU) during activation reduced NCE by improving expression of activation markers and genes involved in cell survival, by sustaining NKG2D expression and by preserving cell functionality. Importantly, NK cells expanded ex vivo in the presence of KU displayed increased anti-tumor efficacy in both NKG2D-dependent and -independent mouse models. Collectively, these data demonstrate that NCE is caused by DNA damage and regulated, at least in part, by NKG2D. Further, the prevention of NCE is a promising strategy to improve NK cell-based immunotherapy.

Keywords: DNA repair; Immunology; Immunotherapy; NK cells; Oncology.


Conflict of interest statement

Conflict of interest: The authors have declared that no conflict of interest exists.

Figures

Figure 1
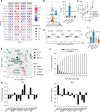
Figure 1. Exhaustion markers can be identified by changes in NK cell activation phenotype and function following chronic stimulation.
Mice were treated with IL-15, as described in Supplemental Figure 1A. Spleens were collected at the indicated times and NK cells were analyzed. (A) Multivariate heatmap analysis was performed on data obtained from flow cytometry analysis. The percentage of a given marker within the total NK cell population is represented by the geometric size of the circle, while the color gradient represents the median fluoresce intensity (MFI) for each marker in each model representing the maximal and minimal expression within each specific marker. Statistical differences are represented in black for percentage and in red for MFI compared with the acute group. (B) Representative histograms and the total percentage of Ki67 on gated NK cells (CD3NK1.1+) are shown. (C) The percentage of NK cell lysis of CFSE-labeled Yac1 cells is shown. The effector/target (E/T) ratio is normalized to the percentage of splenic NK cells. (D) Representative dot plots and the total percentage of IFN-γ production by NK cells (CD3CD49b+) after NK1.1 stimulation are shown. (E) Principal component analysis (PCA) representation of NK cell markers for IL-15 (circle), IL-2 (triangle), or Poly I:C (square) models after control (gray), resolved (white), acute (turquoise), or chronic (orange) stimulation. (F) The percentage of the variance for each or cumulative PC is shown. (G) Representation of the NK cell markers that drive PC1 and PC2 is shown. Data are representative of at least 3 independent experiments with 3 mice per group (mean ± SEM). One-way ANOVA or two-way ANOVA was used to assess significance. Significant differences are displayed for comparisons with the acute group (*P < 0.05, **P < 0.01, ***P < 0.001). No significant differences were found when comparisons among the control, resolved, and chronic groups were made.
Figure 2
Figure 2. NK cells exposed to chronic MCMV display an exhausted phenotype.
Mice were infected with MCMV for 3, 7, 14, 21, or 28 days, and salivary glands were obtained for analysis of NK cell phenotype by flow cytometry. Control unstimulated groups (gray) are represented on day 0 of infection, acute simulation groups (turquoise) on days 3 and 7, and chronic stimulation groups (orange) on days 14, 21 and 28. For IFN-γ, NK cells were stimulated with anti-NK1.1 for 4 hours before analysis. (AF) Representative histograms or dot plots and the percentage of total expression of Ki67 (A and B), IFN-γ (C and D), and granzyme B (E and F) are shown for splenic NK cells (CD3NK1.1+ or CD3CD49d+). (GJ) Total MFI or percentage is shown for Eomes (G), NKG2D (H), Ly49G2 (I), and KLRG1 (J) on salivary gland–derived gated NK cells. Data are representative of 3 experiments, with 4–5 mice per group (mean ± SEM). One-way ANOVA was used to assess significance (*P < 0.05, **P < 0.01, ***P < 0.001).
Figure 3
Figure 3. NKG2D deficiency during in vivo chronic IL-2 stimulation improves function and reduces NCE.
WT and NKG2D-KO (top) or 200 μg IgG-treated and anti-NKG2D–treated (bottom) mice underwent chronic IL-2 in vivo stimulation, as described in Supplemental Figure 1B. (A) Fold change difference for the total percentage of IFN-γ production is shown for gated NK cells after NK1.1 stimulation. (B) The percentage of tumor lysis at different E/T ratios normalized to the percentage of NK cells during IL-2 stimulation is shown. (C–F) MFI or total percentage of Eomes (C), Ly49G2 (D), Thy1.2 (E), and KLRG1 (F) on gated NK cells is shown. Data are representative of at least 2 independent experiments with 4 mice per group (mean ± SEM). Significant differences are displayed for comparisons with control (WT or IgG) animals (*P < 0.05, **P < 0.01, ***P < 0.001).
Figure 4
Figure 4. NKG2D internalization correlates with NCE after sustained in vitro stimulation.
WT-derived NK cells were collected at different time points after in vitro IL-2 stimulation to represent the different stages of chronic stimulation. Thus, cells collected on day 0 represent the control unstimulated group (gray), on day 4 the acute group (turquoise), and on days 7 and 9 the chronic stimulation group (orange). (A) Representative histograms of the expression of NKG2D before (surface, straight line) and after cell permeabilization (dotted line), depicting the degree of protein internalization, are shown for gated NK cells. (B and C) The percentage of NKG2D before and after cell permeabilization (B) and the difference (NKG2D internalization) (C) on gated NK cells are shown. (D) Representative immunofluorescence image of NK cells expressing CD45 and NKG2D at days 4, 7, and 9 after stimulation. Data are representative of 3 independent experiments performed in triplicate (mean ± SEM). Two-way ANOVA was used to assess significance (***P < 0.001).
Figure 5
Figure 5. Expression of stress molecules and induction of DNA damage are increased during sustained NK cell stimulation.
(A and B) Representative histograms (A) and total percentage (B) of MULT1 and Rae-1δ on gated NK cells are shown at different time points after in vitro IL-2 stimulation. (C) Representative immunofluorescence image of CD45, NKG2D, and MULT1 on NK cells on day 4 (acute stage) of in vitro IL-2 activation. (D) The total percentage of MULT1 on gated NK cells after in vivo IL-2 stimulation or in vivo MCMV infection is shown. (E) The total percentage of IFN-γ (after NK1.1 stimulation), Eomes MFI, and percentage of NKG2D are shown on gated NK cells collected after 9 days (chronic) in vitro IL-2 stimulation, which were treated with 10 μg/mL rIgG or anti-MULT1 5 days before. (F and G) Representative histograms (F) and the total percentage and MFI (G) of phosphorylated ATM (pATM) are shown for gated NK cells collected at different time points (control, day 0; acute, day 4; and chronic, days 7 and 9) after in vitro IL-2 stimulation. (H and I) The total percentage of PVR (CD155) is shown on gated NK cells after in vitro IL-2 stimulation (H) or after in vivo IL-15, IL-2, or Poly I:C stimulation (I). Data are representative of 3 (AD, F, and G) or 2 (E) independent experiments. In vitro studies were done in triplicate, while in vivo studies were done with 3 mice per group, except for the MCMV model, which had 4–5 mice per group (mean ± SEM). Significant differences are displayed for comparisons with nonstimulated controls (*P < 0.05, **P < 0.01, ***P < 0.001).
Figure 6
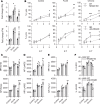
Figure 6. Inhibition of the ATM DNA damage repair pathway delays NCE by increasing NK cell function and survival, which improve antitumor responses after NK cell adoptive transfer therapy.
Thy1.2 BM-derived cells were cultured in vitro with IL-2 and treated with DMSO or 7.5 μM ATM inhibitor KU on day 4 of culture. Adherent NK cells were collected at different time points of culture. (A) Hierarchical clustering by Euclidean distance analysis of the expression of multiple NK cell markers is shown. (B) The NCE phenotype was evaluated on in vitro activated NK cells measured by Eomes MFI and the total percentage of NKG2D and KLRG1 on gated NK cells. (C) The percentage of Ki67 is shown. (D) BCL2 MFI is shown on gated NK cells. (E) The 20S proteasome activity of NK cells is shown. (F) The percentage of IFN-γ production after NK1.1 stimulation is shown. (G) The percentage of tumor lysis of NK cells against A20 is shown. (H and I) C57BL/6 mice received total body radiation (TBI) at the time of tumor i.v. infusion (H: A20) or 7 days after tumor administration (I: B16F10), followed by allogeneic (H) or syngeneic (I) hematopoietic stem cell transplantation (HCT), along with freshly isolated unstimulated NK cells (fresh NK) or 5 day ex vivo expanded activated NK cells in the presence of vehicle control (aNK) or KU (KU aNK). When indicated, mice received low doses of IL-2 (5 × 10⁴ IU) for 7 days after NK cell administration. Percentage is of in vivo tumor survival of NKG2D-dependent (H: A20) or -independent (I: B16F10) tumor-bearing mice after HCT with adoptive transfer of PBS (control) or NK cells. Data represent 2 or 3 independent experiments done in triplicate (in vitro model) or with 5–8 mice per group (in vivo tumor model) (mean ± SEM). One-way ANOVA (in vitro model) or log-rank test (in vivo tumor model) were used to assess significance (*P < 0.05, **P < 0.01, ***P < 0.001). In tumor models, the significance between control IL-2 and fresh NK and control IL-2 and KU-aNK (black asterisks) as well as between fresh NK and KU-aNK (red asterisks) is shown.
Figure 7
Figure 7. Schematic representation of the implication of the DNA damage repair pathway in NCE.
(A) During acute stimulation, NK cells present the highest expression of activating receptors, proliferation potential, activating transcription factors, and functionality. This process leads to the activation of the DNA damage repair pathway that, with continued stimulation, leads to upregulation of stress molecules, such as MULT1; internalization of NKG2D; and reduction of proliferation, function, and expression of activating receptors and transcription factors. (B) Inhibition of this pathway by KU during the acute phase can delay the exhaustion phenotype and prolong NK cell function, proliferation, and the activation phenotype.

References

    1. Wahid SF. Indications and outcomes of reduced-toxicity hematopoietic stem cell transplantation in adult patients with hematological malignancies. Int J Hematol. 2013;97(5):581–598. doi: 10.1007/s12185-013-1313-0. - DOI - PubMed
    1. Simonetta F, Alvarez M, Negrin RS. Natural killer cells in graft-versus-host-disease after allogeneic hematopoietic cell transplantation. Front Immunol. 2017;8:465. - PMC - PubMed
    1. Mamessier E, et al. Human breast cancer cells enhance self tolerance by promoting evasion from NK cell antitumor immunity. J Clin Invest. 2011;121(9):3609–3622. doi: 10.1172/JCI45816. - DOI - PMC - PubMed
    1. Alvarez M, Bouchlaka MN, Sckisel GD, Sungur CM, Chen M, Murphy WJ. Increased antitumor effects using IL-2 with anti-TGF-β reveals competition between mouse NK and CD8 T cells. J Immunol. 2014;193(4):1709–1716. doi: 10.4049/jimmunol.1400034. - DOI - PMC - PubMed
    1. Buyse M, et al. Individual patient data meta-analysis of randomized trials evaluating IL-2 monotherapy as remission maintenance therapy in acute myeloid leukemia. Blood. 2011;117(26):7007–7013. doi: 10.1182/blood-2011-02-337725. - DOI - PMC - PubMed

Publication types

MeSH terms

Substances