. 2019 Jun 18;15(6):e1007113.
doi: 10.1371/journal.pcbi.1007113. eCollection 2019 Jun.

Transcriptomic correlates of electrophysiological and morphological diversity within and across excitatory and inhibitory neuron classes

Affiliations

Transcriptomic correlates of electrophysiological and morphological diversity within and across excitatory and inhibitory neuron classes

Claire Bomkamp et al. PLoS Comput Biol. .

Abstract

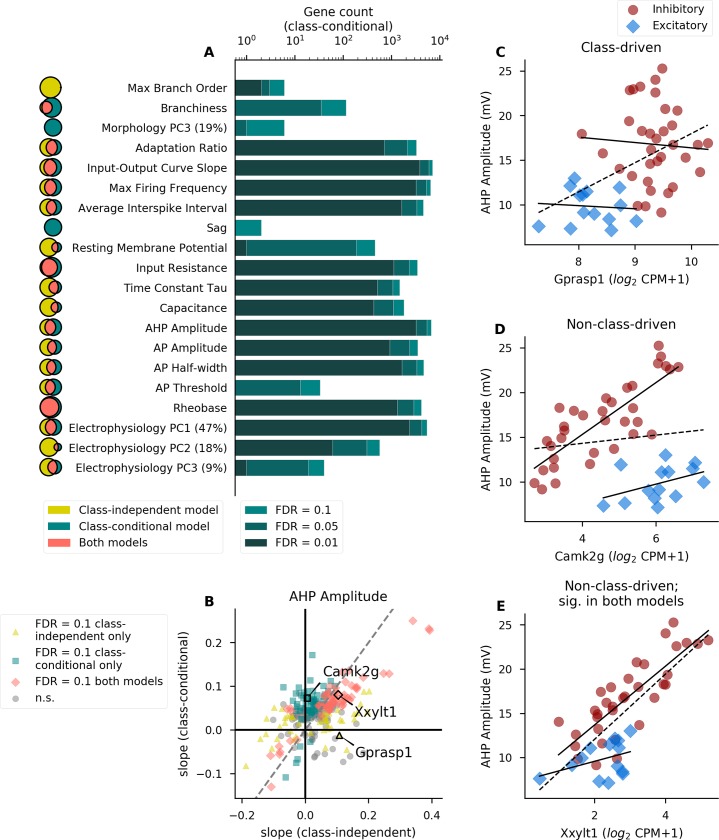
In order to further our understanding of how gene expression contributes to key functional properties of neurons, we combined publicly accessible gene expression, electrophysiology, and morphology measurements to identify cross-cell type correlations between these data modalities. Building on our previous work using a similar approach, we distinguished between correlations which were "class-driven," meaning those that could be explained by differences between excitatory and inhibitory cell classes, and those that reflected graded phenotypic differences within classes. Taking cell class identity into account increased the degree to which our results replicated in an independent dataset as well as their correspondence with known modes of ion channel function based on the literature. We also found a smaller set of genes whose relationships to electrophysiological or morphological properties appear to be specific to either excitatory or inhibitory cell types. Next, using data from PatchSeq experiments, allowing simultaneous single-cell characterization of gene expression and electrophysiology, we found that some of the gene-property correlations observed across cell types were further predictive of within-cell type heterogeneity. In summary, we have identified a number of relationships between gene expression, electrophysiology, and morphology that provide testable hypotheses for future studies.


Conflict of interest statement

The authors have declared that no competing interests exist.

Figures

Fig 1
Fig 1
Methods for modeling relationships between gene expression and electrophysiological or morphological properties with respect to cell class (A) Schematic for defining cell types from single-cell transcriptomic or electrophysiological and morphological data. We divided cells into types based on Cre-driver expression as well as cortical layer and excitatory/inhibitory identity (left). Right panel shows summarization of cellular features by cell type for a hypothetical gene and property, where each point in the scatter plot represents each cell type’s mean gene expression (x-axis) and the mean value of an electrophysiological or morphological property (y-axis). (B) A hypothetical class-driven relationship between a gene and an electrophysiological or morphological property, in which neither cell class (excitatory or inhibitory) shows a relationship between gene expression and the property (solid lines), but an overall relationship appears because of systematic cross-class differences in both data modalities (dashed line). For B-D, small points represent individual cells and larger circles or diamonds represent cell type averages. (C) A hypothetical example of a non-class-driven relationship, where the gene-property relationship appears within each major cell class (solid lines), but would be obscured if modeled in a class-independent manner (dashed line). (D) A hypothetical example of a gene-property relationship exhibiting an interaction with cell class. Here, expression of the gene is positively correlated with the property in excitatory cell types but negatively correlated in inhibitory types (solid lines).
Fig 2
Fig 2. Different sets of genes are associated with electrophysiological and morphological properties after correcting for cell class.
(A) Number of genes significantly associated with each property in the class-conditional model at various levels of significance (only properties with significant genes in this model are shown). Darkness of the bar represents the significance level of each group of genes. Venn diagrams to the left indicate the extent of overlap (pink; middle) between the gene sets identified by the class-independent (gold; left) and class-conditional (teal; right) models, where the area of each segment is proportional to the significant gene count at a threshold of FDR = 0.1. Venn diagrams for different properties are not to scale with one another. Percentages next to principal components (PCs) indicate the percent variability explained by that component. See S2 Table for descriptions of electrophysiological and morphological properties analyzed here, as well as gene counts for all properties. (B) Comparison of model-based slopes from the class-independent and class-conditional models. Each point represents a single gene’s relationship with the electrophysiological property AHP amplitude and is colored according to whether the relationship is significant in one or both models (at FDR = 0.1). Example genes in C-E are indicated. For clarity of visualization, only a random subset of genes (2% total) are shown to mitigate over-plotting. Dashed line indicates identity. (C-E) Examples of genes showing significant associations with AHP amplitude that are class-driven (C; significant in class-independent model only), non-class-driven (D; significant in class-conditional model only), or non-class-driven but significant by either model (E). Solid lines indicate linear fits within excitatory or inhibitory cell classes only and dashed line indicates a linear fit including all cell types. Gene expression is quantified as counts per million (CPM).
Fig 3
Fig 3
Identification of divergent gene-property relationships in excitatory versus inhibitory cell classes (A) Number of genes showing a significant interaction effect between gene and class for each property. Darkness of the bar represents the significance level of each group of genes. Venn diagrams to the left indicate the extent of overlap (pink; middle) between the class-conditional (teal; left) and interaction (purple; right) models, where the area of each segment is proportional to the significant gene count at a threshold of FDR = 0.1. Venn diagrams for different properties are not to scale with one another. Percentages next to principal components (PCs) indicate the percentage of variability explained by that component. (B-C) Slope values within excitatory cell types (x axis) plotted against the slope values for the same set of genes in inhibitory cell types (y axis). Each point represents a single gene’s relationship to the morphological property maximum branch order (B) or electrophysiological property AHP amplitude (C), and is colored according to its significance in one or both models (see inset legend). Example gene-property relationships highlighted in D-E are marked in panel C. For clarity of visualization, only a random 2% subset of the total number of genes are plotted. Dashed lines indicate positive and negative unity lines. (D) Example of a gene with a significant interaction term which is not significant in the class-conditional model. For D and E, solid lines indicate linear fits including only excitatory or only inhibitory cell types, and dashed line indicates a linear fit including all cell types. (E) Example of a gene which is significant in both the class-conditional and interaction models.
Fig 4
Fig 4
Modeling gene/electrophysiology relationships using the class-conditional model is more predictive than the class-independent model of model slopes in an independent dataset containing non-projecting cell types only (A) Aggregate gene-property relationship consistency between AIBS and NeuroExpresso/NeuroElectro (NE) datasets. Error bars indicate a 95% confidence interval, and asterisk indicates a significant (p < 0.05) difference in the consistency metric between the class-independent and class-conditional models, calculated using 100 bootstrap resamples of the original values (indicated only for properties where both values are positive). (B) Direct comparison of gene-property relationships between the AIBS and NE datasets. Each point represents the relationship between a single gene and the property AP half-width. The model slope from the AIBS dataset is plotted on the x axis (with the class-independent model (ind) slopes in gold, and the class-conditional model (cond) slopes in teal), and that for the same set of genes in the NE dataset on the y axis. For clarity of visualization only 10% of the total number of genes are plotted. Lines indicate a linear fit for each set of points. The correlation within each set of points is used as a measure of cross-dataset consistency (plotted for all properties in panel A). (C-D) Example of a gene showing consistent results between the NE dataset and the AIBS dataset using the class-conditional model, but not the class-independent model. C shows the relationship within the AIBS dataset, and D shows the same gene and property in the NE dataset. Solid lines indicate a linear fit including only types belonging to one cell class, and dashed line indicates a linear fit including all cell types.
Fig 5
Fig 5
Assessing gene-property relationships within cell subclasses using PatchSeq (A) Number of genes associated with each electrophysiological property based on a joint cross-laboratory analysis of 5 PatchSeq datasets. Genes shown are significant at FDR = 0.1, based on a mixed-effects regression model, treating gene expression as a fixed effect and dataset identity and cell type as random effects. Bar color denotes overlap of PatchSeq based gene-property relationships with analogous relationships from the AIBS class-conditional model analysis. Note that analysis of gene-property relationships in the PatchSeq datasets are independent from those in the AIBS cell types analysis. (B, C) Examples of genes showing significant associations with electrophysiological features in the class-conditional analysis of the AIBS dataset (left-most panel) and the mixed-effects analysis of the PatchSeq datasets (other panels). Dataset name and cell type is shown in the subpanel title and solid lines indicate linear fits within cell classes (AIBS) or fits within each PatchSeq dataset and cell type, after weighting cells by transcriptome-quality (see Methods). Based on differences in mRNA quantification, x-axis units for AIBS, Cadwell, and Földy datasets are log2 (CPM+1), and for Bengtsson Gonzales, Muñoz, and Fuzik datasets are log2 normalized molecule counts (normalized to 2000 unique molecules per cell).
Fig 6
Fig 6
Accounting for cell class changes the interpretation of the relationship between potassium channel expression and after-hyperpolarization amplitude (A) Schematic view of an action potential trace, with the dashed line representing the AHP amplitude value. (B-D) Examples of voltage-gated potassium channel genes significantly associated with AHP amplitude in the class-independent model (B), the class-conditional model (C), or both (D) at a threshold of FDR = 0.01. Solid lines indicate a linear fit including only excitatory or only inhibitory cell types, and dashed line indicates a linear fit including all cell types. (E) Comparison of class-independent and class-conditional approaches for detecting associations between voltage-gated potassium channels and AHP amplitude. Each point indicates a single gene, and x and y axes are the slopes from the class-independent and class-conditional models, respectively. Labeled points are the example genes shown in B-D. Dashed line indicates identity.
Fig 7
Fig 7
Examples of experimentally supported or otherwise potentially interesting genes (A-D) Examples of genes showing statistically-significant gene-property relationships in the class-conditional model (at FDR = 0.1) that also have experimental support for their causal regulation of the property in the literature. Solid lines indicate linear fits including only excitatory or only inhibitory cell types, and dashed line indicates a linear fit including all cell types (also applies to F-I). (E) Heatmap showing a subset of the most significant genes for each property in the class-conditional model, sorted along both axes by similarity. Dendrogram represents cross-property similarity between the significance levels for the genes shown here; properties appearing closely linked in the dendrogram are those which are strongly associated with the same genes in our analysis. For each property, up to 3 top genes were chosen that were significant (at FDR = 0.1) in the class-conditional model, and also non-significant (at FDR = 0.2) in both the class-independent and interaction models for the same property. In addition, genes marked by asterisks are shown here based on their known function based on the literature in addition to at least one significant result in the class-conditional model, shown as scatterplots in A-D and F-I. Light grey indicates a non-significant result in the class-conditional model (at FDR = 0.1). (F-I) Examples of under-studied but plausibly causal genes showing significant results in the class-conditional model (see text).

References

    1. Gouwens NW, Sorensen SA, Berg J, Lee C, Jarsky T, Ting J, et al. Classification of electrophysiological and morphological types in mouse visual cortex. 2018;Preprint. Available from: https://www.biorxiv.org/content/biorxiv/early/2018/07/17/368456.full.pdf - PMC - PubMed
    1. Padmanabhan K, Urban NN. Intrinsic biophysical diversity decorrelates neuronal firing while increasing information content. Nat Neurosci [Internet]. 2010;13(10):1276–82. Available from: 10.1038/nn.2630 - DOI - PMC - PubMed
    1. Markram H, Muller E, Ramaswamy S, Reimann MW, Defelipe J, Hill SL, et al. Reconstruction and Simulation of Neocortical Microcircuitry. Cell [Internet]. 2015;163:456–92. Available from: 10.1016/j.cell.2015.09.029 - DOI - PubMed
    1. Connors BW, Regehr WG. Neuronal firing: Does function follow form? Curr Biol [Internet]. 1996;6(12):1560–2. Available from: 10.1016/S0960-9822(02)70771-9 - DOI - PubMed
    1. Chklovskii DB. Synaptic connectivity and neuronal morphology: Two sides of the same coin. Neuron [Internet]. 2004;43(5):609–17. Available from: 10.1016/j.neuron.2004.08.012 - DOI - PubMed

Publication types