

An Expert System for Quantification of Bradykinesia Based on Wearable Inertial Sensors
- PMID: 31212680
- PMCID: PMC6603543
- DOI: 10.3390/s19112644
An Expert System for Quantification of Bradykinesia Based on Wearable Inertial Sensors
Abstract
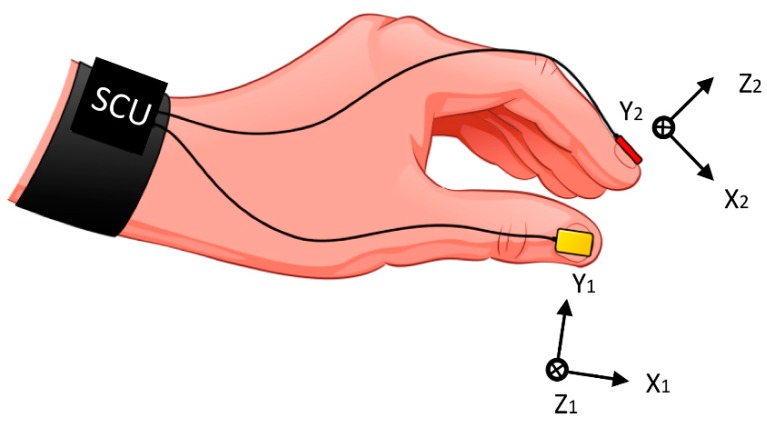
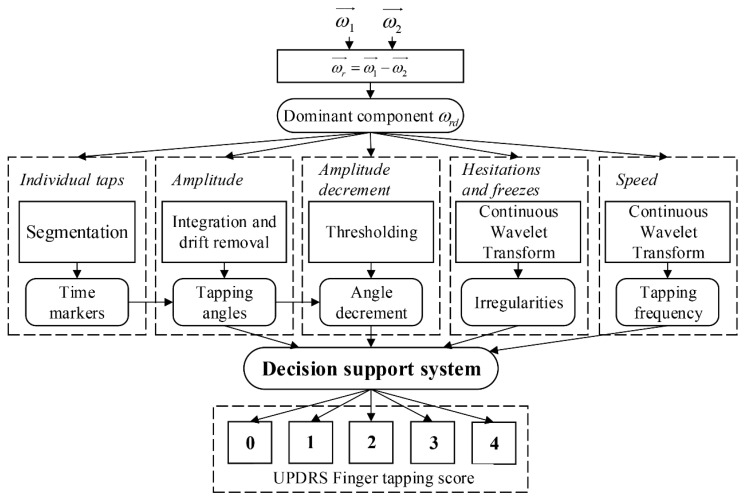
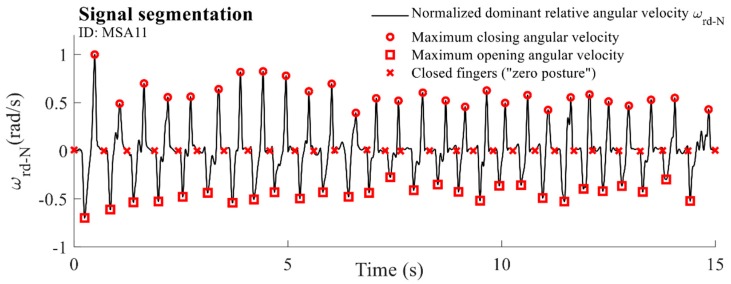
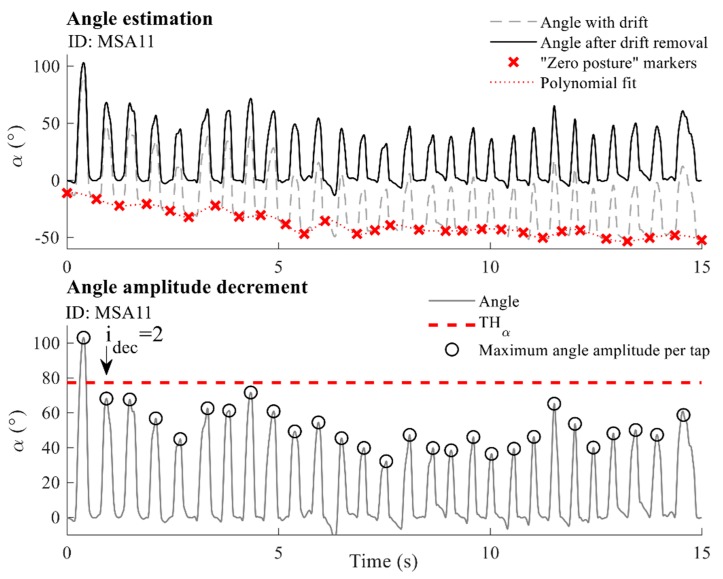
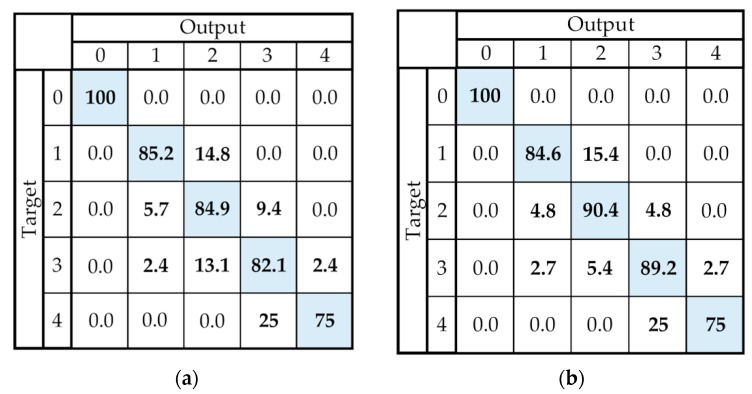
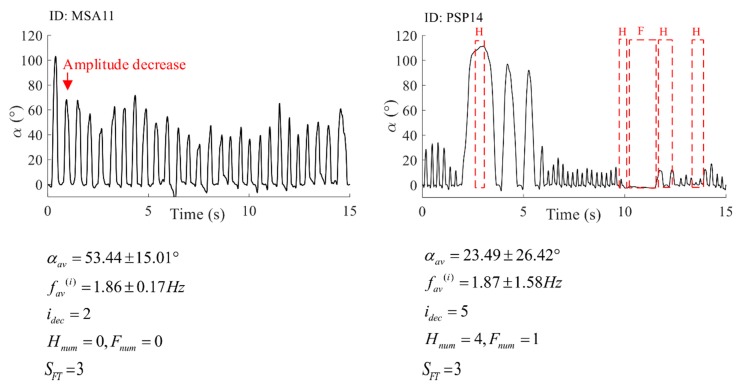
Wearable sensors and advanced algorithms can provide significant decision support for clinical practice. Currently, the motor symptoms of patients with neurological disorders are often visually observed and evaluated, which may result in rough and subjective quantification. Using small inertial wearable sensors, fine repetitive and clinically important movements can be captured and objectively evaluated. In this paper, a new methodology is designed for objective evaluation and automatic scoring of bradykinesia in repetitive finger-tapping movements for patients with idiopathic Parkinson's disease and atypical parkinsonism. The methodology comprises several simple and repeatable signal-processing techniques that are applied for the extraction of important movement features. The decision support system consists of simple rules designed to match universally defined criteria that are evaluated in clinical practice. The accuracy of the system is calculated based on the reference scores provided by two neurologists. The proposed expert system achieved an accuracy of 88.16% for files on which neurologists agreed with their scores. The introduced system is simple, repeatable, easy to implement, and can provide good assistance in clinical practice, providing a detailed analysis of finger-tapping performance and decision support for symptom evaluation.
Keywords: Parkinson’s disease; UPDRS; atypical parkinsonism; automatic scoring; decision support system; finger-tapping; wearable inertial sensors.
Conflict of interest statement
The authors declare no conflicts of interest. The funders had no role in the design of the study; in the collection, analyses, or interpretation of data; in the writing of the manuscript, or in the decision to publish the results.
Figures
Similar articles
-
The discerning eye of computer vision: Can it measure Parkinson's finger tap bradykinesia?J Neurol Sci. 2020 Sep 15;416:117003. doi: 10.1016/j.jns.2020.117003. Epub 2020 Jun 30. J Neurol Sci. 2020. PMID: 32645513
-
Quantification of whole-body bradykinesia in Parkinson's disease participants using multiple inertial sensors.J Neurol Sci. 2018 Apr 15;387:157-165. doi: 10.1016/j.jns.2018.02.001. Epub 2018 Feb 2. J Neurol Sci. 2018. PMID: 29571855
-
Validation of Inertial Sensing-Based Wearable Device for Tremor and Bradykinesia Quantification.IEEE J Biomed Health Inform. 2021 Apr;25(4):997-1005. doi: 10.1109/JBHI.2020.3009319. Epub 2021 Apr 6. IEEE J Biomed Health Inform. 2021. PMID: 32750961
-
Continuous home monitoring of Parkinson's disease using inertial sensors: A systematic review.PLoS One. 2021 Feb 4;16(2):e0246528. doi: 10.1371/journal.pone.0246528. eCollection 2021. PLoS One. 2021. PMID: 33539481 Free PMC article.
-
Wearable inertial sensors for human movement analysis: a five-year update.Expert Rev Med Devices. 2021 Dec;18(sup1):79-94. doi: 10.1080/17434440.2021.1988849. Epub 2021 Oct 12. Expert Rev Med Devices. 2021. PMID: 34601995 Review.
Cited by
-
The pattern of alternative splicing in lung adenocarcinoma shows novel events correlated with tumorigenesis and immune microenvironment.BMC Pulm Med. 2021 Dec 6;21(1):400. doi: 10.1186/s12890-021-01776-0. BMC Pulm Med. 2021. PMID: 34872548 Free PMC article.
-
A Wearable System to Objectify Assessment of Motor Tasks for Supporting Parkinson's Disease Diagnosis.Sensors (Basel). 2020 May 5;20(9):2630. doi: 10.3390/s20092630. Sensors (Basel). 2020. PMID: 32380675 Free PMC article.
-
Wearable Accelerometer and Gyroscope Sensors for Estimating the Severity of Essential Tremor.IEEE J Transl Eng Health Med. 2023 Nov 1;12:194-203. doi: 10.1109/JTEHM.2023.3329344. eCollection 2024. IEEE J Transl Eng Health Med. 2023. PMID: 38196822 Free PMC article.
-
Pathway to Regulatory Approval of Digital Health Technologies in Progressive Supranuclear Palsy: A Scoping Review.Brain Sci. 2025 May 29;15(6):587. doi: 10.3390/brainsci15060587. Brain Sci. 2025. PMID: 40563759 Free PMC article. Review.
-
Visualizing and Evaluating Finger Movement Using Combined Acceleration and Contact-Force Sensors: A Proof-of-Concept Study.Sensors (Basel). 2021 Mar 9;21(5):1918. doi: 10.3390/s21051918. Sensors (Basel). 2021. PMID: 33803456 Free PMC article.
References
-
- MDS UPDRS Rating Scale. [(accessed on 31 January 2019)]; Available online: https://www.movementdisorders.org/MDS-Files1/PDFs/Rating-Scales/MDS-UPDR....
-
- Lin Z., Xiong Y., Cai G., Dai H., Xia X., Tan Y., Lueth T.C. Quantification of Parkinsonian Bradykinesia Based on Axis-Angle Representation and SVM Multiclass Classification Method. IEEE Access. 2018;6:26895–26903. doi: 10.1109/ACCESS.2018.2835463. - DOI
-
- Lainscsek C., Rowat P., Schettino L., Lee D., Song D., Letellier C., Poizner H. Finger tapping movements of Parkinson’s disease patients automatically rated using nonlinear delay differential equations. Chaos An Interdiscip. J. Nonlinear Sci. 2012;22:013119. doi: 10.1063/1.3683444. - DOI - PMC - PubMed
MeSH terms
Grants and funding
LinkOut - more resources
Full Text Sources
