. 2019 Jun 17;11(6):560.
doi: 10.3390/v11060560.

Establishment of a Cell Culture Model of Persistent Flaviviral Infection: Usutu Virus Shows Sustained Replication during Passages and Resistance to Extinction by Antiviral Nucleosides

Affiliations

Establishment of a Cell Culture Model of Persistent Flaviviral Infection: Usutu Virus Shows Sustained Replication during Passages and Resistance to Extinction by Antiviral Nucleosides

Raquel Navarro Sempere et al. Viruses. .

Abstract

Chronic viral disease constitutes a major global health problem, with several hundred million people affected and an associated elevated number of deaths. An increasing number of disorders caused by human flaviviruses are related to their capacity to establish a persistent infection. Here we show that Usutu virus (USUV), an emerging zoonotic flavivirus linked to sporadic neurologic disease in humans, can establish a persistent infection in cell culture. Two independent lineages of Vero cells surviving USUV lytic infection were cultured over 82 days (41 cell transfers) without any apparent cytopathology crisis associated. We found elevated titers in the supernatant of these cells, with modest fluctuations during passages but no overall tendency towards increased or decreased infectivity. In addition to full-length genomes, viral RNA isolated from these cells at passage 40 revealed the presence of defective genomes, containing different deletions at the 5' end. These truncated transcripts were all predicted to encode shorter polyprotein products lacking membrane and envelope structural proteins, and most of non-structural protein 1. Treatment with different broad-range antiviral nucleosides revealed that USUV is sensitive to these compounds in the context of a persistent infection, in agreement with previous observations during lytic infections. The exposure of infected cells to prolonged treatment (10 days) with favipiravir and/or ribavirin resulted in the complete clearance of infectivity in the cellular supernatants (decrease of ~5 log10 in virus titers and RNA levels), although modest changes in intracellular viral RNA levels were recorded (<2 log10 decrease). Drug withdrawal after treatment day 10 resulted in a relapse in virus titers. These results encourage the use of persistently-infected cultures as a surrogate system in the identification of improved antivirals against flaviviral chronic disease.

Keywords: antiviral therapies; chronic viral infection; defective viral genomes; emerging arboviruses; lethal mutagenesis.


Conflict of interest statement

We declare no conflict of interest. The funders had no role in the design of the study; in the collection, analyses, or interpretation of data; in the writing of the manuscript, or in the decision to publish the results.

Figures
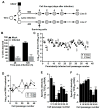
Figure 1
Figure 1
Establishment of cell culture systems of persistent Usutu virus (USUV) infection. (A) Schematic representation of the procedure followed to the establishment and maintenance of Vero cells persistently infected with USUV. Uninfected cells are represented as white circles, persistently-infected cells as grey circles, and cell passages with thick arrows. Vero cell monolayers are infected with USUV (black square) at an MOI of 0.01. At 48 (V cells) or 96 h (S cells), unattached dead cells are removed and the surviving cells cultured in fresh media. Cells are passaged every 48 h using standard procedures. (B) Percentage of cells that remain attached to a 16-mm dish at 48 or 120 h after USUV (grey) or mock infection (black). These values are relative of mock-infected cells at 48 h post-infection. (C) USUV titers in persistently-infected cells along passages. Viral titers in S cells supernatants are represented as black circles, V cells as white squares. (D) Viral RNA in cell supernatants of V (white squares) and S cells (black circles) along passages. The number of molecules in each passage was determined by qPCR using primers targeting the Env-coding region. (E) and (F), USUV specific infectivity in the supernatant of V (E) and S cells (F). Specific infectivity is determined as the ratio between infectious units (TCID50) and the number of viral genome equivalents detected in the samples. Statistically significant differences are represented by asterisks (*** p < 0.001). Two-way ANOVA test.
Figure 2
Figure 2
USUV genomes containing large deletions in the 5’ end are detected in persistently-infected cells. (A) Schematic representation of USUV genome, PCR amplification strategy, and deletions identified. Top panel, illustration of USUV genome. Each box represents a different viral protein-coding region. White boxes represent genomic sequences encoding structural proteins (C, capsid; M, membrane protein; PrM, M precursor; Env, envelope) and grey boxes depict non-structural proteins (NS1 to NS5). Different deletions are indicated by a thick dark grey line below the corresponding truncated sequence. Bottom panel, PCR amplification strategy (only shown those corresponding to PCR gel analyses below). Each predicted amplicon is represented as a thick light grey line (I to VI). B and C, amplification products of viral RNA extracted from persistently-infected cells at passage 40 (p40) or cells infected with wild type USUV (p1). Amplification of viral RNA from S (B) and V cells (C) and compared to USUV wild type. The amplification products were run on a 1.5% agarose gel in the presence of 0.5× TBE for 35 min. PCR bands in persistently-infected cells (p40) of lower molecular mass than those found in the standard genome (p1) are indicated with an arrow. Viral RNA from S p40 (B) amplified with primers spanning residues 818 to 3359 (amplicon V) revealed the presence of a new deletion product (~1.5-Kb shorter than in wild type virus). This new truncation was not apparent in larger amplification products (amplicons I, III, and IV). (D) Detail on USUV genomic sequences surrounding the deletion sites. The deleted sequences are represented between brackets. Nucleotide positions immediately upstream and downstream of the deleted sequence are numbered according to reference USUV sequence AY453411. There is no apparent homology in the genomic regions surrounding the nucleotides at the joining site, except for the first sequence provided, with putative identities underlined.
Figure 3
Figure 3
Detection of defective viral genomes in persistently-infected cells. (A) Illustration of USUV genome and target sequence sites for different qPCR strategies. Different deletions found in V and S defective genomes are shown as thick dark grey lines, and a square indicates the common deleted region in these different sequences. The procedures for each qPCR detection method are described in Materials and Methods. Methods for the detection of non-structural protein 5 (NS5)-coding region are used for the quantification of total viral RNA molecules (including both standard and truncated viral genomes). Methods for the detection of the Env-coding region are used for the specific detection of standard genomes (excluding defective genomes). (B,C) Intracellular detection of viral RNA. B, quantification of intracellular viral RNA in lytically- and persistently-infected cells using qPCR detection methods for Env (black bars) or NS5 (grey bars) coding regions. Each bar represents the average of values obtained from independent cell monolayers (n > 5). (C) Estimated ratio of standard length genomes in the sample (viral RNA molecules detected with Env relative to NS5, based on results shown in (B). (D,E) Same as in B and C but in samples extracted from cellular supernatants (n > 3). (D) Quantification of extracellular viral RNA using qPCR detection methods for Env (black bars) or NS5 (grey bars) coding regions. Each bar represents the average of values obtained from independent cell monolayers (n > 5). (E) Estimated proportion of full-length genomes in the supernatant of V and S cells at p40, and Vero cells infected with wild type USUV. (F) Proportion of full-length genomes in the supernatants of S and V cells along passages. Statistically significant differences are represented by asterisks (* p < 0.05, ** p < 0.01, *** p < 0.001). B and D, one-way ANOVA test. C and E, two-way ANOVA test.
Figure 4
Figure 4
Antiviral nucleosides inhibit USUV persistent infection in Vero cells. A-D, Cellular toxicity displayed by different nucleoside drugs was tested upon V p39 (grey triangles), S p39 (grey circles), and uninfected Vero cells (black squares), using the CellTiter–Blue Cell viability assay (Promega), which accounts for living cells. Cellular viability was measured in cells treated with increasing concentrations of 5-fluorouracil (FU) (A), favipiravir (FAV) (B), ribavirin (RBV) (C), or FAV + RBV (D) at 48 h and represented as a relative value to untreated cells (n = 3). (E,F) Viral titers recovered in V p39 (grey triangles), S p39 (grey circles), and lytically-infected Vero cells (black squares), after 48h in the presence of nucleoside drug analogues. Values observed in cells treated with increasing concentrations of FU (E), FAV (F), RBV (G), or FAV + RBV (H). To this assay, naïve uninfected Vero cells (black squares) were inoculated with wild type USUV at an MOI of 0.01, and after adsorption the cells were treated with drugs for 48 h. Persistently-infected V p39 and S p39 were directly treated with drugs for 48 h. Every time point is the average of three (n =3) biological replicas (±SEM). In FAV + RBV graphs (D,H) the ordinate values represent the concentration for each drug individually (e.g. 400 µM refers to a cocktail of 400 µM FAV and 400 µM RBV, or 800 µM nucleosides).
Figure 5
Figure 5
Treatment with FAV, RBV, or a combination of both can cause complete loss of infectivity in cell supernatants. (A) Schematic representation of the experimental procedure. For each treatment, six independent monolayers of S p39 cells were seeded (n = 6). Whole monolayers (RNA extraction) and supernatants (RNA and virus titers) of untreated or treated cells were collected at days 2, 4, 6, 8, and 10 (n = 1). (B) Virus infectivity in S p39 cells treated with FAV, RBV, or a cocktail of both drugs (F + R) at 2000 µM each drug. A dotted line represents the limit of detection. (C) Virus titers recovered after a blind infection in naïve Vero cells using 100 µL of S p39 cell supernatants obtained in B after treatment. Those samples containing undetectable virus levels (dashed line) remained negative when two additional blind passages in Vero cells were performed (not shown). (D,E) Viral RNA levels in the supernatants of treated cells, using qPCR methods based on the detection of NS5- (D) and Env-coding regions (E). (F,G) Specific infectivity (SI) of USUV genomes detected in the cellular supernatants of treated cells. SI is calculated as the ratio of infectious units (B) to viral RNA molecules (D and E). SI based on qPCR methods for the detection of NS5 (F) or Env (G) genes.
Figure 6
Figure 6
USUV infectivity re-emerges in the supernatant of persistently-infected cells after drug withdrawal. (A) Experimental procedure. Cells were treated for 10 days in the presence of FAV, RBV, or a combination of both (F + R) at a concentration of 2000 µM for each drug (n = 1). After 10 days, drugs were removed and cells cultured for 3 (FAV and RBV) or 7 additional days (F + R). (B) Viral infectivity (TCID50/mL) detected in the supernatant of cells after 10-day drug treatment followed by 3 days in the absence of drugs. (C) Viral infectivity recovered after three serial passages of cellular supernatants collected in B. In each blind infection, 100 µL of supernatant from the previous passage was used to infect a new monolayer of Vero cells. After adsorption for 1 hour, fresh media was added and cells were incubated for 24 additional hours at 37 °C. (D) Viral infectivity (±SEM) in the supernatant of S cells treated with F + R for 10 days followed by absence of treatment for 3, 5, and 7 days. (B–D) A dashed line represents the limit of detection.
Figure 7
Figure 7
Intracellular viral RNA detected in S p39 persistently-infected cells treated with antiviral drugs. These RNA extracts were obtained from the experiment represented in Figure 5A. Viral RNA levels detected in whole cell monolayer extracts after treatment with FAV, RBV, or a combination of both drugs (F + R) at a concentration of 2000 µM for each drug. For each treatment regime, 6 independent wells were seeded (n = 6) and samples were collected at different time points (n = 1). Quantitative PCR (qPCR) methods, based on the detection of NS5- (A) and Env-coding regions (B) are used. A dashed line represents the limit of detection.

Similar articles

Cited by

References

    1. Virgin H.W., Wherry E.J., Ahmed R. Redefining chronic viral infection. Cell. 2009;138:30–50. doi: 10.1016/j.cell.2009.06.036. - DOI - PubMed
    1. Murali A.R., Kotwal V., Chawla S. Chronic hepatitis E: A brief review. World J. Hepatol. 2015;7:2194–2201. doi: 10.4254/wjh.v7.i19.2194. - DOI - PMC - PubMed
    1. Mohamed A.A., Elbedewy T.A., El-Serafy M., El-Toukhy N., Ahmed W., El Din Z.A. Hepatitis C virus: A global view. World J. Hepatol. 2015;7:2676–2680. doi: 10.4254/wjh.v7.i26.2676. - DOI - PMC - PubMed
    1. Woodward J., Gkrania-Klotsas E., Kumararatne D. Chronic norovirus infection and common variable immunodeficiency. Clin. Exp. Immunol. 2017;188:363–370. doi: 10.1111/cei.12884. - DOI - PMC - PubMed
    1. Capizzi T., Makari-Judson G., Steingart R., Mertens W.C. Chronic diarrhea associated with persistent norovirus excretion in patients with chronic lymphocytic leukemia: Report of two cases. BMC Infect. Dis. 2011;11:131. doi: 10.1186/1471-2334-11-131. - DOI - PMC - PubMed

Publication types

MeSH terms

Supplementary concepts