. 2019 Jun 17;17(6):360.
doi: 10.3390/md17060360.

Hirsutanol A Attenuates Lipopolysaccharide-Mediated Matrix Metalloproteinase 9 Expression and Cytokines Production and Improves Endotoxemia-Induced Acute Sickness Behavior and Acute Lung Injury

Affiliations

Hirsutanol A Attenuates Lipopolysaccharide-Mediated Matrix Metalloproteinase 9 Expression and Cytokines Production and Improves Endotoxemia-Induced Acute Sickness Behavior and Acute Lung Injury

Jing-Shiun Jan et al. Mar Drugs. .

Abstract

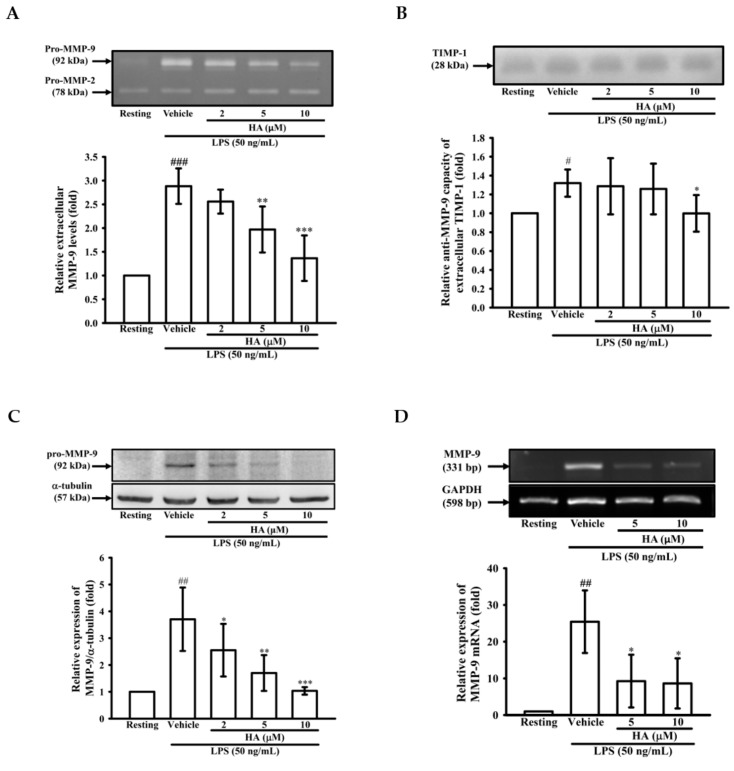
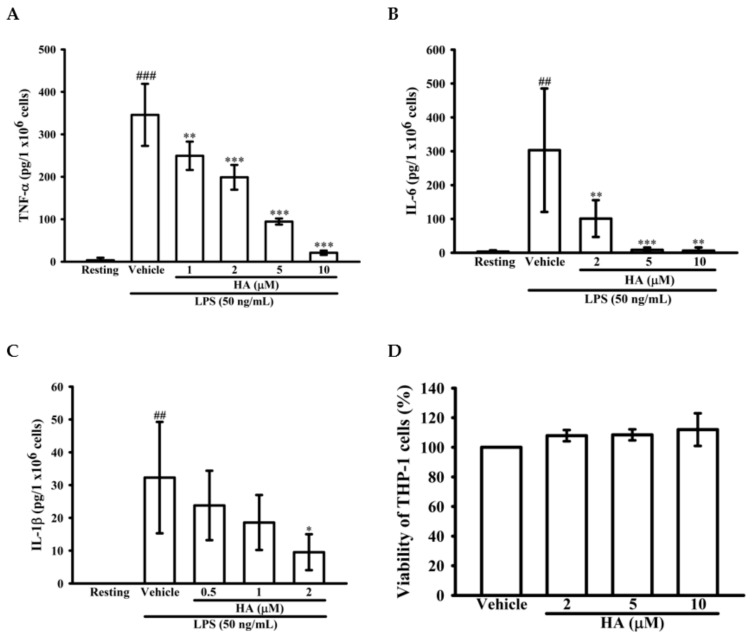
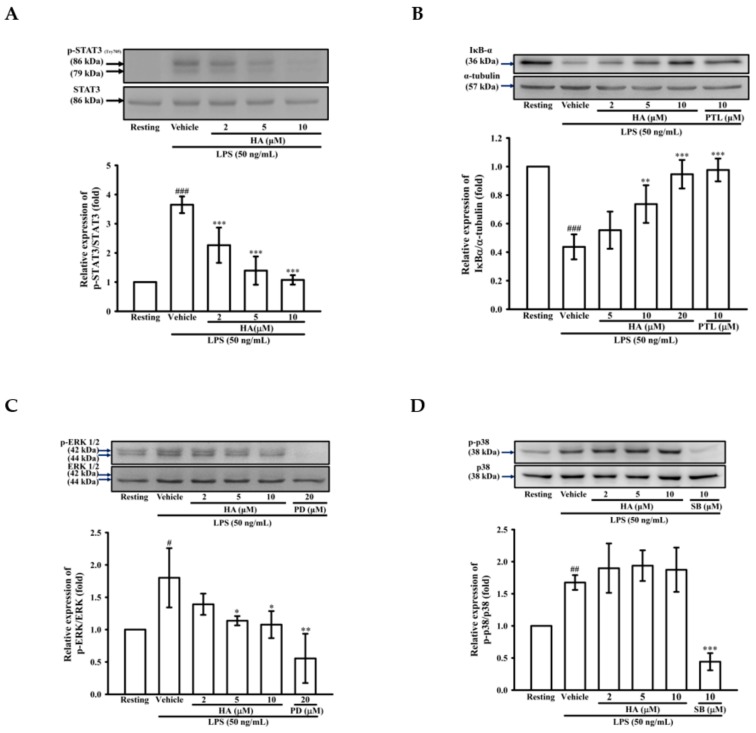
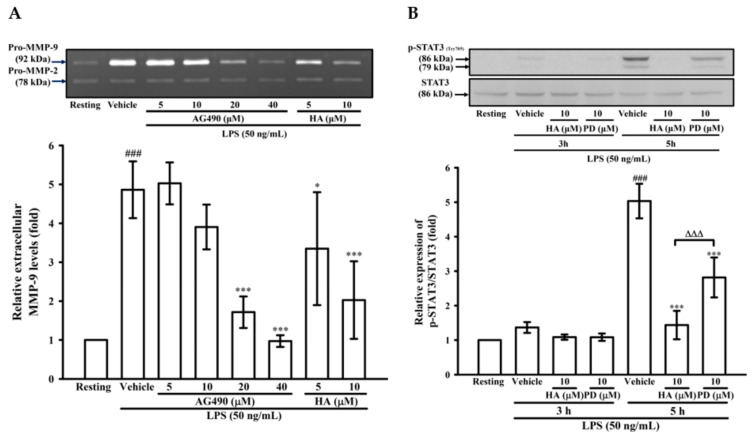
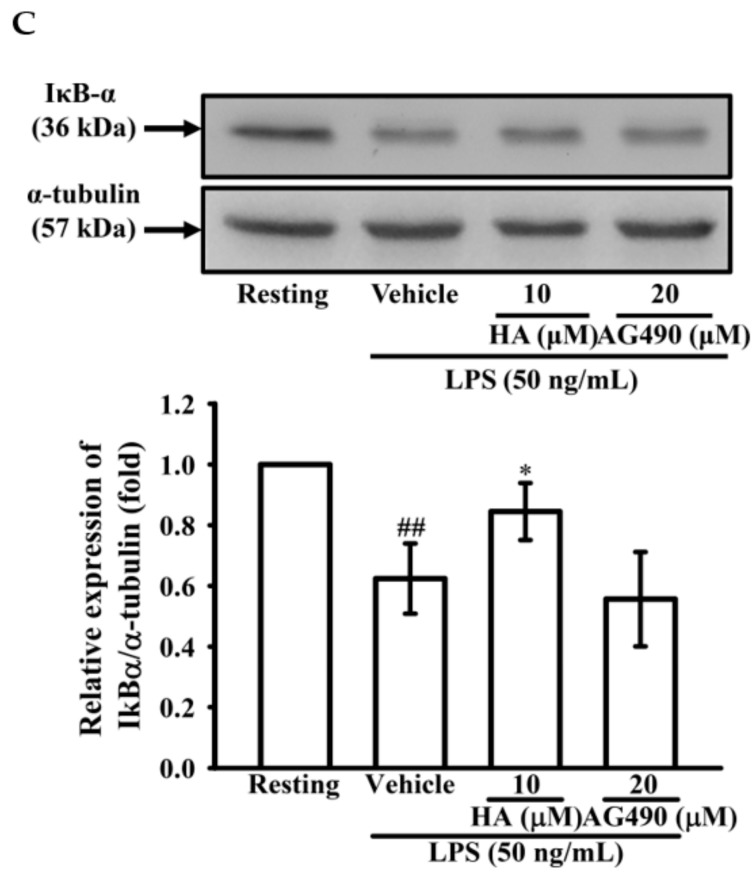
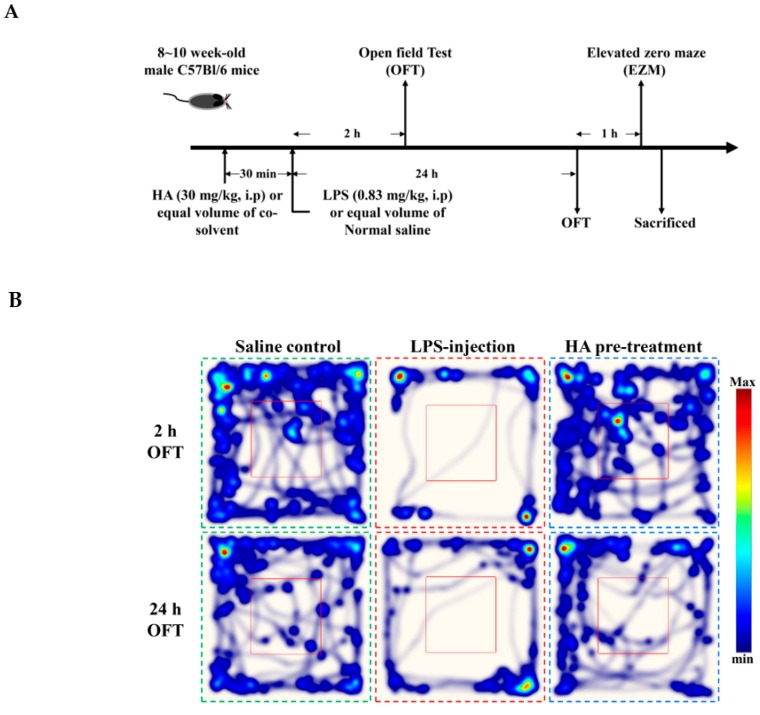
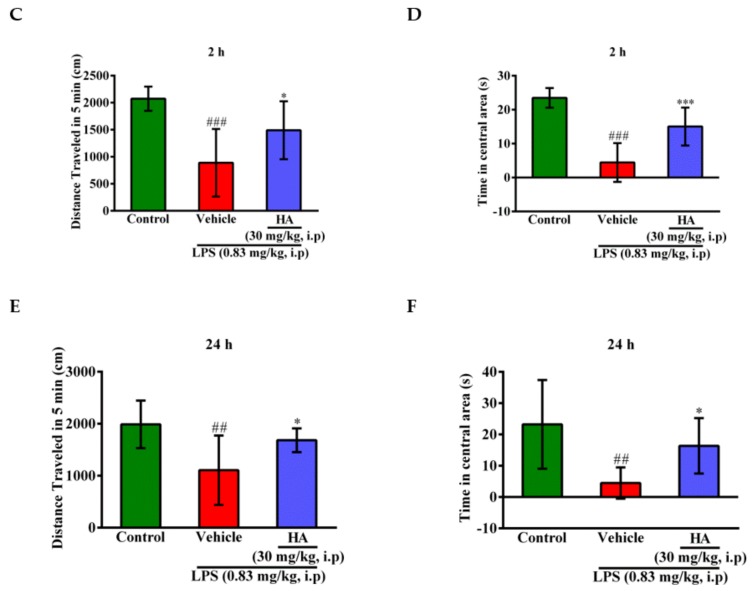
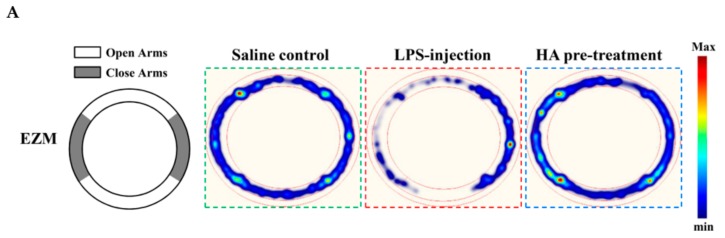
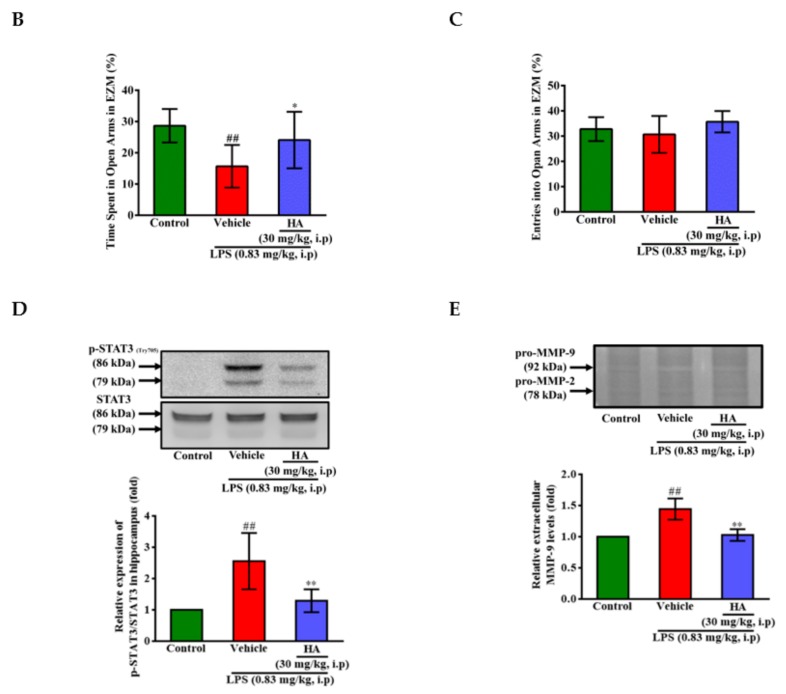
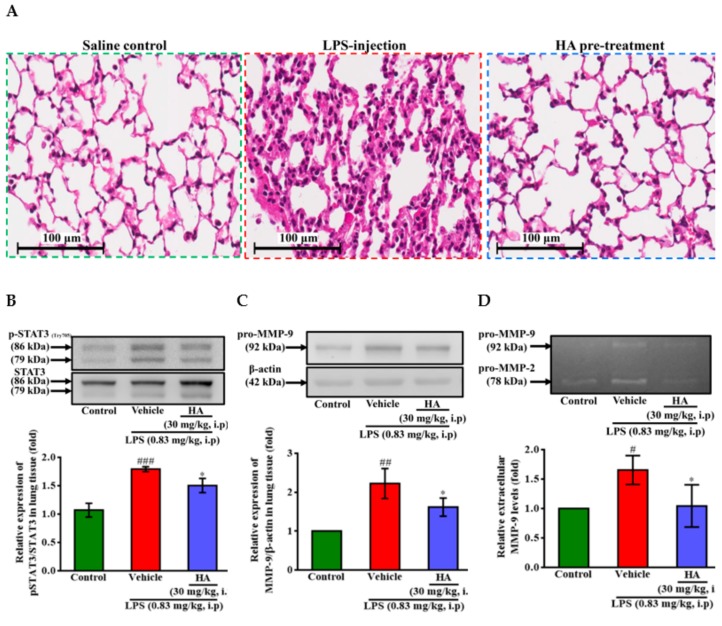
Activated human monocytes/macrophages, which increase the levels of matrix metalloproteinases (MMPs) and pro-inflammatory cytokines, are the essential mechanisms for the progression of sepsis. In the present study, we determined the functions and mechanisms of hirsutanolA (HA), which is isolated from the red alga-derived marine fungus Chondrostereum sp. NTOU4196, on the production of pro-inflammatory mediators produced from lipopolysaccharide (LPS)-treated THP-1 cells. Our results showed that HA suppressed LPS-triggered MMP-9-mediated gelatinolysis and expression of protein and mRNA in a concentration-dependent manner without effects on TIMP-1 activity. Also, HA significantly attenuated the levels of TNF-α, IL-6, and IL-1β from LPS-treated THP-1 cells. Moreover, HA significantly inhibited LPS-mediated STAT3 (Tyr705) phosphorylation, IκBα degradation and ERK1/2 activation in THP-1 cells. In an LPS-induced endotoxemia mouse model, studies indicated that HA pretreatment improved endotoxemia-induced acute sickness behavior, including acute motor deficits and anxiety-like behavior. HA also attenuated LPS-induced phospho-STAT3 and pro-MMP-9 activity in the hippocampus. Notably, HA reduced pathologic lung injury features, including interstitial tissue edema, infiltration of inflammatory cells and alveolar collapse. Likewise, HA suppressed the induction of phospho-STAT3 and pro-MMP-9 in lung tissues. In conclusion, our results provide pharmacological evidence that HA could be a useful agent for treating inflammatory diseases, including sepsis.

Keywords: Interleukin (IL); Lipopolysaccharide (LPS); acute lung injury (ALI); acute sickness behavior; matrix metalloproteinases-9 (MMP-9); signal transducer and activator of transcription 3 (STAT3).


Conflict of interest statement

The authors declare no conflict of interest.

Figures

Figure 1
Figure 1
Effect of HA on MMP-9-mediated gelatinolysis and expression induced by LPS. THP-1 cells (5 × 10⁵ cells/0.5 mL) were dispensed onto 24-well plates and treated with LPS (50 ng/mL) for 24 h. Cells were treated with the indicated concentrations of HA (2, 5 and 10 μM) or vehicle for 15 min before treatment with a stimulant. Cell-free supernatants were then assayed for MMPs and TIMP-1 activity by gelatin zymography (A) and reverse zymography (B). THP-1 cells (106 cells/mL) were dispensed onto 6-well plates and were treated with LPS (50 ng/mL) for 24 h (C) or 8 h (D) at the indicated concentrations of HA or vehicle for 15 min before treatment with LPS. Cell lysates were obtained and analyzed for MMP-9 protein expression by Western blotting or for MMP-9 mRNA expression by RT-PCR. Data represent means ± S.D. from three independent experiments. # p < 0.05, ## p < 0.01 and ### p < 0.001 as compared with the resting, * p < 0.05, ** p < 0.01 and *** p < 0.001 as compared with the vehicle.
Figure 2
Figure 2
Effect of HA on pro-inflammatory cytokines production induced by LPS in THP-1 cells without cellular toxicity. THP-1 cells (5 × 10⁵ cells/0.5 mL) were dispensed onto 24-well plates and were treated with the indicated concentrations of HA or vehicle for 15 min followed by treatment with LPS (50 ng/mL) for 4 h (A) and 24 h (B,C). Cell-free supernatants were then assayed for the level of TNF-α (A), IL-6 (B) and IL-1β (C) by ELISA. (D) THP-1 cells treated with the indicated concentrations of HA or vehicle for 24 h. Cell viability was quantified by the ability of mitochondria to reduce the tetrazolium dye MTT in viable cells. Data represent means ± S.D. from three independent experiments. ## p < 0.01 and ### p < 0.001 as compared with the resting; * p < 0.05, ** p < 0.01 and *** p < 0.001 as compared with the vehicle.
Figure 3
Figure 3
Effect of HA on STAT3, MAPK and NF-κB activation induced by LPS in THP-1 cells. THP-1 cells (106 cells/mL) were dispensed onto 6-well plates and were treated with the indicated concentrations of HA (2, 5 and 10 μM), parthenolide (PTL, 10 μM), PD98059 (PD, 20 μM), SB203580 (SB, 10 μM) or vehicle followed by treatment of LPS (50 ng/mL) for 24 h (A), 60 min (B), and 30 min (C,D), respectively. Cell lysates were obtained and analyzed for IκBα degradation and the level of phosphorylated-STAT3, ERK and p38 MAPK by Western blotting. Data represent means ± S.D. from three independent experiments. # p < 0.05, ## p < 0.01 and ### p < 0.001 as compared with the resting; * p < 0.05, ** p < 0.01 and *** p < 0.001 as compared with the vehicle.
Figure 4
Figure 4
Effect of JAK2-STAT3 cascade inhibition on LPS-mediated MMP-9 expression. THP-1 cells (5 × 10⁵ cells/0.5 mL) were dispensed onto 24-well plates and treated with LPS (50 ng/mL) for 24 h. Cells were treated with the indicated concentrations of AG490 (5, 10, 20, and 40 μM), HA (5 and 10 μM) or vehicle for 15 min before treatment with LPS. Cell-free supernatants were then assayed for MMPs activity by gelatin zymography (A). THP-1 cells (106 cells/mL) were dispensed onto 6-well plates and were treated with LPS (50 ng/mL) for 3 h, 5h (B) and 60 min (C) at the indicated concentrations of HA, PD (10 μM), AG490 (10 μM) or vehicle for 15 min before treatment with LPS. Cell lysates were obtained and analyzed for STAT3 (Tyr705) phosphorylation and IκBα degradation by Western blotting. Data represent means ± S.D. from three to four independent experiments, respectively. ## p < 0.01 and ### p < 0.001 as compared with the resting; * p < 0.05 and *** p < 0.001 as compared with the vehicle; ∆∆∆ p < 0.001 as compared with the group pretreated with HA pre-treatment.
Figure 4
Figure 4
Effect of JAK2-STAT3 cascade inhibition on LPS-mediated MMP-9 expression. THP-1 cells (5 × 10⁵ cells/0.5 mL) were dispensed onto 24-well plates and treated with LPS (50 ng/mL) for 24 h. Cells were treated with the indicated concentrations of AG490 (5, 10, 20, and 40 μM), HA (5 and 10 μM) or vehicle for 15 min before treatment with LPS. Cell-free supernatants were then assayed for MMPs activity by gelatin zymography (A). THP-1 cells (106 cells/mL) were dispensed onto 6-well plates and were treated with LPS (50 ng/mL) for 3 h, 5h (B) and 60 min (C) at the indicated concentrations of HA, PD (10 μM), AG490 (10 μM) or vehicle for 15 min before treatment with LPS. Cell lysates were obtained and analyzed for STAT3 (Tyr705) phosphorylation and IκBα degradation by Western blotting. Data represent means ± S.D. from three to four independent experiments, respectively. ## p < 0.01 and ### p < 0.001 as compared with the resting; * p < 0.05 and *** p < 0.001 as compared with the vehicle; ∆∆∆ p < 0.001 as compared with the group pretreated with HA pre-treatment.
Figure 5
Figure 5
Effect of HA on sickness behavior in the open field test following a systemic LPS challenge. (A) Experimental timeline and design. (B) Heat-map represented the tracks of mice in the different groups in OFT, red = more time, blue = less time. (C) Total distance traveled 5 min in the different groups administrated with sterile saline or LPS (0.83 mg/kg, i.p) for 2 h. (D) Percentage of time spent in 5 min in the open area in the different groups for 2 h. (E) Total distance traveled 5 min in the different groups challenged with sterile saline or LPS (0.83 mg/kg, i.p) for 24 h. (F) Percentage of time spent in 5 min in the central area in the different groups for 24 h. Data represent group means ± S.D., n = 7 mice/group. ## p < 0.01 and ### p < 0.001 as compared with the saline control group (Control); * p < 0.05 and *** p < 0.001 as compared with the co-solvent group (vehicle).
Figure 5
Figure 5
Effect of HA on sickness behavior in the open field test following a systemic LPS challenge. (A) Experimental timeline and design. (B) Heat-map represented the tracks of mice in the different groups in OFT, red = more time, blue = less time. (C) Total distance traveled 5 min in the different groups administrated with sterile saline or LPS (0.83 mg/kg, i.p) for 2 h. (D) Percentage of time spent in 5 min in the open area in the different groups for 2 h. (E) Total distance traveled 5 min in the different groups challenged with sterile saline or LPS (0.83 mg/kg, i.p) for 24 h. (F) Percentage of time spent in 5 min in the central area in the different groups for 24 h. Data represent group means ± S.D., n = 7 mice/group. ## p < 0.01 and ### p < 0.001 as compared with the saline control group (Control); * p < 0.05 and *** p < 0.001 as compared with the co-solvent group (vehicle).
Figure 6
Figure 6
Effect of HA on anxiety-like behavior in the elevated zero maze test, and the expression of phospho-STAT3 and MMP-9 in the hippocampus following systemic LPS challenge. (A) The structure diagram of EZM was described as the left panel. Heat-map illustrated the tracks of mice in the different groups in EZM test, red = more time, blue = less time. (B) Percentage of time spent in 5 min in the open arms (gray) in the different groups administrated with sterile saline or LPS (0.83 mg/kg, i.p) for 25 h. (C) Percentage of entries into the open arms in 5 min in the different groups for 25 h. Mice were sacrificed after behavior tests, and then hippocampus was collected immediately. Homogenates of the hippocampus were obtained and analyzed for the phosphorylation of STAT3 by Western blotting (D, n = 5), and assayed for MMPs activity by gelatin zymography (E, n = 3). Data represent group means ± S.D., n = 3 to 7 mice/group. ## p < 0.01 as compared with the saline control group (Control); * p < 0.05 and ** p < 0.01 as compared with the co-solvent group (vehicle).
Figure 6
Figure 6
Effect of HA on anxiety-like behavior in the elevated zero maze test, and the expression of phospho-STAT3 and MMP-9 in the hippocampus following systemic LPS challenge. (A) The structure diagram of EZM was described as the left panel. Heat-map illustrated the tracks of mice in the different groups in EZM test, red = more time, blue = less time. (B) Percentage of time spent in 5 min in the open arms (gray) in the different groups administrated with sterile saline or LPS (0.83 mg/kg, i.p) for 25 h. (C) Percentage of entries into the open arms in 5 min in the different groups for 25 h. Mice were sacrificed after behavior tests, and then hippocampus was collected immediately. Homogenates of the hippocampus were obtained and analyzed for the phosphorylation of STAT3 by Western blotting (D, n = 5), and assayed for MMPs activity by gelatin zymography (E, n = 3). Data represent group means ± S.D., n = 3 to 7 mice/group. ## p < 0.01 as compared with the saline control group (Control); * p < 0.05 and ** p < 0.01 as compared with the co-solvent group (vehicle).
Figure 7
Figure 7
Effect of HA on LPS-mediated histopathological changes and the production of phospho-STAT3 and MMP-9 in lung tissues and BALF. Mice in the different groups administrated with sterile saline or LPS (0.83 mg/kg, i.p) which were sacrificed after behavior tests, and then BALF and lung tissues were collected immediately for following experiments. (A) Representative hematoxylin and eosin (H&E)-stained sections of right lung lobes at 400 × original magnification showed exaggerated acute inflammatory infiltration, alveoli destruction and interstitial edema in LPS group (scale bar = 100 µm). Homogenates of the left lung lobes were obtained and analyzed for the expression of phospho-STAT3 (B) and pro-MMP-9 (C, n = 3) by Western blotting, and assayed for MMPs activity in BALF by gelatin zymography (D, n = 3). Data represent group means ± S.D., n = 3 to 7 mice/group. # p < 0.05, ## p < 0.01 and ### p < 0.001 as compared with the saline control group (Control); * p < 0.05 as compared with the co-solvent group (vehicle).

References

    1. Singer M., Deutschman C.S., Seymour C.W., Shankar-Hari M., Annane D., Bauer M., Bellomo R., Bernard G.R., Chiche J.D., Coopersmith C.M., et al. The Third International Consensus Definitions for Sepsis and Septic Shock (Sepsis-3) JAMA. 2016;315:801–810. doi: 10.1001/jama.2016.0287. - DOI - PMC - PubMed
    1. Rhodes A., Evans L.E., Alhazzani W., Levy M.M., Antonelli M., Ferrer R., Kumar A., Sevransky J.E., Sprung C.L., Nunnally M.E., et al. Surviving Sepsis Campaign: International Guidelines for Management of Sepsis and Septic Shock: 2016. Intensive Care Med. 2017;43:304–377. doi: 10.1007/s00134-017-4683-6. - DOI - PubMed
    1. Prescott H.C., Angus D.C. Enhancing Recovery From Sepsis: A Review. JAMA. 2018;319:62–75. doi: 10.1001/jama.2017.17687. - DOI - PMC - PubMed
    1. Kaukonen K.M., Bailey M., Suzuki S., Pilcher D., Bellomo R. Mortality related to severe sepsis and septic shock among critically ill patients in Australia and New Zealand, 2000–2012. JAMA. 2014;311:1308–1316. doi: 10.1001/jama.2014.2637. - DOI - PubMed
    1. Marik P.E. Surviving sepsis: Going beyond the guidelines. Ann. Intensive Care. 2011;1:17. doi: 10.1186/2110-5820-1-17. - DOI - PMC - PubMed

MeSH terms