. 2019 Aug;212(4):1205-1225.
doi: 10.1534/genetics.119.302371. Epub 2019 Jun 18.

Sit4 and PP2A Dephosphorylate Nitrogen Catabolite Repression-Sensitive Gln3 When TorC1 Is Up- as Well as Downregulated

Affiliations

Sit4 and PP2A Dephosphorylate Nitrogen Catabolite Repression-Sensitive Gln3 When TorC1 Is Up- as Well as Downregulated

Jennifer J Tate et al. Genetics. 2019 Aug.

Abstract

Saccharomyces cerevisiae lives in boom and bust nutritional environments. Sophisticated regulatory systems have evolved to rapidly cope with these changes while preserving intracellular homeostasis. Target of Rapamycin Complex 1 (TorC1), is a serine/threonine kinase complex and a principle nitrogen-responsive regulator. TorC1 is activated by excess nitrogen and downregulated by limiting nitrogen. Two of TorC1's many downstream targets are Gln3 and Gat1-GATA-family transcription activators-whose localization and function are Nitrogen Catabolite Repression- (NCR-) sensitive. In nitrogen replete environments, TorC1 is activated, thereby inhibiting the PTap42-Sit4 and PTap42-PP2A (Pph21/Pph22-Tpd3, Pph21,22-Rts1/Cdc55) phosphatase complexes. Gln3 is phosphorylated, sequestered in the cytoplasm and NCR-sensitive transcription repressed. In nitrogen-limiting conditions, TorC1 is downregulated and PTap42-Sit4 and PTap42-PP2A are active. They dephosphorylate Gln3, which dissociates from Ure2, relocates to the nucleus, and activates transcription. A paradoxical observation, however, led us to suspect that Gln3 control was more complex than appreciated, i.e., Sit4 dephosphorylates Gln3 more in excess than in limiting nitrogen conditions. This paradox motivated us to reinvestigate the roles of these phosphatases in Gln3 regulation. We discovered that: (i) Sit4 and PP2A actively function both in conditions where TorC1 is activated as well as down-regulated; (ii) nuclear Gln3 is more highly phosphorylated than when it is sequestered in the cytoplasm; (iii) in nitrogen-replete conditions, Gln3 relocates from the nucleus to the cytoplasm, where it is dephosphorylated by Sit4 and PP2A; and (iv) in nitrogen excess and limiting conditions, Sit4, PP2A, and Ure2 are all required to maintain cytoplasmic Gln3 in its dephosphorylated form.

Keywords: Gln3; PP2A; Sit4; TorC1; Ure2; nitrogen catabolite repression; rapamycin.


Figures

Figure 1
Figure 1
Simplified early description of TorC1 responses to replete and limiting nitrogen conditions, and, in turn, its downstream regulation of Gln3 by regulating Sit4 activity.
Figure 2
Figure 2
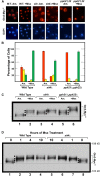
Effects of abolishing Sit4 or PP2A (Pph21/Pph22) activities on intracellular Gln3 localization and phosphorylation. (A and B) Wild type (JK9-3da), sit4Δ (FV029), and pph21Δ,pph22Δ (FV239) mutant cells, each transformed with wild type Gln3-Myc13 plasmid pRR536, were cultured in YNB-ammonia medium (Am.) to an A600nm ∼0.5. Methionine sulfoximine (+Msx; 2 mM) was then added to each culture, and, 30 min later, samples were collected and processed for indirect immunofluorescence microscopy. Gln3-Myc13 intracellular localization was then scored in images of each sample. The data are averages of four biological replicates for wild type, and three for each of the mutants, with SD of the measurements indicated as error bars. Illustrative images of the semiquantitative data shown by the histograms (B) are presented in (A). The details of cell processing for indirect immunofluorescence, image collection, and Gln3-Myc13 intracellular localization are described in Materials and Methods. Red bars indicate Gln3-Myc13 localized to only the cytoplasm; yellow bars indicate Gln3-Myc13 was located in both the cytoplasm and nucleus; green bars indicate that Gln3-Myc13 was localized exclusively to the nucleus (colocalizing with DAPI positive staining). (C). Wild-type and mutant cells were cultured as described in (A and B). Samples were then prepared and western blot analyses performed as described in Materials and Methods. In this and subsequent figures black dots have been used exclusively between lanes to facilitate identification, comparison and/or emphasis of individual Gln3-Myc13 species in the lanes adjacent to the dots. Black dots between one pair of lanes cannot always be moved a priori to a new pair of lanes, and remain accurate markers of the species’ mobilities in the second pair of lanes. The fine line across the bottom of the blot was placed to facilitate assessment of differences in the mobilities of the most rapidly migrating Gln3-Myc13 species in each condition. Species with slower mobility are indicative of increased phosphorylation, whereas those with faster mobility are indicative of decreased phosphorylation. (D) Wild type (TB123) and sit4Δ mutant (TB136-2a) cells were grown as described in (A–C). Untreated cells are designated as “0 hr of Msx treatment” (lanes 1 and 8). At the designated times thereafter, samples of each culture were collected and processed for western blot analysis.
Figure 3
Figure 3
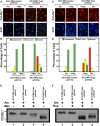
The loss of nuclear export results in constitutively nuclear Gln3 that is hyperphosphorylated. (A–D) Wild-type strain JK9-3da was transformed with Cen II-based plasmids containing either wild-type Gln3-Myc13 (pRR536) or the gln3 NES mutant (pRR752). Cells for (A and B) were cultured and treated as described in Figure 2, A and B. Cells for (C and D) were cultured in YNB-glutamine medium (Gln) to A600 nm ∼0.5. Cultures were then treated for 15 min with 200 nM rapamycin (+Rap). Sample preparation and data collection were as described in Materials and Methods and Figure 2, A and B. Data in (A–D) are averages of two and five biological replicates, respectively. SD of the measurements are indicated as error bars. (E and F) Wild-type (strain JK9-3da) transformants containing plasmid pRR536 or pRR752 were cultured as in (A–D). Samples were then collected and processed for western blot analyses as described in Materials and Methods.
Figure 4
Figure 4
Time course of Gln3-Myc13 phosphorylation in glutamine-grown wild type and sit4Δ cells. Wild type (TB123) and sit4Δ mutant (TB136-2a) cells were cultured in YNB-glutamine medium to A600nm =∼0.5. At that time the cells were gently collected on a Millipore filter, washed twice, and transferred to nitrogen-free YNB medium as described in Materials and Methods. Samples were then collected at the times indicated, and processed for western blot analysis. Predominant intracellular localizations of Gln3-Myc13 as previously reported (Tate and Cooper 2013); Cyto, cytoplasmic; N-C, nuclear-cytoplasmic, N, nuclear.
Figure 5
Figure 5
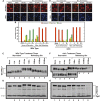
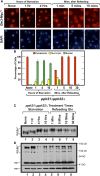
Time course of Gln3-Myc13 intracellular localization and Gln3-Myc13 phosphorylation in short- and long-term nitrogen starvation of wild-type (A and B left side, C and D) and sit4Δ mutant (B right side, E–G) cells followed by the refeeding of excess nitrogen. Wild-type (TB123) and sit4Δ mutant (TB136-2a) cells were pregrown in YNB-glutamine medium, then transferred to nitrogen-free medium and sampled as described for 1, 4, and 10 hr. After 10 hr of starvation, glutamine was added to a final concentration of 0.1%, and sampling continued at the indicated times. Wild-type and sit4Δ cultures were processed for indirect immunofluorescence imaging as described in Materials and Methods. Data in (B), left side are averages and SD derived from seven biological replicates of starvation, and three biological replicates for refeeding. For sit4Δ cells, four and two biological replicates, respectively, were used for the starvation and refeeding portions of the experiments. For each time point, data derived from wild type (B left side) vs. sit4Δ (B right side) were compared to ascertain whether there were significant, mutant-dependent differences in the outcomes. Since the number of cells scored in each sample varied (average = 248; SD = 29), it was necessary to generate P values by comparing the number of cells in each cellular compartment of wild-type cells (cytoplasmic, nuclear-cytoplasmic, nuclear) at each time point to those in each parallel cellular compartment of sit4Δ cells at each of the parallel time points using a three-way ANOVA with cell type, condition-time, and location as the main effects with all possible two- and three-way interactions included in the model. The calculated P values were: None (0.9999, 0.9999, 0.9999); Starvation 1 hr (<0.0001, <0.0001, <0.0001); Starvation 4 hr (<0.0001, 0.3000, <0.0001); Starvation 10 hr 0.9145, 0.9999, 0.8439; Refeeding 1 min (0.9284, 0.0108, 0.0139); Refeeding 5 min (0.8574, 0.999, 0.9999); Refeeding 10 min (0.0932, 0.1137, 0.9687); Refeeding 30 min (0.9046, 0.9522, 0.9999), respectively. Localizations were considered to be different if the observed P values were <0.05. Upper panels (C and F) data derived from a six percent acrylamide gel, whereas the lower panels (D and G) data derived from a parallel sample of the same culture, but electrophoresed for a shorter time in a 7% gel to maintain the loading control, Pgk1, within the gel. Molecular weight standards are indicated.
Figure 6
Figure 6
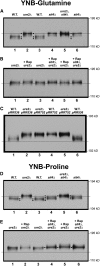
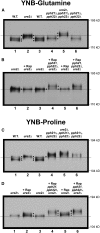
Gln3 phosphorylation levels in glutamine- or proline-grown wild type, sit4Δ single and sit4Δ,ure2Δ double-mutant cells in the presence (+Rap) or absence of rapamycin treatment. Wild type (TB123), sit4Δ (TB136-2a), ure2Δ (TB138-1a), and ure2Δ,sit4Δ (FV071) strains were grown to an A600nm ∼0.5 in YNB-glutamine (A–C) or YNB-proline (D and E). (B and E) Untreated cultures were sampled without addition of rapamycin or following 20 min incubation with 200 ng/ml rapamycin (+Rap). (C) Wild type (JK9-3da) or ure2Δ mutant (RR215) were transformed with wild-type (pRR536) or gln3 NES mutant (pRR752) plasmids and grown as described in (A). All samples were processed for western blot analysis as described in Materials and Methods.
Figure 7
Figure 7
Gln3 phosphorylation levels in glutamine- or proline-grown wild type, ure2Δ, or pph21Δ,pph22Δ double-mutant or pph21Δ,pph22Δ,ure2Δ triple-mutant cells in the presence or absence of rapamycin treatment. Wild type (TB123), and pph21Δ,pph22Δ (03705d), ure2Δ (TB138-1a) and pph21Δ,pph22Δ,ure2Δ (FV165) mutant strains were grown to an A600nm = ∼0.5 in YNB-glutamine (A and B) or YNB-proline (C and D). The untreated cultures were sampled without addition of rapamycin (A and C) or following 20 min incubation with 200 ng/ml rapamycin (+Rap) (B and D). The cultures were then sampled, and the samples processed for western blot analysis.
Figure 8
Figure 8
Effects of abolishing PP2A when Gln3 is restricted to the nucleus. Wild type (JK9-3da) and pph21Δ,pph22Δ (FV239) were transformed with pRR752 (NES Gln3-Myc13), and grown in ammonia medium in the presence or absence of Msx for 30 min. Sample collection and western blot analysis were as described in Materials and Methods. Upper panel data derived from a six percent acrylamide gel, whereas the lower panel data derived from a parallel sample of the same culture, but electrophoresed for a shorter time in a 7% gel to retain the loading control, Pgk1, within the gel.
Figure 9
Figure 9
(A–C) Time course of Gln3-Myc13 intracellular localization and Gln3-Myc13 phosphorylation during short- and long-term nitrogen starvation of pph21Δ,pph22Δ cells followed by refeeding of excess nitrogen (0.1% glutamine final concentration). These experiments were performed, and the data evaluated and presented as described in Figure 5, except that a pph21Δ,pph22Δ mutant (03705d) was used in place of the sit4Δ mutant strain. Data are averages, and SD of four biological replicates for starvation and two for refeeding. (D) A film that was exposed for a shorter period of time to facilitate evaluation of the loading control, Pgk1.
Figure 10
Figure 10
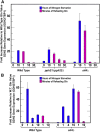
(A and B) GDH2 expression in response to short- and long-term nitrogen starvation and refeeding excess nitrogen. The format of the experiment was the same as in Figure 5. GDH2 and TBP1 mRNA concentrations were determined as described in Materials and Methods. Data presented are the averages of three biological replicates.
Figure 11
Figure 11
Schematic working summary of data investigating PP2A and Sit4 phosphatases in the regulation of Gln3 under repressive [glutamine (Gln), ammonia (Am.) as nitrogen source; red arrows or bars] or derepressive [proline (Pro) as nitrogen source, or following rapamycin or Msx treatment; green arrows)] conditions. The phosphate groups indicated in the diagram are only illustrative of relative degrees of phosphorylation. It is important to emphasize that the specific order of the depicted reactions are not known beyond the limits of the data and conclusions presented in the Discussion. Yellow and purple background highlighting indicates TorC1-dependent phosphatase regulation, whereas blue background highlighting indicatesTorC1-independent phosphatase regulation.

Similar articles

Cited by

References

    1. Beck T., Hall M. N., 1999. The TOR signalling pathway controls nuclear localization of nutrient-regulated transcription factors. Nature 402: 689–692. 10.1038/45287 - DOI - PubMed
    1. Bertram P. G., Choi J. H., Carvalho J., Ai W., Zeng C., et al. , 2000. Tripartite regulation of Gln3p by TOR, Ure2p, and phosphatases. J. Biol. Chem. 275: 35727–35733. 10.1074/jbc.M004235200 - DOI - PubMed
    1. Binda M., Péli-Gulli M. P., Bonfils G., Panchaud N., Urban J., et al. , 2009. The Vam6 GEF controls TORC1 by activating the EGO complex. Mol. Cell 35: 563–573. 10.1016/j.molcel.2009.06.033 - DOI - PubMed
    1. Binda M., Bonfils G., Panchaud N., Péli-Gulli M. P., De Virgilio C., 2010. An EGOcentric view of TORC1 signaling. Cell Cycle 9: 221–222. 10.4161/cc.9.2.10585 - DOI - PubMed
    1. Blinder D., Coschigano P. W., Magasanik B., 1996. Interaction of the GATA factor Gln3p with the nitrogen regulator Ure2p in Saccharomyces cerevisiae. J. Bacteriol. 178: 4734–4736. 10.1128/jb.178.15.4734-4736.1996 - DOI - PMC - PubMed

Publication types

MeSH terms