. 2019 Jul 2;116(27):13358-13367.
doi: 10.1073/pnas.1818845116. Epub 2019 Jun 18.

Gating modules of the AMPA receptor pore domain revealed by unnatural amino acid mutagenesis

Affiliations

Gating modules of the AMPA receptor pore domain revealed by unnatural amino acid mutagenesis

Mette H Poulsen et al. Proc Natl Acad Sci U S A. .

Abstract

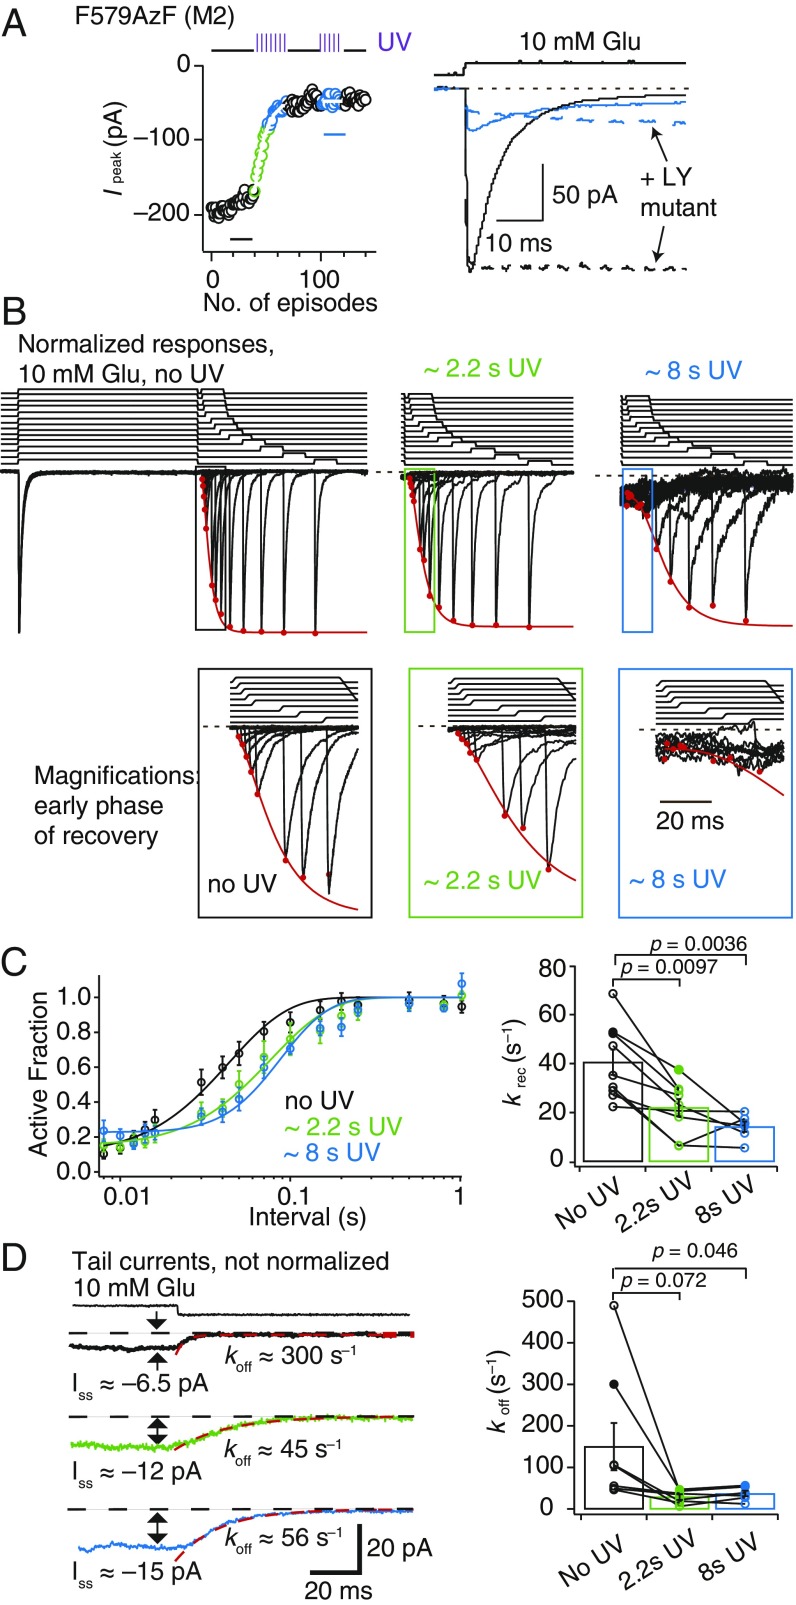
Ionotropic glutamate receptors (iGluRs) are responsible for fast synaptic transmission throughout the vertebrate nervous system. Conformational changes of the transmembrane domain (TMD) underlying ion channel activation and desensitization remain poorly understood. Here, we explored the dynamics of the TMD of α-amino-3-hydroxy-5-methyl-4-isoxazolepropionic acid (AMPA)-type iGluRs using genetically encoded unnatural amino acid (UAA) photocross-linkers, p-benzoyl-l-phenylalanine (BzF) and p-azido-l-phenylalanine (AzF). We introduced these UAAs at sites throughout the TMD of the GluA2 receptor and characterized the mutants in patch-clamp recordings, exposing them to glutamate and ultraviolet (UV) light. This approach revealed a range of optical effects on the activity of mutant receptors. We found evidence for an interaction between the Pre-M1 and the M4 TMD helix during desensitization. Photoactivation at F579AzF, a residue behind the selectivity filter in the M2 segment, had extraordinarily broad effects on gating and desensitization. This observation suggests coupling to other parts of the receptor and like in other tetrameric ion channels, selectivity filter gating.

Keywords: glutamate receptor; membrane protein; selectivity filter.


Conflict of interest statement

The authors declare no conflict of interest.

Figures

Fig. 1.
Fig. 1.
Site-specific incorporation of AzF and BzF. (A) Cartoon of the TMD of a glutamate receptor subunit. Stars indicate UAA insertion sites. (B) Chemical structures of AzF and BzF. (C) Summary of expression characteristics, electrophysiology, and UV effects. Color coding of sites is the same as in A. Western blot analysis indicated that “rescue” of translation was successful for all of the constructs tested, denoted by filled green circles. A backslash indicates no test. Under “Current,” green ticks indicate constructs for which glutamate-induced currents could be detected, and red crosses indicate constructs where no currents could be recorded for AzF or BzF incorporation. Receptors were exposed to UV light in the resting and/or desensitized state during electrophysiological recordings. Green filled stars indicate a specific UV-triggered effect, and red asterisks indicate no apparent effect of UV light. Forward slashes indicate constructs [GluA2-F574AzF (M2), -W605AzF (M3), -L577BzF (M2), and -F584BzF (M2)] where large rundown in the current amplitude precluded quantitation of any possible slow concurrent UV effects. Recordings of the I798BzF (M4) mutant had rapid rundown and leak currents that were larger than usual. The currents for F571AzF and S544AzF mutants (both M2) were too small to permit analysis of UV-driven effects (indicated by a backslash). Incorporation of AzF in six additional sites in M4 was tested, but no UV effect was observed (SI Appendix, Tables S6 and S7) (D) Representation of insertion sites shown as color-coded spheres in a GluA2 crystal structure (PDB ID code 3kg2). Red spheres indicate failure of both AzF and BzF to rescue functional receptors (Current column in C), whereas orange spheres indicate successful insertion of only AzF, and green spheres indicate successful insertion of both AzF and BzF.
Fig. 2.
Fig. 2.
UV-triggered inhibition of glutamate-induced currents. (A, Left, B, Left, C, Left, and D, Left) Examples of kymograms showing the time course of receptor inactivation for selected constructs. Each episode included a 400-ms application of 10 mM glutamate (each circle represents the peak current response). A 200-ms exposure of UV epiillumination was made in each episode (indicated in the kymogram by violet pulse trains and colored circles). The rate of peak current reduction was monoexponential (white outlined fits). (A, Right, B, Right, C, Right, and D, Right) Traces representing averages of 5–20 responses to glutamate before UV exposure (black trace) and after UV exposure (colors) in either the resting or desensitized state (solid lines; taken from points indicated by bars in kymograms) and fully active state (corresponding L483Y mutant; dotted line). We could not record currents from the GluA2-L483Y-F608AzF mutant (M3); therefore, CTZ was used to block desensitization for this construct. The dashed current traces were scaled to aid comparison (scale factor given in parentheses): Y533AzF-LY (0.8-fold), F584AzF-LY (0.9-fold), F608AzF + CTZ (5-fold), and F796AzF-LY (2.8-fold).
Fig. 3.
Fig. 3.
UV-triggered potentiation of AMPAR responses. (A and B) Example kymograms illustrating the time course of the potentiation of peak (A) and steady-state (B) current for GluA2-F515BzF (Pre-M1; row 1), GluA2-L518BzF (Pre-M1; row 2), GluA2-Y797AzF (M4; row 3), and GluA2-I798AzF (M4; row 4). The rate of peak current potentiation was monoexponential (white outlined fits). (C) Example current traces representing averages of 5–20 responses to glutamate before UV exposure (black traces) and after UV exposure (colors) in either the resting or desensitized state (solid lines; taken from points indicated by bars in kymograms). Representative currents from the corresponding L483Y mutants (active-state UV exposure; dotted lines) are shown for F515BzF and Y797AzF (scaled, as in Fig. 2, by 0.35- and 3.5-fold, respectively). (D) Bar graphs summarize desensitization rates in 10 mM glutamate of GluA2-F515BzF, -L518BzF, -Y797AzF, and -I798AzF before and after UV exposures (SI Appendix, Table S2 has a summary of rates). *P < 0.05, **P < 0.01, and ***P < 0.001.
Fig. 4.
Fig. 4.
Intrasubunit cross-linking by BzF. (A) Structure of the TMD (PDB ID code 3kg2) with AzF and BzF incorporated at sites 797 and 515, respectively, illustrating the close proximity of the two sites. (B) Cartoon of the TEV site construct and fragments generated by TEV protease treatment. A site for TEV protease recognition was introduced in the M1–M2 intracellular loop of the GluA2 subunit as well as a C-terminal FLAG-tag epitope and a TAG mutation for incorporation of UAA (violet star). Covalent bridging within a subunit of the two fragments arising from TEV protease treatment should “protect” a monomeric subunit band on Western blots. (C) Exemplary Western blot showing monomer protection of F515BzF (Pre-M1). For all conditions, the band at 63 kDa corresponds to GluA2 truncated at residue 515. The truncated band is undistinguishable from the digested N terminus when TEV protease is added (64 kDa). (Lanes 1–3) Quantitation of the rescue of F515TAG construct in cells by BzF showed a monomeric band at 100 kDa. A band from subunits truncated at the TAG site (63 kDa) is present, presumably pulled down in FLAG purification with full-length subunits. (Lane 4) The omission of only the UAA results in no rescue of monomeric band. A band corresponding to subunits truncated at the TAG site can be visualized on the blot; however, the band is very faint, presumably due to a lack of any FLAG epitope. (Lanes 5–7) Quantitation of F515BzF (Pre-M1) treated with TEV protease showed an increase of monomer fraction with longer exposure to UV. (Lanes 8–10) Exposing F515BzF to twice the amount of TEV protease (relative to lanes 5 and 6) led to an increase in protection of monomers, indicating more cross-linking events. (D) Summary of the monomeric fraction plotted against the UV exposure time. Only insertion of BzF in position 515 showed an increase in monomer protection over time.
Fig. 5.
Fig. 5.
Segregation of sites by UV effect. (A) Bar graph (Left) representing the summary of the change in peak current before (I0) and after UV (IUV) of selected GluA2 constructs with AzF or BzF incorporated in the TMD. Small reductions in peak current (like for F517AzF-preM1) are likely due to rundown and are not related to the application of UV. Bar graph (Right) summarizing the fold change in steady-state current relative to the peak current. (B) Bottom and side views of structures showing AzF and BzF insertion sites as spheres colored according to their UV-dependent changes in peak current amplitude (Upper) and relative steady-state current (Lower). Each site is highlighted in color in all four subunits. The color scale (Left) is representing the colors used to show the fold change measured for each construct. At sites where two residues were tested, we plotted the greater fold change.
Fig. 6.
Fig. 6.
Segregation based on gating properties. (A) Plot shows the relation between the mean UV-induced changes in peak and relative steady-state current before (I0) and after UV (IUV) at each site. Sites are color coded according to the effect: null in wheat, potentiation in green, inhibition in purple, and intermediate (579) in cyan. The same color code applies throughout the figure; 577A and 577B denote the insertions of AzF and BzF, respectively, at this particular site. (B) Simplified single-binding site models of AMPAR gating. Open state (AR*) is green, and shut states (including desensitized states D, AD, and AD2) are red. Rates or states that were varied in each simulation are highlighted in yellow (SI Appendix, Supplementary Materials and Methods has details). (C) A two-dimensional plot resembling that in A but derived from simulations of the kinetic models described in B. Progressive alteration of the channel-shutting and -opening rates (α and β, respectively; purple circles), changes in desensitization rates (d2; open green circles), or AD2 becoming conductive (filled green circles). Changes to both gating and desensitization are needed to obtain the intermediate behavior (cyan circles). (D) Simulated responses from kinetic models (indicated with colored circles as in B) used to construct C, with traces colored according to the rate constant indicated. (E) Gating modules in the AMPAR pore (Movie S1). The major classes of mutants form contiguous modules: a desensitization module (green; collar), a gating module (magenta; bundle crossing gate), and peripheral mutations with no effect (null mutants; wheat). The selectivity filter mutant with complex behavior is F579AzF (cyan).
Fig. 7.
Fig. 7.
Broad role of the M2 segment in activation and desensitization. (A) Kymograms illustrating the time course of incomplete inhibition for F579AzF (M2) peak current responses to 10 mM glutamate (Left). Example current traces (Right) representing averages of 10 responses to glutamate before UV exposure (black trace) and after UV exposure (cyan) in desensitized state (solid lines) and fully active state (corresponding L483Y mutant; dotted line; scaled 1.4-fold larger to aid comparison). (B) Exemplary normalized traces for recovery from desensitization before, during (2.2 s; green), and after (8 s; blue) UV exposure. Time courses of glutamate applications are shown above the traces. Red circles indicate the peak of the response fitted with a recovery function (red line). Apparent increase in noise after 8 s of UV exposure appears from performing a zoom on the trace to be able to find the remaining glutamate-induced current. (C) Recovery curves from pooled data are shifted to the right with cumulative UV exposure. Bar graph summarizing paired recovery from desensitization protocols before, during, and after 8 s of UV exposure. Solid symbols refer to the patch in A. Recovery rates ± SEM: krec = 40 ± 5 s−1 (n = 9), krec = 20 ± 3 s−1 (n = 9), and krec = 15 ± 2 s−1 (n = 6) before, during, and after UV, respectively. (D) Exemplary traces for tail currents after desensitization. Bar graph of decays after the steady-state current before, during, and after UV exposures, with solid symbols referring to the traces shown in Left. Deactivation rates ± SEM are koff = 150 ± 60 s−1 (n = 9), koff = 30 ± 5 s−1 (n = 9), and koff = 35 ± 10 s−1 (n = 6) before, during, and after UV, respectively. Error bars represent SEM.
Fig. 8.
Fig. 8.
Putative AMPAR gating modules. (A) The time courses of UV-dependent gating changes in the F579AzF (M2) mutant (details are in Fig. 7 and SI Appendix, Fig. S9). Desensitization changes (desensitized fraction and kdes) developed over longer cumulative exposures than deactivation (kdeac) or the long decay after a desensitized pulse (koff). For the inhibition of the peak current (Ipeak) before, during (2.2 s), and after (8 s) UV exposure: P = 0.34 (paired t test between no UV and 2.2-s UV) and P = 0.0095 (repeated measures ANOVA). (B) The F579 site is located immediately behind the selectivity filter. Overlay of the TMD of a single subunit from closed (red) and open (green) GluA2 channels with the four transmembrane helices (M1–M4) indicated. (C) Overlays of open and closed channel structures showing F579 in multiple conformations. The PDB ID codes are indicated in the corresponding colors. (D) Scheme of gating modules. Channel opening requires a “bloom” at the M3 segment (gating module; magenta) and a conductive selectivity filter (cyan). Desensitization is accompanied by movements of the desensitization module (green) and potentially by structural dynamics of the selectivity filter.

References

    1. Twomey E. C., Yelshanskaya M. V., Grassucci R. A., Frank J., Sobolevsky A. I., Channel opening and gating mechanism in AMPA-subtype glutamate receptors. Nature 549, 60–65 (2017). - PMC - PubMed
    1. Chen S., et al. , Activation and desensitization mechanism of AMPA receptor-TARP complex by cryo-EM. Cell 170, 1234–1246.e14 (2017). - PMC - PubMed
    1. Sun Y., et al. , Mechanism of glutamate receptor desensitization. Nature 417, 245–253 (2002). - PubMed
    1. Horning M. S., Mayer M. L., Regulation of AMPA receptor gating by ligand binding core dimers. Neuron 41, 379–388 (2004). - PubMed
    1. Carbone A. L., Plested A. J. R., Coupled control of desensitization and gating by the ligand binding domain of glutamate receptors. Neuron 74, 845–857 (2012). - PubMed

Publication types

LinkOut - more resources