

β-Cardiac myosin hypertrophic cardiomyopathy mutations release sequestered heads and increase enzymatic activity
- PMID: 31213605
- PMCID: PMC6582153
- DOI: 10.1038/s41467-019-10555-9
β-Cardiac myosin hypertrophic cardiomyopathy mutations release sequestered heads and increase enzymatic activity
Abstract
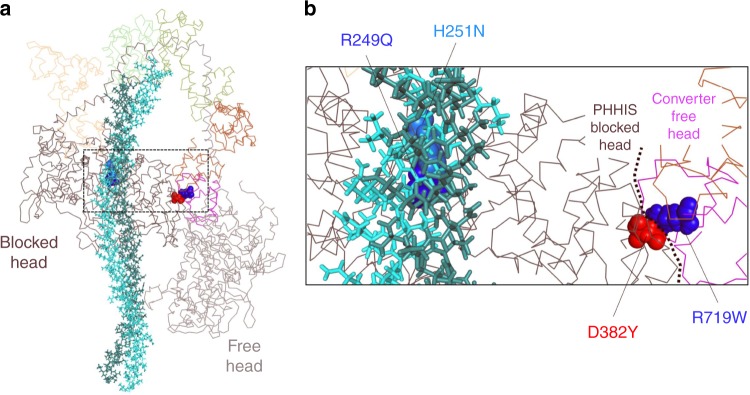
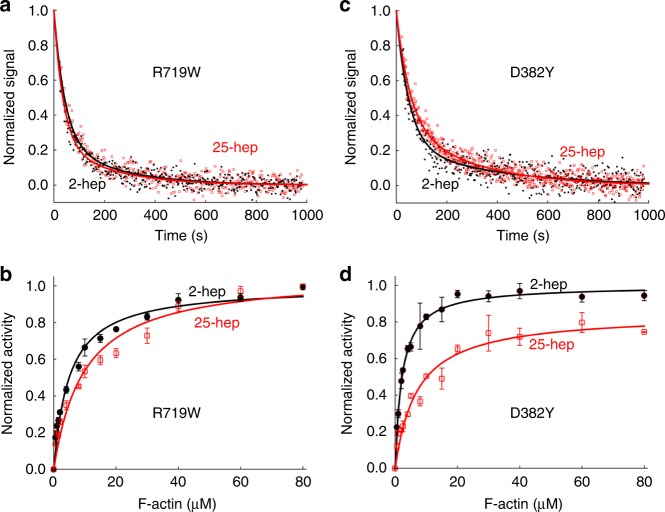
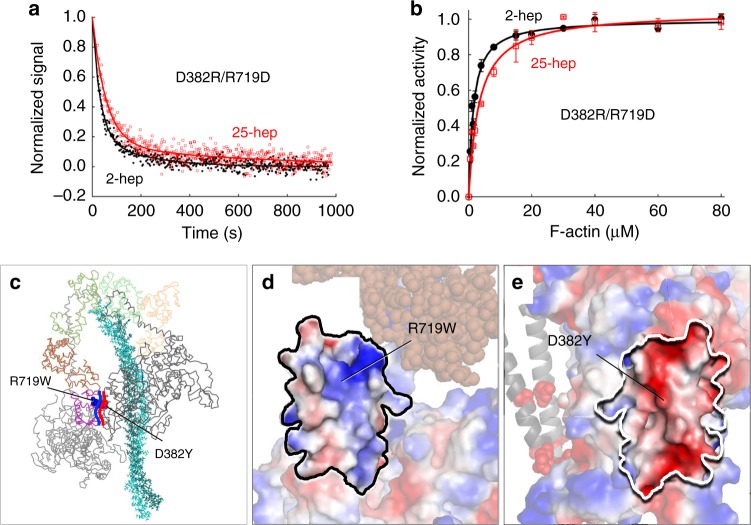
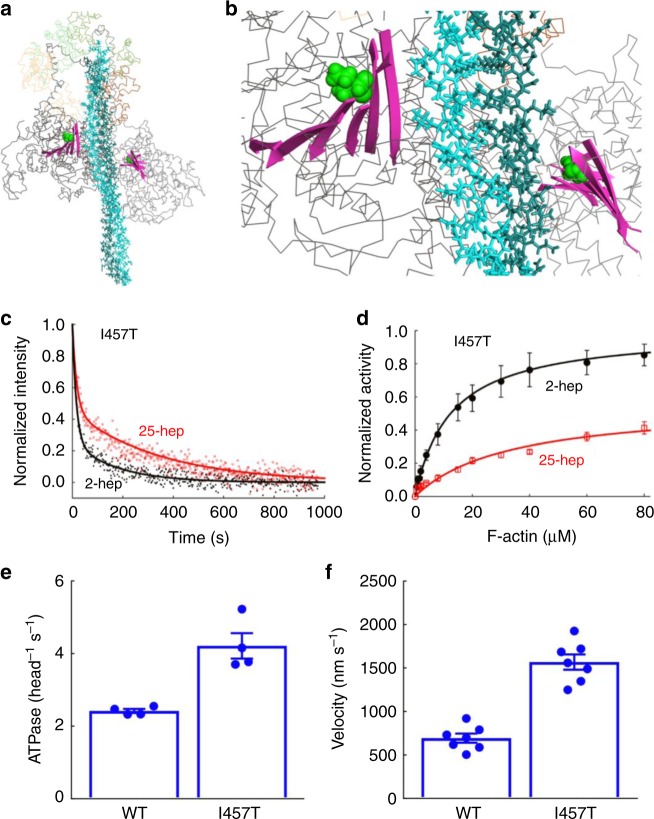
Hypertrophic cardiomyopathy (HCM) affects 1 in 500 people and leads to hyper-contractility of the heart. Nearly 40 percent of HCM-causing mutations are found in human β-cardiac myosin. Previous studies looking at the effect of HCM mutations on the force, velocity and ATPase activity of the catalytic domain of human β-cardiac myosin have not shown clear trends leading to hypercontractility at the molecular scale. Here we present functional data showing that four separate HCM mutations located at the myosin head-tail (R249Q, H251N) and head-head (D382Y, R719W) interfaces of a folded-back sequestered state referred to as the interacting heads motif (IHM) lead to a significant increase in the number of heads functionally accessible for interaction with actin. These results provide evidence that HCM mutations can modulate myosin activity by disrupting intramolecular interactions within the proposed sequestered state, which could lead to hypercontractility at the molecular level.
Conflict of interest statement
J.A.S. is a founder of Cytokinetics and MyoKardia and a member of their advisory boards. K.M.R. is a member of the MyoKardia scientific advisory board. The remaining authors declare no competing interests.
Figures
Similar articles
-
The myosin mesa and the basis of hypercontractility caused by hypertrophic cardiomyopathy mutations.Nat Struct Mol Biol. 2017 Jun;24(6):525-533. doi: 10.1038/nsmb.3408. Epub 2017 May 8. Nat Struct Mol Biol. 2017. PMID: 28481356 Free PMC article.
-
Early-Onset Hypertrophic Cardiomyopathy Mutations Significantly Increase the Velocity, Force, and Actin-Activated ATPase Activity of Human β-Cardiac Myosin.Cell Rep. 2016 Dec 13;17(11):2857-2864. doi: 10.1016/j.celrep.2016.11.040. Cell Rep. 2016. PMID: 27974200 Free PMC article.
-
The hypertrophic cardiomyopathy mutations R403Q and R663H increase the number of myosin heads available to interact with actin.Sci Adv. 2020 Apr 3;6(14):eaax0069. doi: 10.1126/sciadv.aax0069. eCollection 2020 Apr. Sci Adv. 2020. PMID: 32284968 Free PMC article.
-
Altered force generation and cell-to-cell contractile imbalance in hypertrophic cardiomyopathy.Pflugers Arch. 2019 May;471(5):719-733. doi: 10.1007/s00424-019-02260-9. Epub 2019 Feb 11. Pflugers Arch. 2019. PMID: 30740621 Free PMC article. Review.
-
Hypertrophic Cardiomyopathy: Diverse Pathophysiology Revealed by Genetic Research, Toward Future Therapy.Keio J Med. 2020 Dec 25;69(4):77-87. doi: 10.2302/kjm.2019-0012-OA. Epub 2020 Mar 28. Keio J Med. 2020. PMID: 32224552 Review.
Cited by
-
Critical Evaluation of Current Hypotheses for the Pathogenesis of Hypertrophic Cardiomyopathy.Int J Mol Sci. 2022 Feb 16;23(4):2195. doi: 10.3390/ijms23042195. Int J Mol Sci. 2022. PMID: 35216312 Free PMC article. Review.
-
Electrically conductive carbon-based (bio)-nanomaterials for cardiac tissue engineering.Bioeng Transl Med. 2022 Jun 21;8(1):e10347. doi: 10.1002/btm2.10347. eCollection 2023 Jan. Bioeng Transl Med. 2022. PMID: 36684103 Free PMC article. Review.
-
Myosin Transducer Inter-Strand Communication Is Critical for Normal ATPase Activity and Myofibril Structure.Biology (Basel). 2022 Jul 29;11(8):1137. doi: 10.3390/biology11081137. Biology (Basel). 2022. PMID: 36009764 Free PMC article.
-
Stable Rates of Obstructive Hypertrophic Cardiomyopathy in a Contemporary Era.Front Cardiovasc Med. 2022 Jan 6;8:765876. doi: 10.3389/fcvm.2021.765876. eCollection 2021. Front Cardiovasc Med. 2022. PMID: 35071348 Free PMC article.
-
Cryo-EM structure of the autoinhibited state of myosin-2.Sci Adv. 2021 Dec 24;7(52):eabk3273. doi: 10.1126/sciadv.abk3273. Epub 2021 Dec 22. Sci Adv. 2021. PMID: 34936462 Free PMC article.
References
MeSH terms
Substances
Grants and funding
- R01 GM033289/GM/NIGMS NIH HHS/United States
- HL117138/U.S. Department of Health & Human Services | NIH | National Heart, Lung, and Blood Institute (NHLBI)/International
- R01 HL117138/HL/NHLBI NIH HHS/United States
- F32 HL140772/HL/NHLBI NIH HHS/United States
- T32 HL094274/HL/NHLBI NIH HHS/United States
LinkOut - more resources
Full Text Sources
