. 2019 Jun 18;9(1):8683.
doi: 10.1038/s41598-019-44893-x.

A Differential Approach to Form and Site of Peptic Ulcer

Affiliations

A Differential Approach to Form and Site of Peptic Ulcer

Walter Rau et al. Sci Rep. .

Abstract

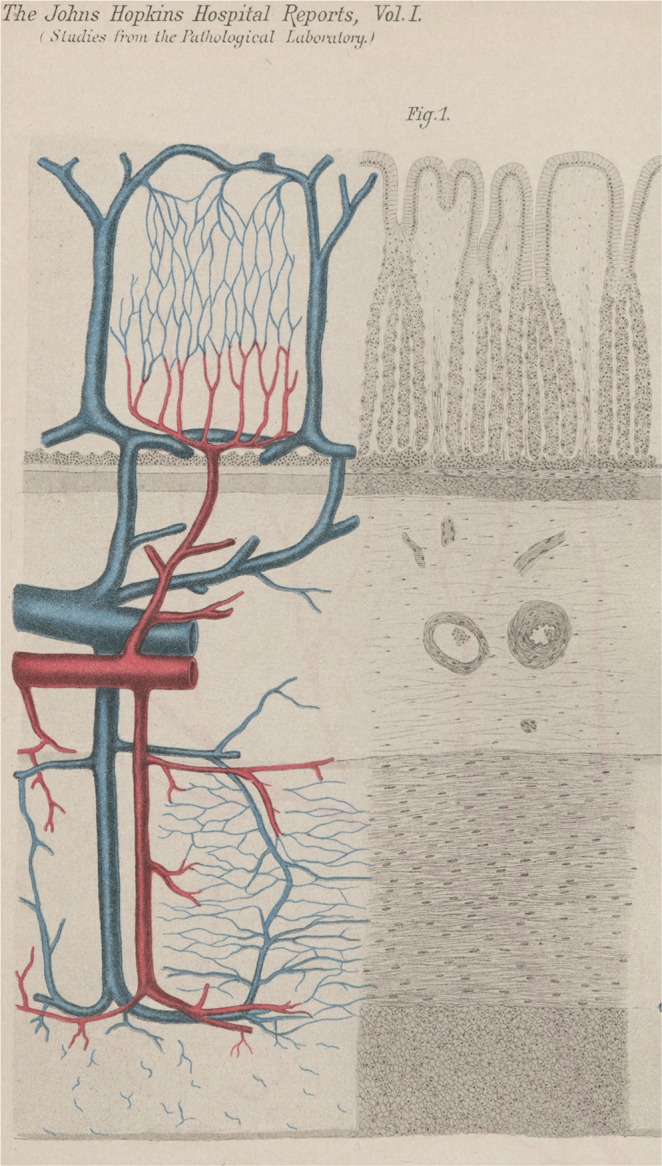
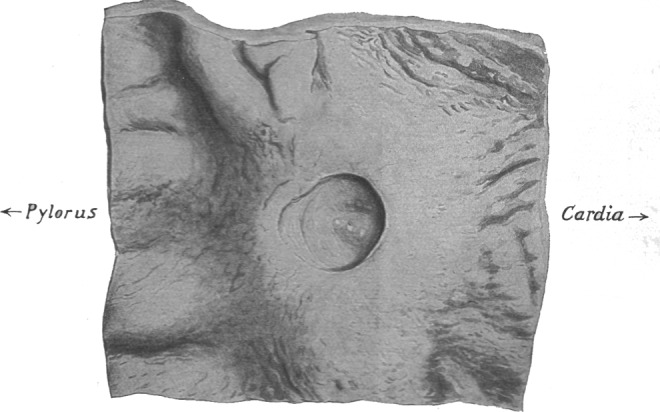
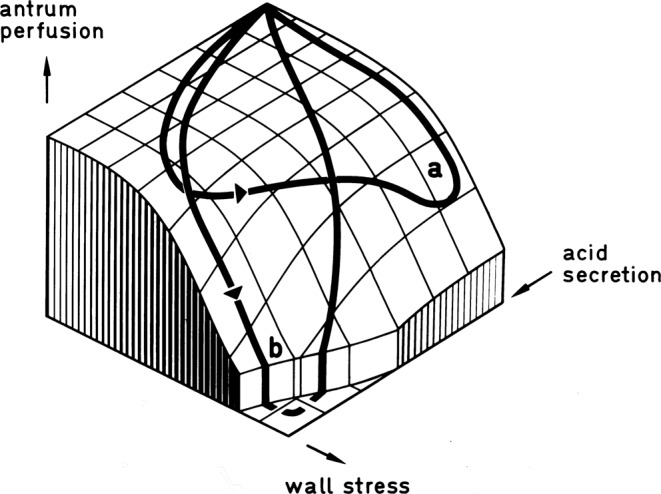
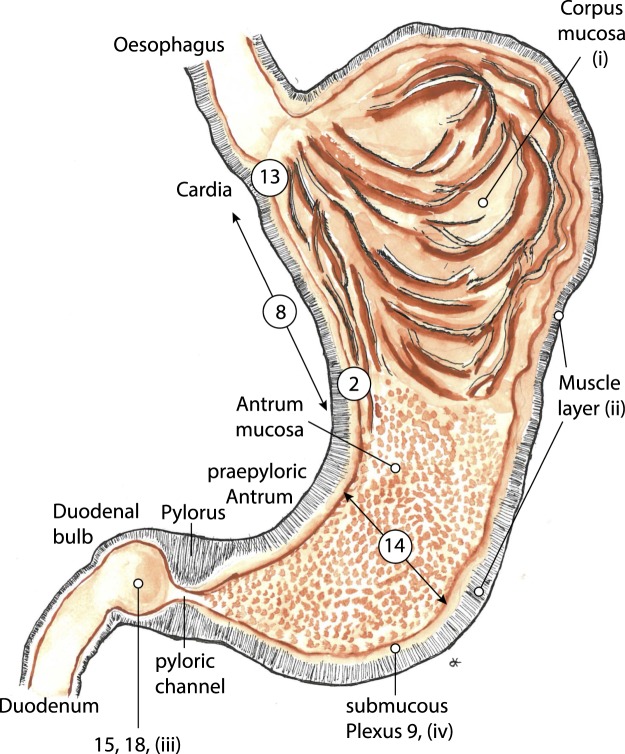
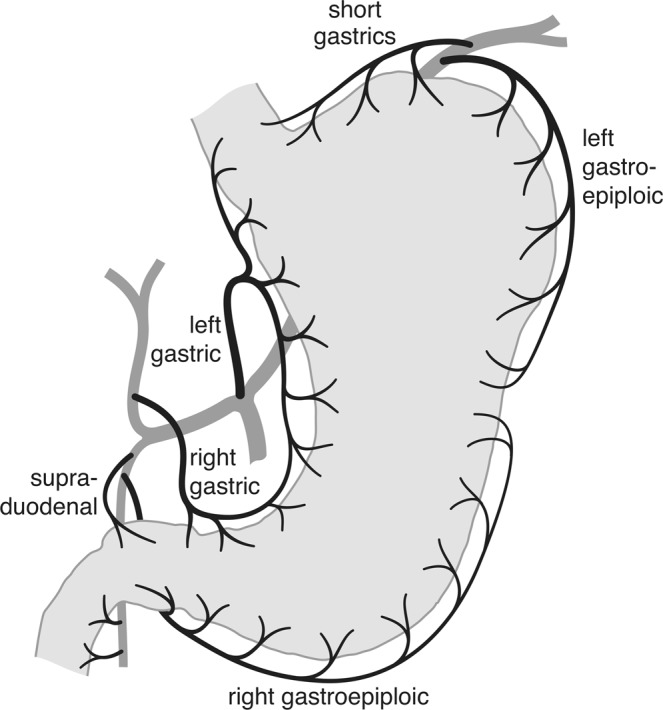
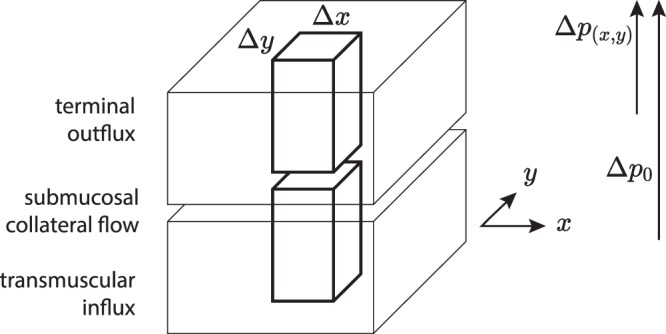
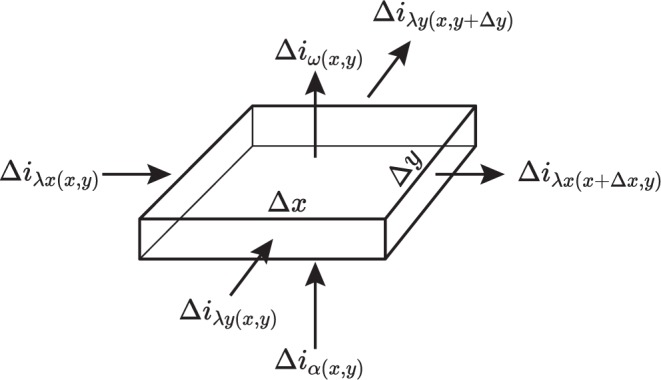
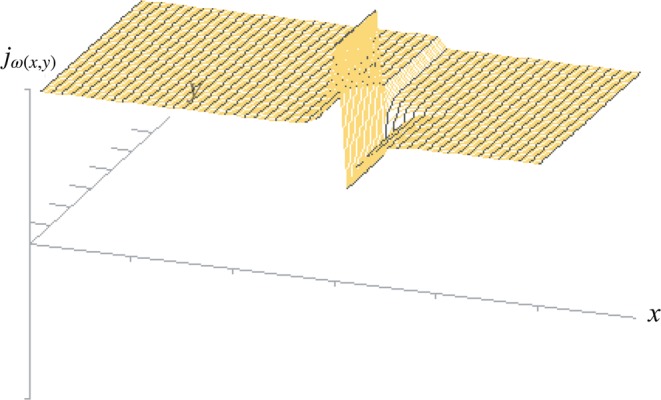
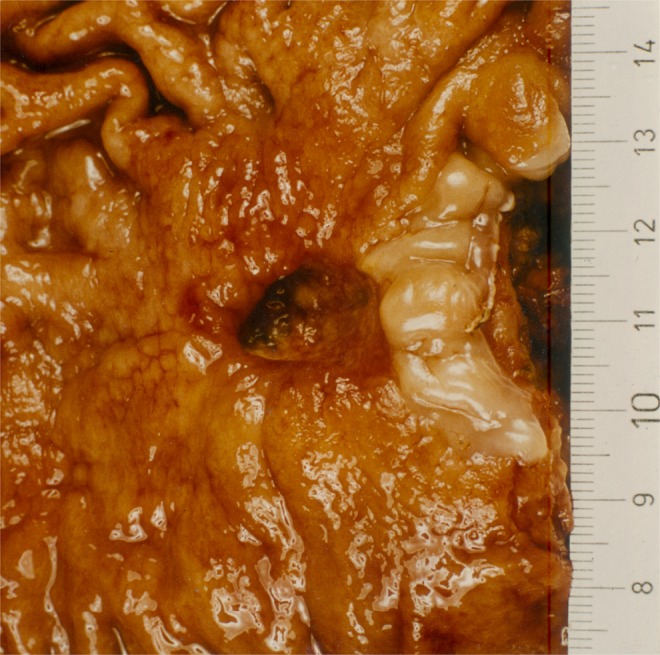
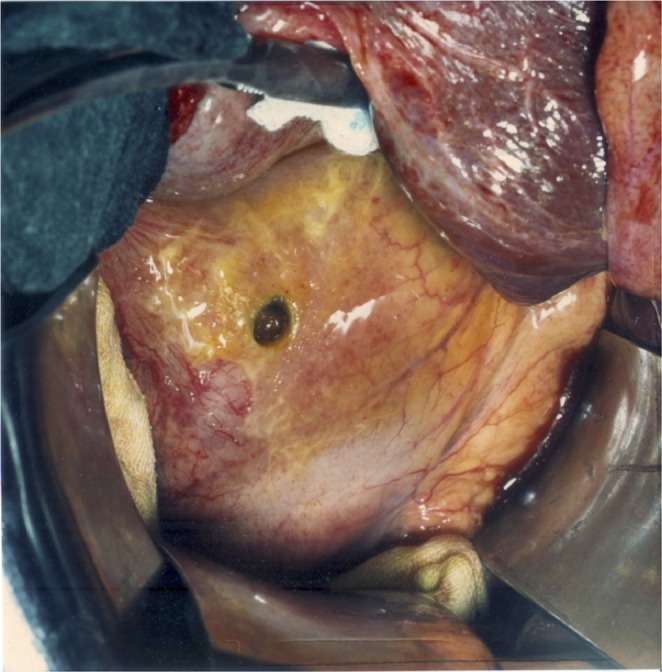
The structural organization of intestinal blood flow is such as to allow for intramural collateral flow. Redistribution phenomena due to different local metabolic demands may lead to an impaired perfusion of parts of the intestinal wall which will display a characteristic pattern. Based on Ohm's and Kirchhoff's laws, a differential analysis of the gastric vascular bed bridges the gap between basic physiological concepts and traditional anatomical, pathological and clinical knowledge. An ulcer of the intestinal wall becomes understandable as a non-occlusive infarct based on a supply/demand conflict in an anisotropic structure as it can be found in the upper and lower gastrointestinal tract of man.


Conflict of interest statement

The authors declare no competing interests.

Figures

Figure 1
Figure 1
Basic vertical arterial element of the gastric wall. Original Figure from F. Mall, which in its left part shows a 3D-reconstruction of the vessels from serial sections of the stomach-wall. The submucous plexus is the central offspring of the arteries supplying the mucosa and also a varying part of the muscle layer. Every decline in pressure in the submucous arterial plexus will lead to a reduction in flow in the dependent parts of the gastric wall. Detail of Plate III, Fig. 1 from Johns Hopkins Hospital Reports 1. By Courtesy of Johns Hopkins University Press. This figure is not covered by the CC BY licence. Credits to ©Universitätsbibliothek der Humboldt-Universität zu Berlin, Historische Sammlungen: Ia 40920:F4. All rights reserved, used with permission.
Figure 2
Figure 2
Morphology of a gastric ulcer in the antrum. L. Aschoff described the form of gastric ulcer as Reibungsform, assuming frictional forces to secondarily deform the ulcer. Ischaemic necrosis due to an occluded vessel in an end-artery model should typically produce cylindrical ulcers of the gastric wall. Aschoff found that, in reality, gastric ulcers express a steep edge cranially and run out shallowly distally - often producing the form of a staircase. Reproduction of Fig. 515; p. 760 from Aschoff.
Figure 3
Figure 3
Theoretical prediction of the conditions of a submucous steal-phenomenon in a discrete three-compartment model of the stomach. Every possible value of MBF in the antral borderline segment is part of the computed surface. A decline of MBF below the minimum perfusion pressure is physiologically avoided by a sequential occurrence of acid-secretion and wall-stress. (a) In a single cavity stomach gastric emptying takes place after the end of the secretory phase. This can be overridden experimentally by stimulating acid secretion in the gastric emptying phase. (b) Such an imbalance of secretion and motor activity is also typical for gastric ulcer patients. Figure from, where the discrete haemodynamic model is discussed in detail.
Figure 4
Figure 4
Output of the cellular automaton as given in. On the right side the corpus mucosa shows a higher metabolic demand compared to the antral side (left). In the centre the course of the submucosal arteries is AXIAL while at the upper and lower margin it is assumed CIRCULAR. In the human stomach AXIAL represents the typical pattern of submucosal arteries at the lesser curvature. Here submucosal arteries are running perpendicular to the mucosal boundary. The result of the simulation shows the expected distribution of blood flow under limited inflow conditions. The left part of the pattern resembles Aschoff’s Reibungsform of gastric ulcer. For details of the model and the underlying program-code see.
Figure 5
Figure 5
Sketch of the anatomical regions of the foregut and the adjoining duodenum as referred to in the text. Viewed from the luminal side these regions differ in their histological lining. The oesophagus is lined with a non secreting squamous epithelium; the metabolically highly active corpus mucosa contains acid-producing parietal cells whilst the mucosa of the antrum generally does not. The border to the duodenal mucosa is generally found over the pylorus. The muscle layer is most pronounced in the gastric antrum with the pylorus muscle being its boldest structure. The external vascular supply of the foregut, which is not illustrated here, is granted by arteries which enter at both curvatures (Fig. 6). The Arabic figures give the localization of the corresponding figures, lowercase Latin figures give the 3D location of the variables considered. Figures 15 and 18 are located on the anterior surface which has been dissected away.
Figure 6
Figure 6
External arterial sources of the foregut. These vessels provide the systemic arterial pressure to the stomach and its neighbouring structures. Before they enter the muscle layer they form a dorsal mesentery (the gastroepiploic arc) at the greater curvature and a ventral mesentery (the gastric arc) at the lesser curvature. While the dorsal blood supply continues throughout the gut, the ventral mesentery ends with the supraduodenal artery to the duodenal bulb. Peptic ulcer is strictly limited to the foregut which is characterized by a dual mesenteric supply.
Figure 7
Figure 7
Transmural blood flow in the ferret using iodo-14C-antipyrine-autoradiography. The highest levels of MBF will be found in the duodenal mucosa in fasted animals under secretory conditions. The local acid load will produce a rise in local MBF of 400 ml/100 g/min up to 600 ml/100 g/min, which by far exceeds MBF in the acid-secreting gastric mucosa. The autoradiograph shows a longitudinal section, which is taken from the duodenal roof (left), including the pyloric muscle (p and the prepyloric antrum. The image, which has been accidentally recorded at the end of the phase of constant arterial invasion of the tracer, contains a further information. With exceedingly high flow rates we can also see an uneven distribution of flow at that point in time. We have interpreted this as a beginning washout effect. It may give a direct hint to the distribution pattern of arterial vasa recta, which originate directly from the submucous plexus. One of them seems to supply only the mucosa (↑) and two of them in a retrograde fashion the muscle mantle as well (↕). Livingstone has recorded the same pattern in a different species. The underlying arterial structure has first been reconstructed by Franklin Mall from serial sections of the dog’s stomach. His original drawing is quoted in Fig. 1.
Figure 8
Figure 8
“Dissection illustrating the submucous plexus of arteries on lesser curvature of the stomach. Note their length, size and general direction”. Caption and original illustration (page 380, Fig. 5) from T.B. Reeves.
Figure 9
Figure 9
Topographical anatomy of the arterial submucous plexus in man as drawn by Frans Djørup. His original figure (Abb. 15, p. 321) shows the axial course of the submucosal arteries in the oesophagus (right), extending into the proximal part of the lesser curvature (top). Only on the parietal walls of the stomach does a circular pattern prevail. In the distal antrum such marked differences in pattern around the circumference are not observed - the meshes of the submucous plexus show a more “star-shaped” pattern in the distal antrum and display a parallel aspect once the pyloric channel is entered (left). The anisotropy will become even more obvious when the stomach is filled with food. While the parietal walls will greatly expand, the lesser curvature and the pyloric channel will remain inherently stable. Reprinted by permission from Springer Nature: Zeitschr. f. d. ges. Anat. I. Abt. “Untersuchungen über die feinere topographische Verteilung der Arterien in den verschiedenen Schichten des menschlichen Magens”, Frans Djørup, ©1922. This third party figure is excluded from the open access license.
Figure 10
Figure 10
Model of the intestinal wall to derive the differential equation of intestinal blood flow. The model considers an element ΔxΔy of the intestinal wall, consisting of a transmuscular influx (bottom), a submucosal (middle) and a terminal outflow compartment (top). This outflow compartment consists of a mucosal component and a part component of the muscle layer, which is supplied by retrograde arteries as well. The systemic arterial perfusion-pressure Δp0 reduces over the intestinal wall as a whole. At the submucosal level the variable gradient Δp(x,y) will serve for the perfusion of the terminal vascular bed. Transmuscular influx iα, terminal outflow iω and lateral flow iλ in the submucosal compartment will be considered.
Figure 11
Figure 11
The total balance of flows to be considered in the submucous plane (8).
Figure 12
Figure 12
Numerical simulation for the terminal flow jω(x,y) in a 50 × 50 matrix. Initial conditions: Limited influx (α(x, y) = 0.1) over all segments. Conductivity of the terminal vascular bed ω(x,y) = 5.0 in the acid-secreting corpus mucosa on the left (0 < x < 30) and ω(x,y) = 1.0 in the neighbouring segments on the right (31 < x < 50). In the foreground (0 < y < 20) the lesser curvature is modelled (λx(x,y) = 3.82 × 10−1, λy(x,y) = 3.82 × 103), in the background (21 < y < 50) the parietal wall (λx(x,y) = 3.82 × 103, λy(x,y) = 3.82 × 10−1). The initial conditions are randomly chosen to illustrate the principal relationship: The lower the haemodynamic resistance in the submucosal plexus perpendicular to the mucosal border, the more marked the effect on local distribution of terminal flow will be. Numerical solution by SIMA.
Figure 13
Figure 13
Operative specimen with a benign ulcer of the cardia. These rare lesions can be found on the cranial edge of the corpus mucosa. The squamous epithelium of the oesophagus is visible in a whitish colour at the right. In contrast to Aschoff’s assumption of a secondary mechanical alteration of a cylindrical necrosis the ulcer at the cardia shows a funnel pointing in the opposite direction (against the peristaltic propulsion): a steep and overhanging edge at the corpus-side of the lesion, running shallowly out in a proximal direction towards the oesophagus. It mirrors the form of the typical gastric ulcer at the antrum/corpus-boundary (Fig. 2) and is correctly predicted by the differential haemodynamic model (Fig. 12).
Figure 14
Figure 14
Endoscopic view of an acute linear lesion in the distal antrum. The picture has been taken during an emergency situation but the necrotic mucosa can be clearly seen extending clay-coloured all around the circumference in a circular fashion (left). Two weeks after medical inhibition of acid secretion the damaged mucosa is largely restored leaving only small rest ulcers behind which are situated in a cross-section around the circumference (right). Endoscopic observation: HJ Dittler.
Figure 15
Figure 15
Mayo’s anemic spot demonstrated at operation in a view of the anterior wall of the antrum and the proximal duodenum. Dragging the antrum away from the fixed duodenum into the wound, a pale spot will appear at the anterior aspect of the bulb (left). It will vanish completely as soon as the tension is released. It develops at the typical site of duodenal ulcer and may be confused with it. However it does not show the sharp delineation of a duodenal ulcer. A second whitish structure running transversely can be seen directly over the pyloric muscle (centre), the most prominent muscular structure in the foregut.
Figure 16
Figure 16
Simulation of the influence of a rising mucosal conductivity (ω↗) on blood flow in the terminal vascular bed: Terminal blood flow jω(x,y) in a rectangular limited watershed area of the duodenal wall, which is only collaterally perfused. Considering the localisation of Mayo’s anemic spot such areas with a strictly retrograde flow to the muscle mantle do exist to some extent at the anterior and posterior aspect of the duodenal bulb. In the central 30 × 30 area, which has no direct transmural influx but is supplied by submucosal arteries only, mucosal flow is maintained by collateral flow alone. When local blood flow rises, adapting to an increasing metabolic demand, the effect will be more marked - in strictly collaterally supplied areas a central dip of MBF will develop. Disregarding the initial form of the collaterally supplied area it will produce a nearly circular profile at the bottom. The same effect can be accomplished by increasing wall stress (α↘). In both cases collateral flow will exclude any discontinuity of terminal flow, as long as the mucosa is vital: the effect will not be limited sharply. Initial conditions: in the 50 × 50 matrix considered there is no direct transmural influx to the central 30 × 30 square (α(x,y): = 0.001), while the surrounding (10, 10) 〈(x, y)〉 (41, 41) has a free influx (α(x,y): = 1). A uniform criss-cross-pattern of submucous arteries is assumed: (1, 1) < (x, y) < (50, 50) → λx(x,y) = λy(x,y) = 3.82 × 10−1. Mucosal metabolic demand and conductivity ω(x,y) will rise exponentially from the bottom to the top: ω(x,y): = 1 (bottom), ω(x,y): = 10 (centre), ω(x,y): = 100 (top). Numerical solution by SIMA.
Figure 17
Figure 17
The influence of mucosal viability on local distribution of flow to the duodenal wall. A circular watershed area (øwall = 18) with predominantly collateral supply is considered in the centre of the 50 × 50 matrix (top). This central area has a limited direct transmuscular influx (αcentre: = 0.05). The surrounding area is considered to have a direct access to transmuscular supply (αsurround: = 0.1). In the submucosa arteries are evenly distributed in both directions: λx(x,y) = λy(x,y) = 3.82 × 10−1. Mucosal metabolic demand and conductivity ω(x,y) = 10 in the vital mucosa (top). When the resulting blood flow falls below a threshold level, which is assumed the minimum necessary to defend the mucous membrane against acid attack, the mucosa will become necrotic. The remaining conductivity of the centre will now be given by the remaining retrograde flow to the surviving parts of the muscularis propria layer: we assume the vascular resistance of dead tissue to rise extremely and set the remaining conductivity of the centre ωcentre: = 0.05 (bottom). As long as the mucosa is viable, collateral flow will be directed towards this part of the wall, jλcentre > 0 (top left). For blood flow in the terminal vascular bed this will produce a continuous drop in flow to areas with a prevailing collateral supply (top right). As soon as mucosal viability breaks down at the tip of the dip (øwall = 15), collateral flow will dissipate away from this area jλ(x,y) < 0 (bottom left). Only now will local blood flow to the centre of this area totally fail (bottom right). Due to the reversal of collateral flow a contrast enhancement will develop at the borders of the necrotic area: the pattern resembles that in Fig. 12 in a circular fashion with the negative values adding in the centre. The local redistribution of collateral flow jλcentre is again directed away from the necrotic centre towards the surrounding area, which is still vital. By the structure of the network alone the effect on local distribution of flow will produce a self limiting effect, which is in the final analysis only based on Kirchhoff’s laws. Numerical solution by SIMA.
Figure 18
Figure 18
View at a freshly perforated duodenal ulcer at operation. The characteristic form of this full wall necrosis develops at the anterior surface in-between the arterial influx from both mesenteries. The direct view from the serosal side shows the radial symmetry of the transmural defect with acute margins to all sides of the vital surrounding tissue. Macroscopically and microscopically this typical finding appears to be punched out from a grossly intact duodenal wall.

Similar articles

Cited by

References

    1. Aschoff L. Ueber die mechanischen Momente in der Pathogenese des runden Magengeschwürs und über seine Beziehungen zum Krebs. DMW-Deutsche Medizinische Wochenschrift. 1912;38:494–496. doi: 10.1055/s-0029-1189360. - DOI
    1. Marshall B, Warren JR. Unidentified curved bacilli in the stomach of patients with gastritis and peptic ulceration. The Lancet. 1984;323:1311–1315. doi: 10.1016/S0140-6736(84)91816-6. - DOI - PubMed
    1. Olbe L, Hamlet A, Dalenback J, Fandriks L. A mechanism by which helicobacter pylori infection of the antrum contributes to the development of duodenal ulcer. Gastroenterology. 1996;110:1386–1394. doi: 10.1053/gast.1996.v110.pm8613042. - DOI - PubMed
    1. Virchow R. Historisches, Kritisches und Positives zur Lehre der Unterleibsaffektionen. Virchows Archiv. 1853;5:281–375. doi: 10.1007/BF01878692. - DOI
    1. Palmer ED, Buchanan DP. On the ischemic basis of’peptic’ ulcer. I. Historical definition of present status. Annals of internal medicine. 1953;38:1187–1205. doi: 10.7326/0003-4819-38-6-1187. - DOI - PubMed