

Exploring subcellular responses of prostate cancer cells to X-ray exposure by Raman mapping
- PMID: 31213635
- PMCID: PMC6581960
- DOI: 10.1038/s41598-019-45179-y
Exploring subcellular responses of prostate cancer cells to X-ray exposure by Raman mapping
Abstract
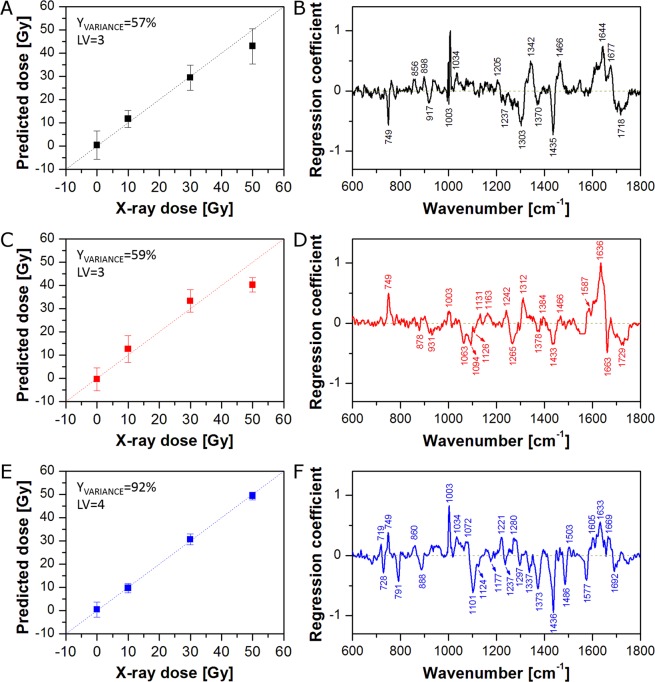
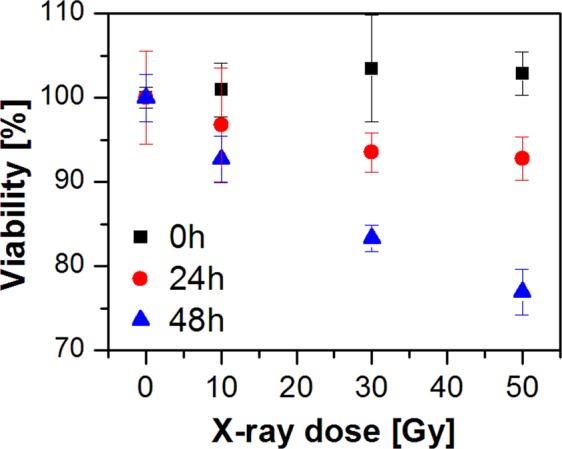
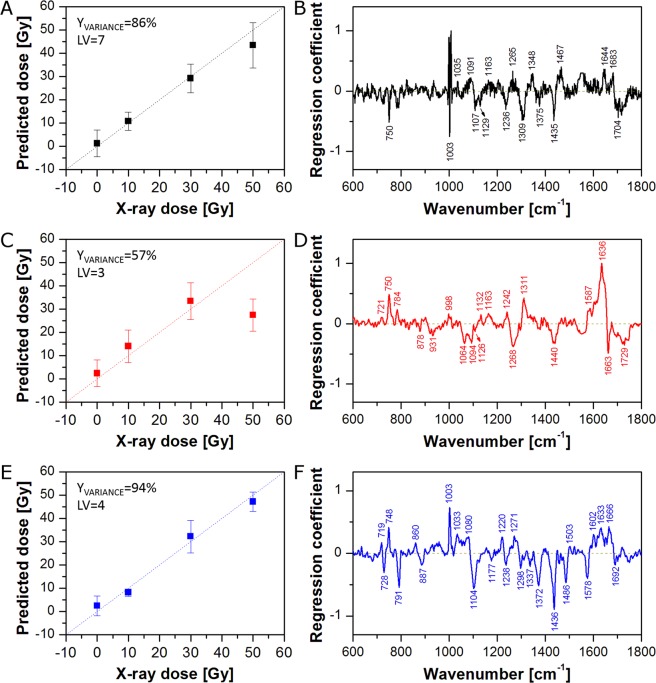
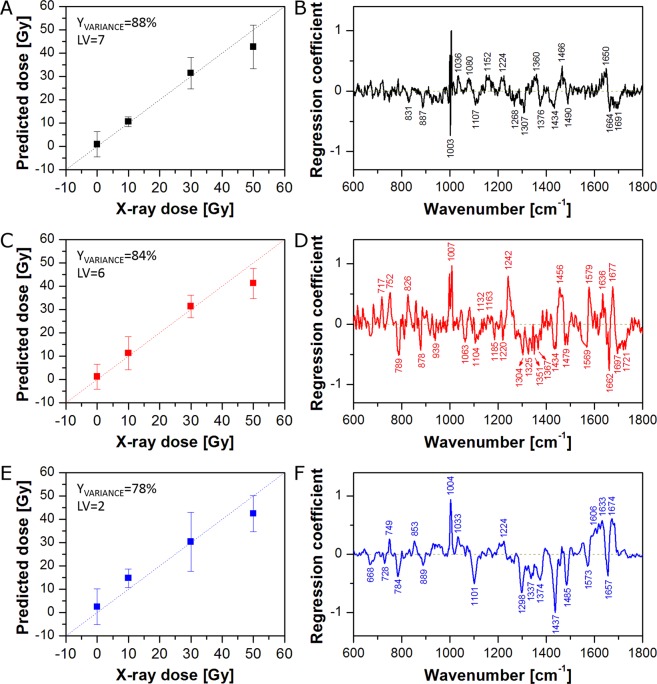
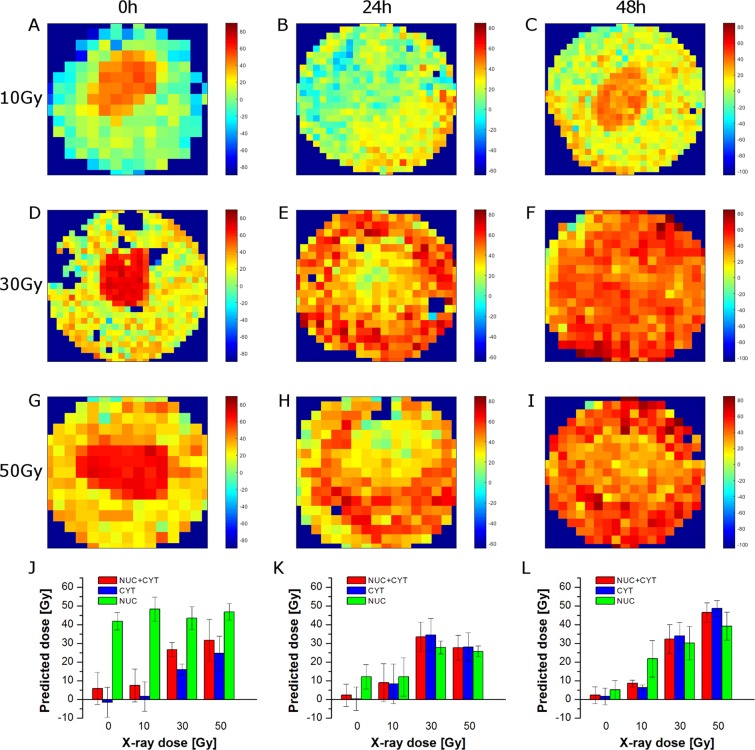
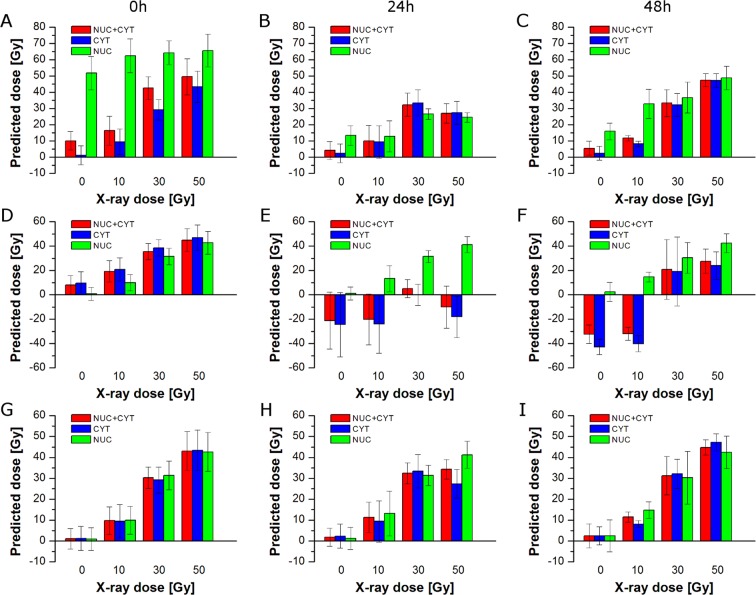
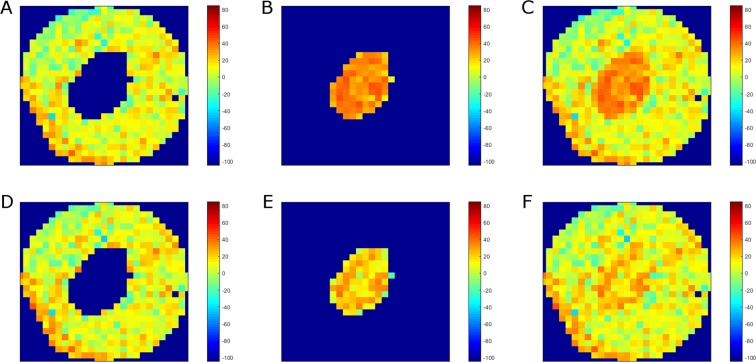
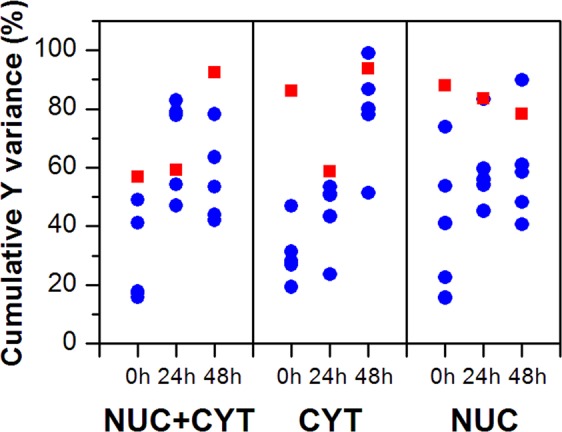
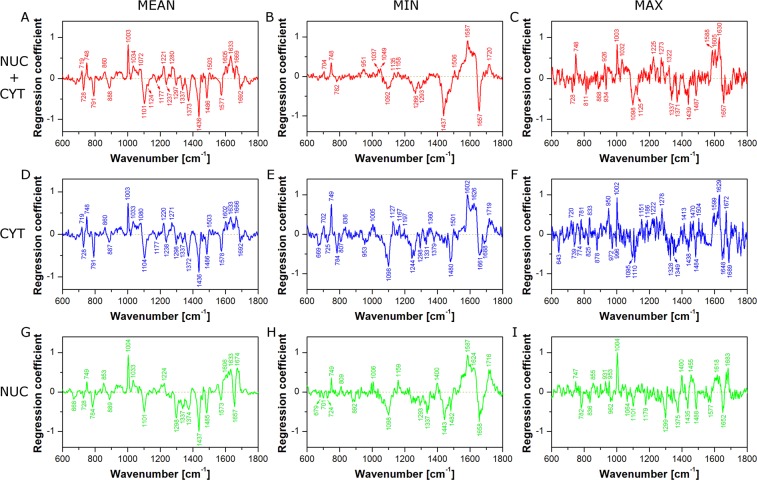
Understanding the response of cancer cells to ionising radiation is a crucial step in modern radiotherapy. Raman microspectroscopy, together with Partial Least Squares Regression (PLSR) analysis has been shown to be a powerful tool for monitoring biochemical changes of irradiated cells on the subcellular level. However, to date, the majority of Raman studies have been performed using a single spectrum per cell, giving a limited view of the total biochemical response of the cell. In the current study, Raman mapping of the whole cell area was undertaken to ensure a more comprehensive understanding of the changes induced by X-ray radiation. On the basis of the collected Raman spectral maps, PLSR models were constructed to elucidate the time-dependent evolution of chemical changes induced in cells by irradiation, and the performance of PLSR models based on whole cell averages as compared to those based on average Raman spectra of cytoplasm and nuclear region. On the other hand, prediction of X-ray doses for individual cellular components showed that cytoplasmic and nuclear regions should be analysed separately. Finally, the advantage of the mapping technique over single point measurements was verified by a comparison of the corresponding PLSR models.
Conflict of interest statement
The authors declare no competing interests.
Figures
Similar articles
-
Exploring subcellular responses of prostate cancer cells to clinical doses of X-rays by Raman microspectroscopy.Spectrochim Acta A Mol Biomol Spectrosc. 2021 Jul 5;255:119653. doi: 10.1016/j.saa.2021.119653. Epub 2021 Mar 8. Spectrochim Acta A Mol Biomol Spectrosc. 2021. PMID: 33773429
-
Physicochemical damage and early-stage biological response to X-ray radiation studied in prostate cancer cells by Raman spectroscopy.J Biophotonics. 2020 Dec;13(12):e202000252. doi: 10.1002/jbio.202000252. Epub 2020 Sep 18. J Biophotonics. 2020. PMID: 32844593
-
Comparison of biochemical changes induced in radioresistant prostate cancer cells by X-rays, radiosensitizing drugs, and a combined therapy using Raman microspectroscopy.Spectrochim Acta A Mol Biomol Spectrosc. 2025 Feb 5;326:125218. doi: 10.1016/j.saa.2024.125218. Epub 2024 Sep 26. Spectrochim Acta A Mol Biomol Spectrosc. 2025. PMID: 39353252
-
Raman microspectroscopy of nucleus and cytoplasm for human colon cancer diagnosis.Biosens Bioelectron. 2017 Nov 15;97:70-74. doi: 10.1016/j.bios.2017.05.045. Epub 2017 May 26. Biosens Bioelectron. 2017. PMID: 28575750
-
Comparison of subcellular responses for the evaluation and prediction of the chemotherapeutic response to cisplatin in lung adenocarcinoma using Raman spectroscopy.Analyst. 2011 Jun 21;136(12):2450-63. doi: 10.1039/c1an15104e. Epub 2011 Apr 26. Analyst. 2011. PMID: 21519610
Cited by
-
Investigating ionizing radiation-induced changes in breast cancer cells using stimulated Raman scattering microscopy.J Biomed Opt. 2023 Jul;28(7):076501. doi: 10.1117/1.JBO.28.7.076501. Epub 2023 Jul 11. J Biomed Opt. 2023. PMID: 37441447 Free PMC article.
-
In vitro Label Free Raman Microspectroscopic Analysis to Monitor the Uptake, Fate and Impacts of Nanoparticle Based Materials.Front Bioeng Biotechnol. 2020 Oct 29;8:544311. doi: 10.3389/fbioe.2020.544311. eCollection 2020. Front Bioeng Biotechnol. 2020. PMID: 33195114 Free PMC article. Review.
-
Gold Nanopeanuts as Prospective Support for Cisplatin in Glioblastoma Nano-Chemo-Radiotherapy.Int J Mol Sci. 2020 Nov 29;21(23):9082. doi: 10.3390/ijms21239082. Int J Mol Sci. 2020. PMID: 33260340 Free PMC article.
-
From Raman to SESORRS: moving deeper into cancer detection and treatment monitoring.Chem Commun (Camb). 2021 Nov 23;57(93):12436-12451. doi: 10.1039/d1cc04805h. Chem Commun (Camb). 2021. PMID: 34734952 Free PMC article. Review.
-
Label-free discrimination of tumorigenesis stages using in vitro prostate cancer bone metastasis model by Raman imaging.Sci Rep. 2022 May 16;12(1):8050. doi: 10.1038/s41598-022-11800-w. Sci Rep. 2022. PMID: 35577856 Free PMC article.
References
Publication types
MeSH terms
LinkOut - more resources
Full Text Sources
Medical
