

6-O-angeloylplenolin exerts neuroprotection against lipopolysaccharide-induced neuroinflammation in vitro and in vivo
- PMID: 31213669
- PMCID: PMC7470812
- DOI: 10.1038/s41401-019-0261-5
6-O-angeloylplenolin exerts neuroprotection against lipopolysaccharide-induced neuroinflammation in vitro and in vivo
Abstract
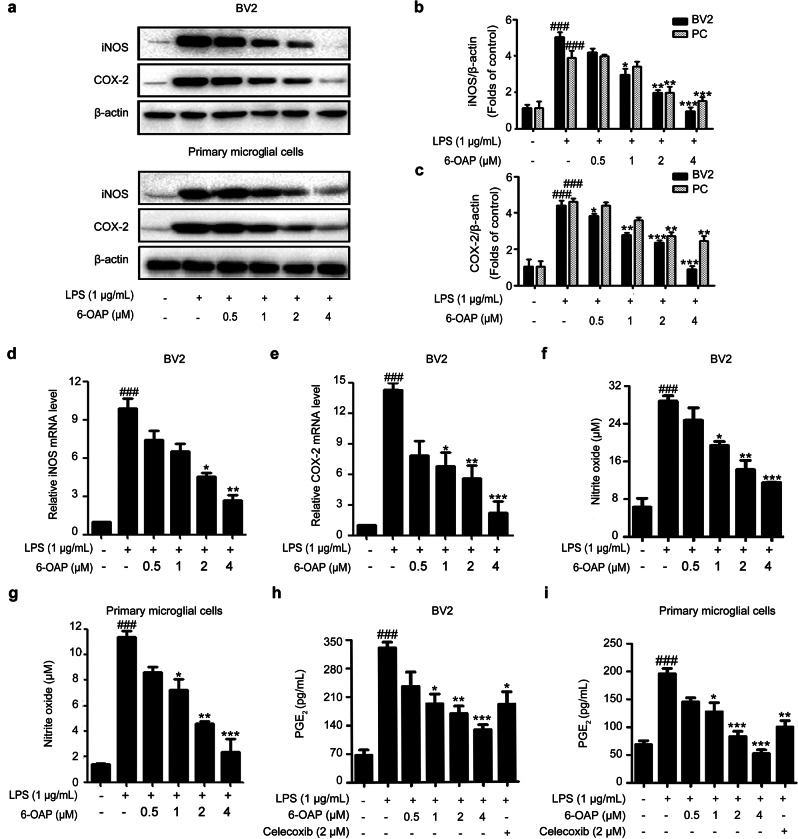
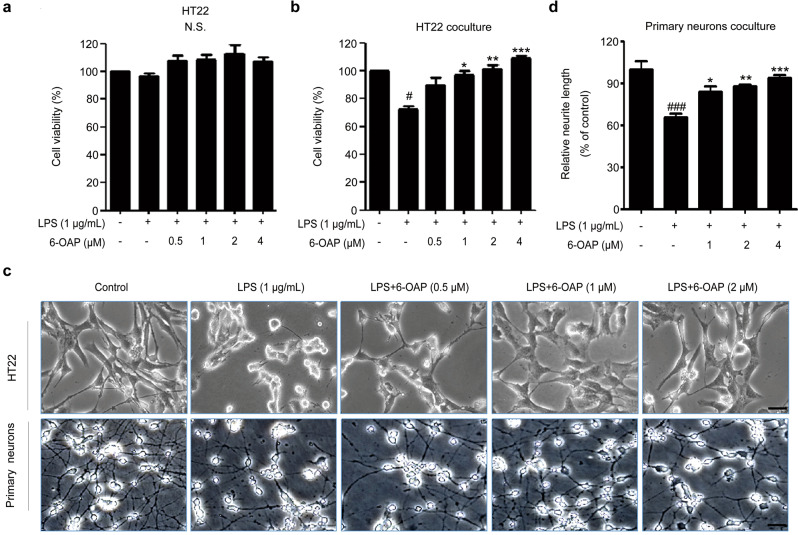
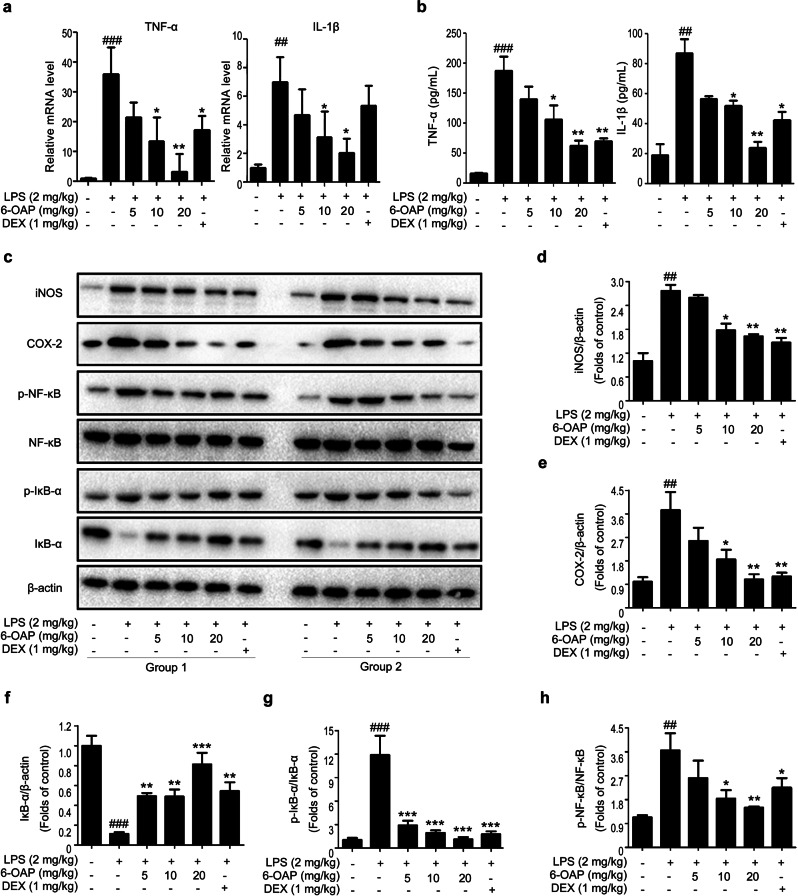
Neuroinflammation is one of the critical events in neurodegenerative diseases, whereas microglia play an important role in the pathogenesis of neuroinflammation. In this study, we investigated the effects of a natural sesquiterpene lactone, 6-O-angeloylplenolin (6-OAP), isolated from the traditional Chinese medicine Centipeda minima (L.) A.Br., on neuroinflammation and the underlying mechanisms. We showed that treatment with lipopolysaccharide (LPS) caused activation of BV2 and primary microglial cells and development of neuroinflammation in vitro, evidenced by increased production of inflammatory cytokines TNF-α and IL-1β, the phosphorylation and nuclear translocation of NF-κB, and the transcriptional upregulation of COX-2 and iNOS, leading to increased production of proinflammatory factors NO and PGE2. Moreover, LPS treatment induced oxidative stress through increasing the expression levels of NOX2 and NOX4. Pretreatment with 6-OAP (0.5-4 μM) dose-dependently attenuated LPS-induced NF-κB activation and oxidative stress, thus suppressed neuroinflammation in the cells. In a mouse model of LPS-induced neuroinflammation, 6-OAP (5-20 mg·kg-1·d-1, ip, for 7 days before LPS injection) dose-dependently inhibited the production of inflammatory cytokines, the activation of the NF-κB signaling pathway, and the expression of inflammatory enzymes in brain tissues. 6-OAP pretreatment significantly ameliorated the activation of microglia and astrocytes in the brains. 6-OAP at a high dose caused a much stronger antineuroinflammatory effect than dexamethansone (DEX). Furthermore, we demonstrated that 6-OAP pretreatment could inhibit LPS-induced neurite and synaptic loss in vitro and in vivo. In conclusion, our results demonstrate that 6-OAP exerts antineuroinflammatory effects and can be considered a novel drug candidate for the treatment of neuroinflammatory diseases.
Keywords: 6-O-angeloylplenolin; LPS; NF-κB; Traditional Chinese medicine; dexamethansone; microglia; neuroinflammation; oxidative stress.
Conflict of interest statement
The authors declare no competing interests.
Figures


Similar articles
-
Centipeda minima extract exerts antineuroinflammatory effects via the inhibition of NF-κB signaling pathway.Phytomedicine. 2020 Feb;67:153164. doi: 10.1016/j.phymed.2019.153164. Epub 2019 Dec 30. Phytomedicine. 2020. PMID: 31954258
-
Atractylodis Rhizoma Alba Attenuates Neuroinflammation in BV2 Microglia upon LPS Stimulation by Inducing HO-1 Activity and Inhibiting NF-κB and MAPK.Int J Mol Sci. 2019 Aug 17;20(16):4015. doi: 10.3390/ijms20164015. Int J Mol Sci. 2019. PMID: 31426492 Free PMC article.
-
3β-Angeloyloxy-8β,10β-dihydroxyeremophila-7(11)-en-12,8α-lactone Inhibits Lipopolysaccharide-Induced Nitric Oxide Production in RAW264.7 Cells.Biol Pharm Bull. 2015;38(6):836-43. doi: 10.1248/bpb.b14-00709. Biol Pharm Bull. 2015. PMID: 26027823
-
Promising anticancer activities and mechanisms of action of active compounds from the medicinal herb Centipeda minima (L.) A. Braun & Asch.Phytomedicine. 2022 Nov;106:154397. doi: 10.1016/j.phymed.2022.154397. Epub 2022 Aug 19. Phytomedicine. 2022. PMID: 36084403 Review.
-
EPA-enriched plasmalogen attenuates the cytotoxic effects of LPS-stimulated microglia on the SH-SY5Y neuronal cell line.Brain Res Bull. 2022 Aug;186:143-152. doi: 10.1016/j.brainresbull.2022.06.002. Epub 2022 Jun 18. Brain Res Bull. 2022. PMID: 35728742 Review.
Cited by
-
Indigenous Uses, Phytochemical Analysis, and Anti-Inflammatory Properties of Australian Tropical Medicinal Plants.Molecules. 2022 Jun 15;27(12):3849. doi: 10.3390/molecules27123849. Molecules. 2022. PMID: 35744969 Free PMC article. Review.
-
Advances in plant pathogen detection: integrating recombinase polymerase amplification with CRISPR/Cas systems.3 Biotech. 2024 Sep;14(9):214. doi: 10.1007/s13205-024-04055-x. Epub 2024 Aug 27. 3 Biotech. 2024. PMID: 39211481 Free PMC article. Review.
-
Sirt2 in the Spinal Cord Regulates Chronic Neuropathic Pain Through Nrf2-Mediated Oxidative Stress Pathway in Rats.Front Pharmacol. 2021 Apr 9;12:646477. doi: 10.3389/fphar.2021.646477. eCollection 2021. Front Pharmacol. 2021. PMID: 33897435 Free PMC article.
-
H2S Alleviates Neuropathic Pain in Mice by Nrf2 Signaling Pathway Activation.J Mol Neurosci. 2023 Jun;73(6):456-468. doi: 10.1007/s12031-023-02134-x. Epub 2023 Jun 9. J Mol Neurosci. 2023. PMID: 37294481
-
Supplementation of Carvacrol Attenuates Hippocampal Tumor Necrosis Factor-Alpha Level, Oxidative Stress, and Learning and Memory Dysfunction in Lipopolysaccharide-Exposed Rats.Adv Biomed Res. 2022 Apr 29;11:33. doi: 10.4103/abr.abr_194_21. eCollection 2022. Adv Biomed Res. 2022. PMID: 35720215 Free PMC article.
References
-
- Eikelenboom P, Bate C, Van Gool WA, Hoozemans JJ, Rozemuller JM, Veerhuis R, Williams A. Neuroinflammation in Alzheimer’s disease and prion disease. Glia. 2002;40:232–39. - PubMed
-
- Kim YS, Joh TH. Microglia, major player in the brain inflammation: their roles in the pathogenesis of Parkinson’s disease. Exp Mol Med. 2006;38:333–47. - PubMed
-
- McGeer EG, McGeer PL. Inflammatory processes in Alzheimer’s disease. Prog Neuropsychopharmacol Biol Psychiatry. 2003;27:741–49. - PubMed
-
- Sanders P, De Keyser J. Janus faces of microglia in multiple sclerosis. Brain Res Rev. 2007;54:274–85. - PubMed
MeSH terms
Substances
LinkOut - more resources
Full Text Sources
Other Literature Sources
Medical
Research Materials
Miscellaneous
