

Proestrus Differentially Regulates Expression of Ion Channel and Calcium Homeostasis Genes in GnRH Neurons of Mice
- PMID: 31213979
- PMCID: PMC6554425
- DOI: 10.3389/fnmol.2019.00137
Proestrus Differentially Regulates Expression of Ion Channel and Calcium Homeostasis Genes in GnRH Neurons of Mice
Abstract
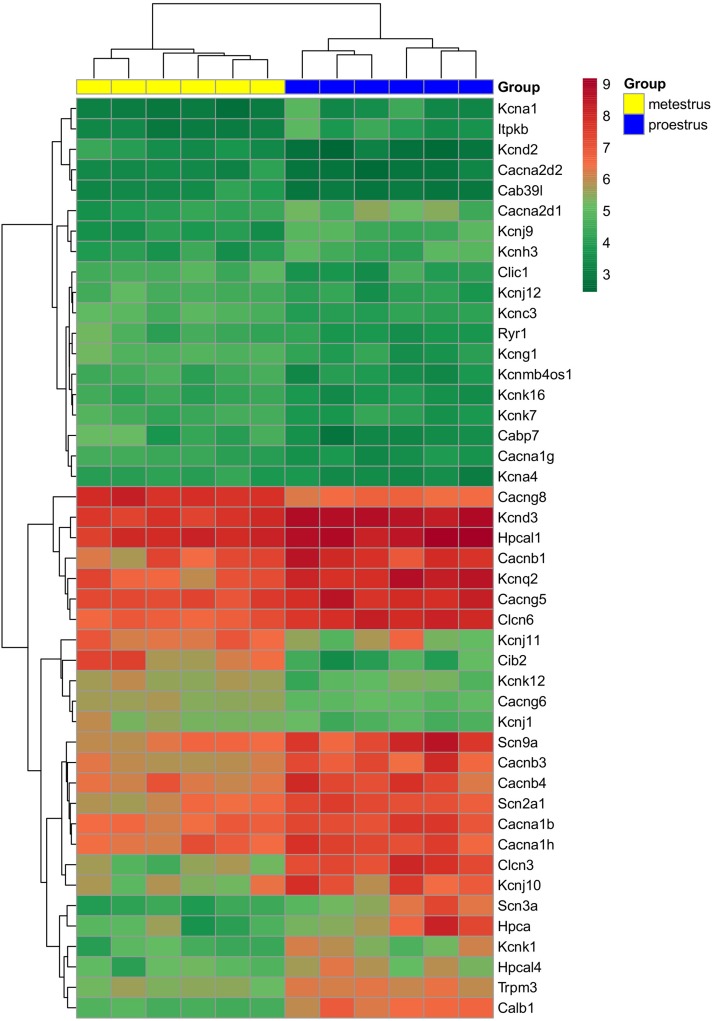
In proestrus, the changing gonadal hormone milieu alters the physiological properties of GnRH neurons and contributes to the development of the GnRH surge. We hypothesized that proestrus also influences the expression of different ion channel genes in mouse GnRH neurons. Therefore, we performed gene expression profiling of GnRH neurons collected from intact, proestrous and metestrous GnRH-GFP transgenic mice, respectively. Proestrus changed the expression of 37 ion channel and 8 calcium homeostasis-regulating genes. Voltage-gated sodium channels responded with upregulation of three alpha subunits (Scn2a1, Scn3a, and Scn9a). Within the voltage-gated potassium channel class, Kcna1, Kcnd3, Kcnh3, and Kcnq2 were upregulated, while others (Kcna4, Kcnc3, Kcnd2, and Kcng1) underwent downregulation. Proestrus also had impact on inwardly rectifying potassium channel subunits manifested in enhanced expression of Kcnj9 and Kcnj10 genes, whereas Kcnj1, Kcnj11, and Kcnj12 subunit genes were downregulated. The two-pore domain potassium channels also showed differential expression with upregulation of Kcnk1 and reduced expression of three subunit genes (Kcnk7, Kcnk12, and Kcnk16). Changes in expression of chloride channels involved both the voltage-gated (Clcn3 and Clcn6) and the intracellular (Clic1) subtypes. Regarding the pore-forming alpha-1 subunits of voltage-gated calcium channels, two (Cacna1b and Cacna1h) were upregulated, while Cacna1g showed downregulation. The ancillary subunits were also differentially regulated (Cacna2d1, Cacna2d2, Cacnb1, Cacnb3, Cacnb4, Cacng5, Cacng6, and Cacng8). In addition, ryanodine receptor 1 (Ryr1) gene was downregulated, while a transient receptor potential cation channel (Trpm3) gene showed enhanced expression. Genes encoding proteins regulating the intracellular calcium homeostasis were also influenced (Calb1, Hpca, Hpcal1, Hpcal4, Cabp7, Cab 39l, and Cib2). The differential expression of genes coding for ion channel proteins in GnRH neurons at late proestrus indicates that the altering hormone milieu contributes to remodeling of different kinds of ion channels of GnRH neurons, which might be a prerequisite of enhanced cellular activity of GnRH neurons and the subsequent surge release of the neurohormone.
Keywords: GnRH; gene expression; ion channels; mouse; neurons; proestrus; transcriptome.
Figures

Similar articles
-
Gonadal Cycle-Dependent Expression of Genes Encoding Peptide-, Growth Factor-, and Orphan G-Protein-Coupled Receptors in Gonadotropin- Releasing Hormone Neurons of Mice.Front Mol Neurosci. 2021 Jan 18;13:594119. doi: 10.3389/fnmol.2020.594119. eCollection 2020. Front Mol Neurosci. 2021. PMID: 33551743 Free PMC article.
-
Impact of Proestrus on Gene Expression in the Medial Preoptic Area of Mice.Front Cell Neurosci. 2017 Jul 4;11:183. doi: 10.3389/fncel.2017.00183. eCollection 2017. Front Cell Neurosci. 2017. PMID: 28725181 Free PMC article.
-
Differential Gene Expression in Gonadotropin-Releasing Hormone Neurons of Male and Metestrous Female Mice.Neuroendocrinology. 2015;102(1-2):44-59. doi: 10.1159/000430818. Epub 2015 Apr 29. Neuroendocrinology. 2015. PMID: 25925152
-
Transient receptor potential (TRP) channel function in the reproductive axis.Cell Calcium. 2017 Nov;67:138-147. doi: 10.1016/j.ceca.2017.04.004. Epub 2017 May 3. Cell Calcium. 2017. PMID: 28522036 Review.
-
Molecular diversity of vascular potassium channel isoforms.Clin Exp Pharmacol Physiol. 2002 Apr;29(4):317-23. doi: 10.1046/j.1440-1681.2002.03651.x. Clin Exp Pharmacol Physiol. 2002. PMID: 11985543 Review.
Cited by
-
In vivo spontaneous activity and coital-evoked inhibition of mouse accessory olfactory bulb output neurons.iScience. 2023 Aug 7;26(9):107545. doi: 10.1016/j.isci.2023.107545. eCollection 2023 Sep 15. iScience. 2023. PMID: 37664596 Free PMC article.
-
Role of potassium channels in female reproductive system.Obstet Gynecol Sci. 2020 Sep;63(5):565-576. doi: 10.5468/ogs.20064. Epub 2020 Aug 25. Obstet Gynecol Sci. 2020. PMID: 32838485 Free PMC article.
-
Detection of loci exhibiting pleiotropic effects on body weight and egg number in female broilers.Sci Rep. 2021 Apr 2;11(1):7441. doi: 10.1038/s41598-021-86817-8. Sci Rep. 2021. PMID: 33811218 Free PMC article.
-
gBLUP-GWAS identifies candidate genes, signaling pathways, and putative functional polymorphisms for age at puberty in gilts.J Anim Sci. 2023 Jan 3;101:skad063. doi: 10.1093/jas/skad063. J Anim Sci. 2023. PMID: 36848325 Free PMC article.
-
Estradiol regulates voltage-gated potassium currents in corticotropin-releasing hormone neurons.J Exp Biol. 2023 Mar 1;226(5):jeb245222. doi: 10.1242/jeb.245222. Epub 2023 Mar 10. J Exp Biol. 2023. PMID: 36805713 Free PMC article.
References
-
- Bosma M. M. (1993). Ion channel properties and episodic activity in isolated immortalized gonadotropin-releasing hormone (GnRH) neurons. J. Membr. Biol. 136 85–96. - PubMed
LinkOut - more resources
Full Text Sources
Research Materials
Miscellaneous