

Resting-State Brain Network Dysfunctions Associated With Visuomotor Impairments in Autism Spectrum Disorder
- PMID: 31213995
- PMCID: PMC6554427
- DOI: 10.3389/fnint.2019.00017
Resting-State Brain Network Dysfunctions Associated With Visuomotor Impairments in Autism Spectrum Disorder
Abstract
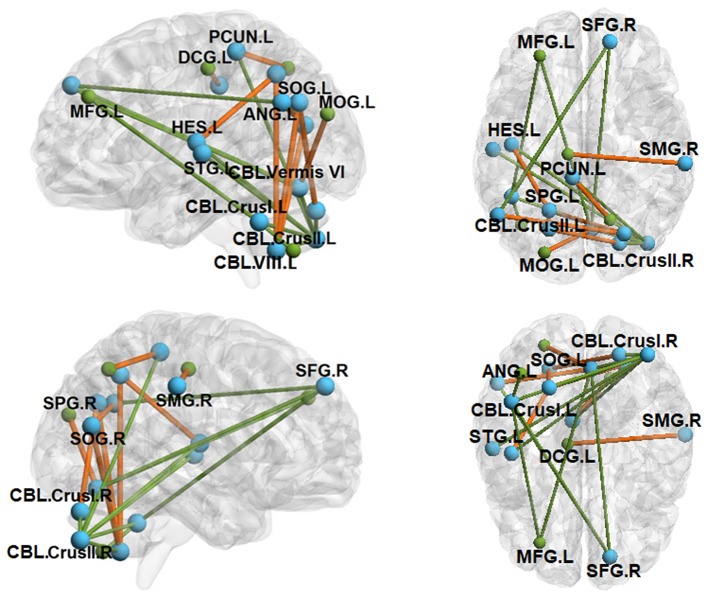
Background: Individuals with autism spectrum disorder (ASD) show elevated levels of motor variability that are associated with clinical outcomes. Cortical-cerebellar networks involved in visuomotor control have been implicated in postmortem and anatomical imaging studies of ASD. However, the extent to which these networks show intrinsic functional alterations in patients, and the relationship between intrinsic functional properties of cortical-cerebellar networks and visuomotor impairments in ASD have not yet been clarified. Methods: We examined the amplitude of low-frequency fluctuation (ALFF) of cortical and cerebellar brain regions during resting-state functional MRI (rs-fMRI) in 23 individuals with ASD and 16 typically developing (TD) controls. Regions of interest (ROIs) with ALFF values significantly associated with motor variability were identified for for patients and controls respectively, and their functional connectivity (FC) to each other and to the rest of the brain was examined. Results: For TD controls, greater ALFF in bilateral cerebellar crus I, left superior temporal gyrus, left inferior frontal gyrus, right supramarginal gyrus, and left angular gyrus each were associated with greater visuomotor variability. Greater ALFF in cerebellar lobule VIII was associated with less visuomotor variability. For individuals with ASD, greater ALFF in right calcarine cortex, right middle temporal gyrus (including MT/V5), left Heschl's gyrus, left post-central gyrus, right pre-central gyrus, and left precuneus was related to greater visuomotor variability. Greater ALFF in cerebellar vermis VI was associated with less visuomotor variability. Individuals with ASD and TD controls did not show differences in ALFF for any of these ROIs. Individuals with ASD showed greater posterior cerebellar connectivity with occipital and parietal cortices relative to TD controls, and reduced FC within cerebellum and between lateral cerebellum and pre-frontal and other regions of association cortex. Conclusion: Together, these findings suggest that increased resting oscillations within visuomotor networks in ASD are associated with more severe deficits in controlling variability during precision visuomotor behavior. Differences between individuals with ASD and TD controls in the topography of networks showing relationships to visuomotor behavior suggest atypical patterns of cerebellar-cortical specialization and connectivity in ASD that underlies previously documented visuomotor deficits.
Keywords: amplitude of low-frequency fluctuations; autism spectrum disorder; cortical–cerebellar connectivity; functional connectivity; precision grip; resting-state functional MRI; visuomotor control.
Figures


Similar articles
-
Cortical and subcortical alterations associated with precision visuomotor behavior in individuals with autism spectrum disorder.J Neurophysiol. 2019 Oct 1;122(4):1330-1341. doi: 10.1152/jn.00286.2019. Epub 2019 Jul 17. J Neurophysiol. 2019. PMID: 31314644 Free PMC article.
-
Cerebellar Volumes and Sensorimotor Behavior in Autism Spectrum Disorder.Front Integr Neurosci. 2022 May 3;16:821109. doi: 10.3389/fnint.2022.821109. eCollection 2022. Front Integr Neurosci. 2022. PMID: 35592866 Free PMC article.
-
Visuomotor brain network activation and functional connectivity among individuals with autism spectrum disorder.Hum Brain Mapp. 2022 Feb 1;43(2):844-859. doi: 10.1002/hbm.25692. Epub 2021 Oct 30. Hum Brain Mapp. 2022. PMID: 34716740 Free PMC article.
-
Common and distinct patterns of intrinsic brain activity alterations in major depression and bipolar disorder: voxel-based meta-analysis.Transl Psychiatry. 2020 Oct 19;10(1):353. doi: 10.1038/s41398-020-01036-5. Transl Psychiatry. 2020. PMID: 33077728 Free PMC article. Review.
-
Systematic review and meta-analysis: multimodal functional and anatomical neural alterations in autism spectrum disorder.Mol Autism. 2024 Apr 4;15(1):16. doi: 10.1186/s13229-024-00593-6. Mol Autism. 2024. PMID: 38576034 Free PMC article.
Cited by
-
Autistic Children Use Less Efficient Goal-Directed Whole Body Movements Compared to Neurotypical Development.J Autism Dev Disord. 2023 Jul;53(7):2806-2817. doi: 10.1007/s10803-022-05523-0. Epub 2022 Apr 20. J Autism Dev Disord. 2023. PMID: 35441912 Free PMC article.
-
Community-based postural control assessment in autistic individuals indicates a similar but delayed trajectory compared to neurotypical individuals.Autism Res. 2023 Mar;16(3):543-557. doi: 10.1002/aur.2889. Epub 2023 Jan 10. Autism Res. 2023. PMID: 36627838 Free PMC article.
-
Visual and somatosensory feedback mechanisms of precision manual motor control in autism spectrum disorder.J Neurodev Disord. 2021 Sep 8;13(1):32. doi: 10.1186/s11689-021-09381-2. J Neurodev Disord. 2021. PMID: 34496766 Free PMC article.
-
Cerebellar contributions to fear-based emotional processing: relevance to understanding the neural circuits involved in autism.Front Syst Neurosci. 2023 Nov 21;17:1229627. doi: 10.3389/fnsys.2023.1229627. eCollection 2023. Front Syst Neurosci. 2023. PMID: 38075533 Free PMC article. Review.
-
Attenuated effective connectivity of large-scale brain networks in children with autism spectrum disorders.Front Neurosci. 2022 Nov 29;16:987248. doi: 10.3389/fnins.2022.987248. eCollection 2022. Front Neurosci. 2022. PMID: 36523439 Free PMC article.
References
-
- American Psychiatric Association (2013). Diagnostic and Statistical Manual of Mental Disorders: DSM-5. Arlington, VA: American Psychiatric Association; 10.1176/appi.books.9780890425596 - DOI
Grants and funding
LinkOut - more resources
Full Text Sources