

Age, Height, and Sex on Motor Evoked Potentials: Translational Data From a Large Italian Cohort in a Clinical Environment
- PMID: 31214003
- PMCID: PMC6558095
- DOI: 10.3389/fnhum.2019.00185
Age, Height, and Sex on Motor Evoked Potentials: Translational Data From a Large Italian Cohort in a Clinical Environment
Abstract
Introduction: Motor evoked potentials (MEPs) to transcranial magnetic stimulation (TMS) are known to be susceptible to several sources of variability. However, conflicting evidences on individual characteristics in relatively small sample sizes have been reported. We investigated the effect of age, height, and sex on MEPs of the motor cortex and spinal roots in a large cohort.
Methods: A total of 587 subjects clinically and neuroradiologically intact were included. MEPs were recorded during mild tonic contraction through a circular coil applied over the "hot spot" of the first dorsal interosseous and tibialis anterior muscles (TAs), bilaterally. Central motor conduction time (CMCT) was estimated as the difference between MEP cortical latency and the peripheral motor conduction time (PMCT) by cervical or lumbar magnetic stimulation. Peak-to-peak MEP amplitude to cortical stimulation and right-to-left difference of each parameter were also measured.
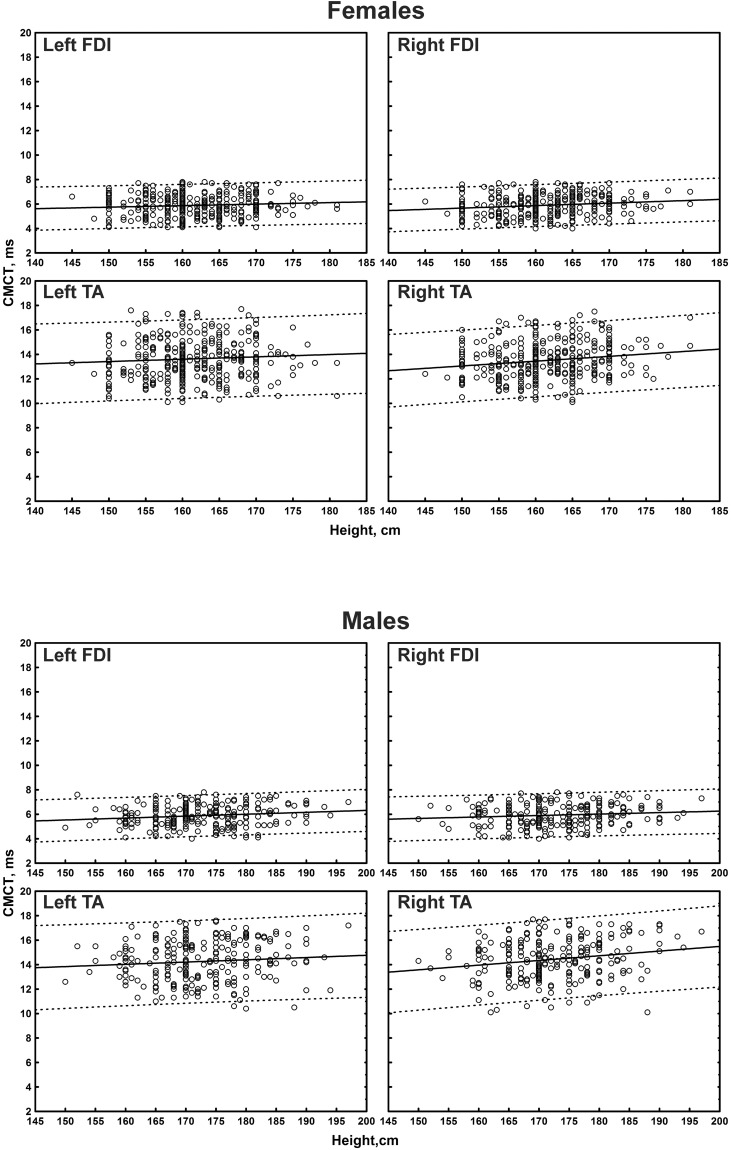
Results: After Bonferroni correction, general linear (multiple) regression analysis showed that both MEP cortical latency and PMCT at four limbs positively correlated with age and height. At lower limbs, an independent effect of sex on the same measures was also observed (with females showing smaller values than males). CMCT correlated with both age (negatively) and height (positively) when analyzed by a single regression; however, with a multiple regression analysis this significance disappeared, due to the correction for the multicollinearity within the dataset.
Conclusion: Physical individual features need to be considered for a more accurate and meaningful MEPs interpretation. Both in clinical practice and in research setting, patients and controls should be matched for age, height, and sex.
Keywords: central motor conduction time; motor evoked potentials; physical variables; reference values; transcranial magnetic stimulation; translational neurophysiology.
Figures


Similar articles
-
Sex-specific reference values for total, central, and peripheral latency of motor evoked potentials from a large cohort.Front Hum Neurosci. 2023 Jun 9;17:1152204. doi: 10.3389/fnhum.2023.1152204. eCollection 2023. Front Hum Neurosci. 2023. PMID: 37362949 Free PMC article.
-
Motor evoked potentials by transcranial magnetic stimulation in healthy elderly people.Somatosens Mot Res. 2013 Dec;30(4):201-5. doi: 10.3109/08990220.2013.796922. Epub 2013 Jun 14. Somatosens Mot Res. 2013. PMID: 23767989
-
The influence of gender, hand dominance, and upper extremity length on motor evoked potentials.J Clin Monit Comput. 2010 Dec;24(6):427-36. doi: 10.1007/s10877-010-9267-8. Epub 2010 Nov 26. J Clin Monit Comput. 2010. PMID: 21110222
-
Central and Peripheral Motor Conduction Studies by Single-Pulse Magnetic Stimulation.J Clin Neurol. 2024 May;20(3):241-255. doi: 10.3988/jcn.2023.0520. J Clin Neurol. 2024. PMID: 38713075 Free PMC article. Review.
-
Magnetic-motor-root stimulation: review.Clin Neurophysiol. 2013 Jun;124(6):1055-67. doi: 10.1016/j.clinph.2012.12.049. Epub 2013 Feb 26. Clin Neurophysiol. 2013. PMID: 23485367 Review.
Cited by
-
Intracortical and Intercortical Motor Disinhibition to Transcranial Magnetic Stimulation in Newly Diagnosed Celiac Disease Patients.Nutrients. 2021 May 1;13(5):1530. doi: 10.3390/nu13051530. Nutrients. 2021. PMID: 34062843 Free PMC article.
-
Preserved central cholinergic functioning to transcranial magnetic stimulation in de novo patients with celiac disease.PLoS One. 2021 Dec 16;16(12):e0261373. doi: 10.1371/journal.pone.0261373. eCollection 2021. PLoS One. 2021. PMID: 34914787 Free PMC article.
-
Pairing Transcranial Magnetic Stimulation and Loud Sounds Produces Plastic Changes in Motor Output.J Neurosci. 2023 Apr 5;43(14):2469-2481. doi: 10.1523/JNEUROSCI.0228-21.2022. Epub 2023 Mar 1. J Neurosci. 2023. PMID: 36859307 Free PMC article.
-
NAIAD-2020: Characteristics of Motor Evoked Potentials After 3-Day Exposure to Dry Immersion in Women.Front Hum Neurosci. 2021 Dec 1;15:753259. doi: 10.3389/fnhum.2021.753259. eCollection 2021. Front Hum Neurosci. 2021. PMID: 34924980 Free PMC article.
-
TMS Correlates of Pyramidal Tract Signs and Clinical Motor Status in Patients with Cervical Spondylotic Myelopathy.Brain Sci. 2020 Oct 31;10(11):806. doi: 10.3390/brainsci10110806. Brain Sci. 2020. PMID: 33142762 Free PMC article.
References
-
- Barker A. T., Freeston I. L., Jalinous R., Jarratt J. A. (1987). Magnetic stimulation of the human brain and peripheral nervous system: an introduction and the results of an initial clinical evaluation. Neurosurgery 20 100–109. - PubMed
LinkOut - more resources
Full Text Sources