. 2019 Jun 4:10:1141.
doi: 10.3389/fimmu.2019.01141. eCollection 2019.

High Salt Inhibits Tumor Growth by Enhancing Anti-tumor Immunity

Affiliations

High Salt Inhibits Tumor Growth by Enhancing Anti-tumor Immunity

Ralf Willebrand et al. Front Immunol. .

Abstract

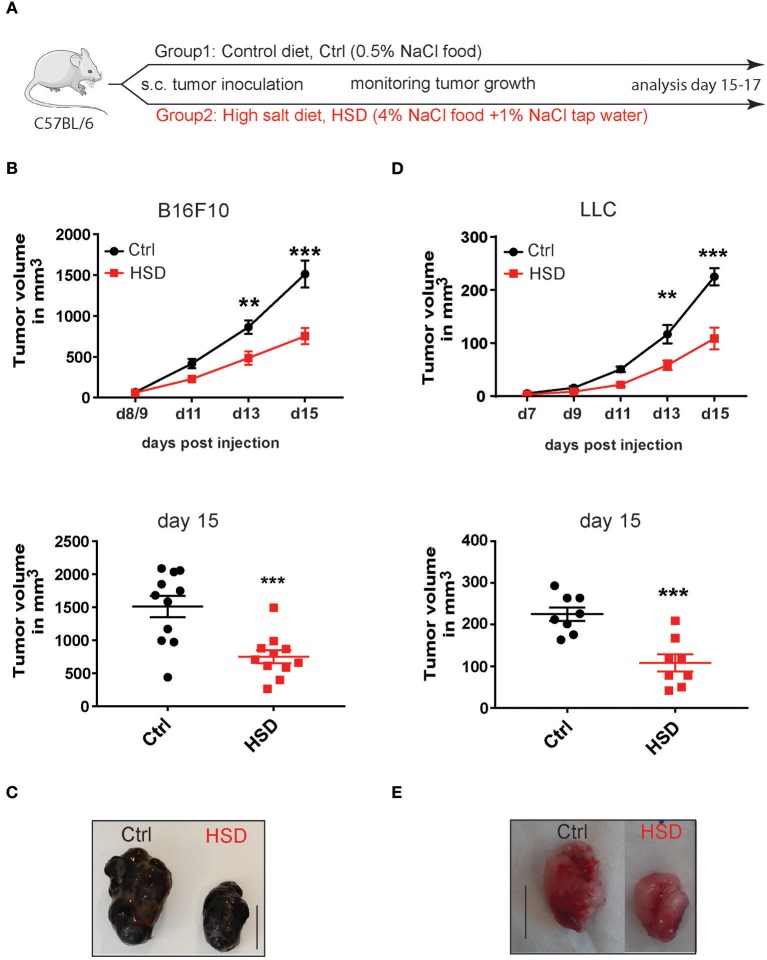
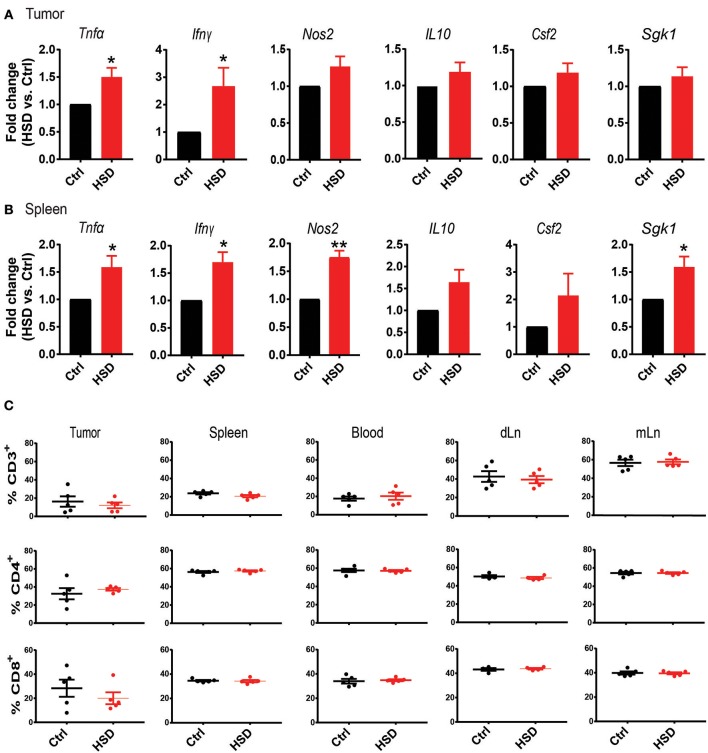
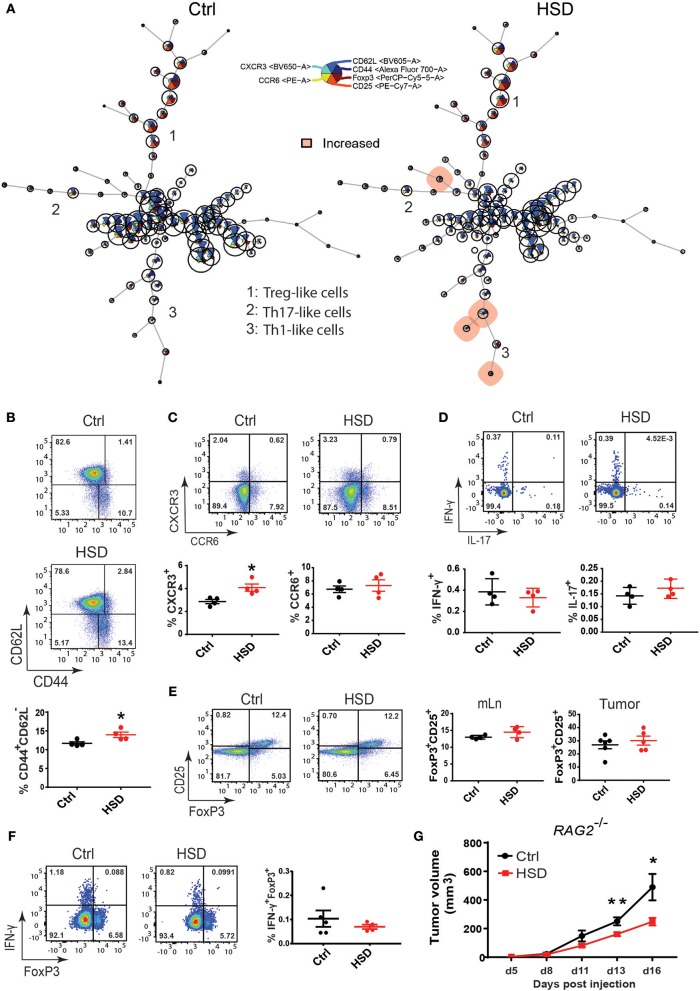
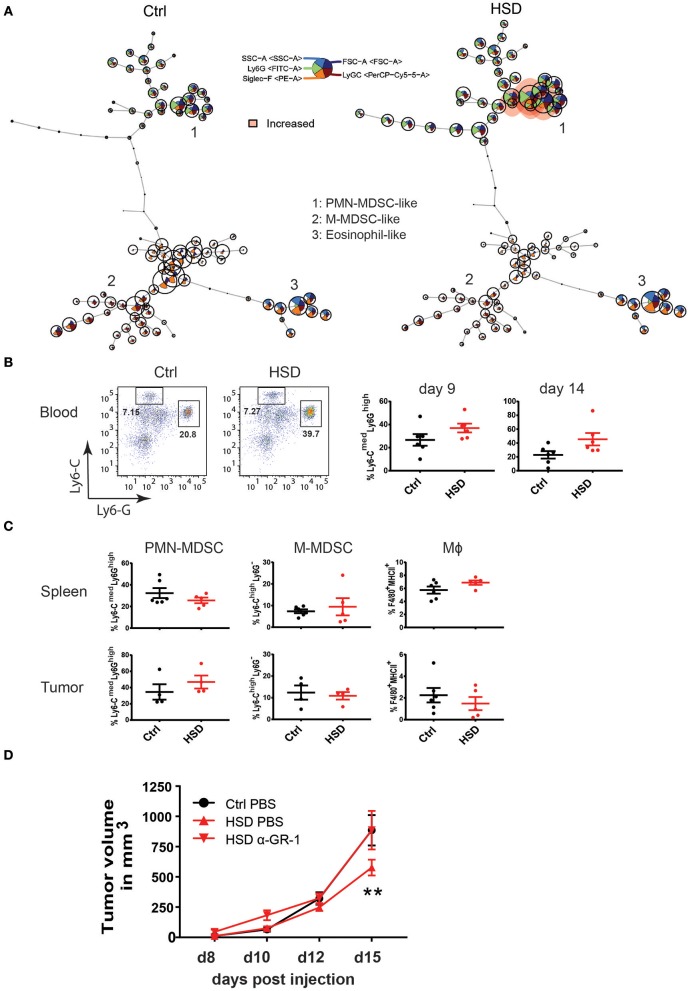
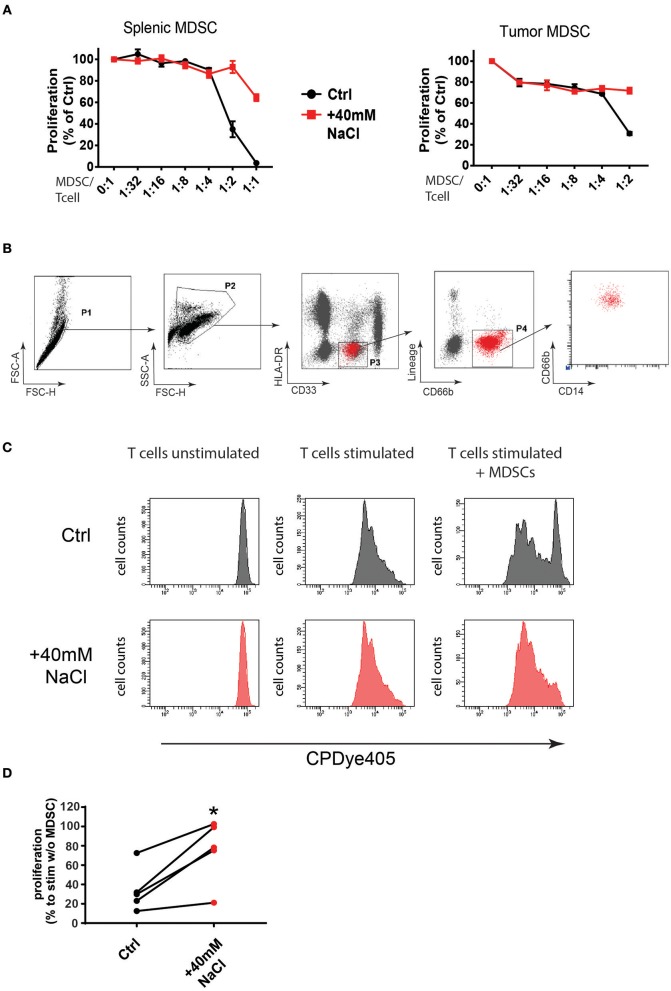
Excess salt intake could affect the immune system by shifting the immune cell balance toward a pro-inflammatory state. Since this shift of the immune balance is thought to be beneficial in anti-cancer immunity, we tested the impact of high salt diets on tumor growth in mice. Here we show that high salt significantly inhibited tumor growth in two independent murine tumor transplantation models. Although high salt fed tumor-bearing mice showed alterations in T cell populations, the effect seemed to be largely independent of adaptive immune cells. In contrast, depletion of myeloid-derived suppressor cells (MDSCs) significantly reverted the inhibitory effect on tumor growth. In line with this, high salt conditions almost completely blocked murine MDSC function in vitro. Importantly, similar effects were observed in human MDSCs isolated from cancer patients. Thus, high salt conditions seem to inhibit tumor growth by enabling more pronounced anti-tumor immunity through the functional modulation of MDSCs. Our findings might have critical relevance for cancer immunotherapy.

Keywords: MDSC; cancer; cancer immunotherapy; dietary factor; sodium chloride (dietary).


Figures

Figure 1
Figure 1
High salt diet inhibits tumor growth in mice. (A) Experimental design. C57BL/6 mice were kept on control diet (Ctrl) or were fed a high salt diet (HSD) before tumor inoculation. After tumor challenge the mice were further kept on the same diets until sacrifice. (B) Mice pre-fed on the respective diets were challenged with B16F10 melanoma cells by subcutaneous (s.c.) injection. Growth curve and dotplot shows tumor volume as mean ± S.E.M. (n = 11) at the indicated time points pooled from two of three independent experiments with similar results. (C) Representative pictures were taken from tumors of control and HSD fed mice at day 15 post-induction (p.i.) (scale bar = 1 cm). (D) Mice that were fed a control diet or HSD for 2 weeks were subcutaneously injected with Lewis lung carcinoma cells (LLC) and tumor growth was monitored over time. Growth curve and dotplots shows tumor volume as mean ± S.E.M. (n = 8) at the indicated time points from one representative of three independent experiments with at least 5 mice per group. (E) Representative pictures were taken from LLC tumors of control and HSD fed mice at day 20 p.i. (scale bar = 1 cm). Statistical analysis was performed by Two-way repeated-measure Anova test (**p < 0.01, ***p < 0.001).
Figure 2
Figure 2
High salt diet creates a pro-inflammatory environment in tumor-bearing mice. (A) Quantitative RT-PCR analysis of LLC tumor tissue. Bar graphs show fold change as mean ± S.E.M. from HSD samples normalized to control samples. Data are pooled from two independent experiments (n = 8–10). (B) Quantitative RT-PCR analysis of spleen samples from LLC tumor-bearing mice. Bar graphs show fold change as mean ± S.E.M. from HSD samples normalized to control samples (n = 5). (C) Tumors as well as the indicated organs from tumor-bearing mice were subjected to FACS analysis of T cell subsets. Cellular events were defined according to an extended lymphocyte gate, excluding doublets and dead cells. T cells were defined as CD3+ and further gated according to CD4 and CD8 expression. Bar graphs show mean ± S.E.M. of CD3+ cells (upper row), CD4+ T cells (center row, gated on CD3+), and CD8+ T cells (lower row, gated on CD3+). Samples were analyzed on day 15–17 p.i. statistical significance was determined by t-test (*p < 0.05, **p < 0.01).
Figure 3
Figure 3
The impact of T cells on high salt mediated reduced tumor growth. (A) FlowSOM visualization of flow cytometry data across mesenteric lymph nodes (mLN). Single live CD4+ cells for each sample (Ctrl, n = 4; HSD, n = 4) were exported and concatenated then analyzed using FlowSOM, which arranges the cells into clusters (represented by circles) according to similarities in their expression profiles. Each node represents one cluster (total = 100 nodes). Colored nodes highlight statistically significant changes (p < 0.05) in cell population between two groups (HSD and Ctrl). (B) The same mLN samples as in (A) were analyzed by manual gating for (B) CD4+ effector-memory T cells (CD44+CD62L). (C) Th1-like cells (CD4+CXCR3+) and Th17-like cells (CD4+CCR6+). (D) IL-17 and IFNγ producing CD4+ T cells after PMA/Ionomycin restimulation and intracellular staining. Statistical significance was determined by unpaired t-test (*p < 0.05). (E) FoxP3+CD25+ regulatory T cells in tumor-bearing mice. FACS plots show the indicated parameters after pre-gating on CD3+CD4+ T cells. Dotplots show frequency of the indicated populations as mean ± S.E.M. (n = 4/group) representative of three independent experiments. (F) IFNγ-producing regulatory T cells after restimulation of mLN single cell suspensions from LLC tumor-bearing mice. Representative FACS plots show FoxP3 against IFNγ after pre-gating on CD3+CD4+ T cells. Dotplots show frequency of FoxP3+IFNγ+ cells as mean ± S.E.M. from 4 to 5 mice in each group. Similar results were obtained from B16 tumor-bearing mice. (G) RAG2−/− mice were fed a high salt diet (HSD) or control diet (Ctrl) and challenged with LLC tumor cells. Growth curve shows tumor volume as mean ± S.E.M. for 7 mice in each group. Statistical analysis was performed by Two-way repeated-measure Anova test (*p < 0.05, **p < 0.01).
Figure 4
Figure 4
High salt diet mediates changes in myeloid cells in tumor-bearing mice. (A) FlowSOM visualization of flow cytometry data in blood. Single live CD45+CD11b+ cells for each sample (Ctrl and HSD, n = 6/group) were exported and concatenated then analyzed using FlowSOM, which arranges the cells into clusters (represented by circles) according to similarities in their expression profiles. Each node represents one cluster (total = 100 nodes). Colored nodes highlight statistically significant changes (p < 0.05) in cell population between two groups (HSD and Ctrl). (B) Blood samples from B16 tumor-bearing mice were analyzed for MDSC populations at day 9 and 14 p.i. FACS plots show representative distribution of M-MDSC-like cells (Ly6-ChighLyG and PMN-MDSC-like cells (Ly6CmedLy6-Ghigh) after gating on CD11b+ cells. Bar graphs show the frequency of each population in high salt diet fed mice (HSD) compared to control mice (Ctrl) as mean ± S.E.M. from 6 mice in each group. Statistical significance was determined by unpaired t-test. (C) Single cell suspensions from spleens and tumors were analyzed as in (B) at day 16. Dotplots show the frequency of each population in high salt diet fed mice (HSD) compared to control mice (Ctrl) as mean ± S.E.M. from 5 to 6 mice in each group. (D) High salt diet (HSD) fed mice were treated with an anti-GR-1 antibody or PBS as control from day 4 after B16 melanoma cell inoculation on consecutively every second day. Growth curve shows tumor volume as mean ± S.E.M. of 5 mice in each group. Statistical analysis was performed by Two-way repeated-measure Anova (**p < 0.01).
Figure 5
Figure 5
High salt conditions block murine and human MDSC function in vitro. (A) MDSCs isolated from LLC tumors and spleens of tumor-bearing mice were cultured with splenocytes at the indicated ratios in the presence of anti-CD3/CD28 stimulating antibodies. Cells were either cultured under high salt (+40 mM NaCl) or control conditions (Ctrl). Proliferation of responder splenocytes was measured by 3H-thymidin incorporation. Curves show proliferation normalized to controls (stimulated splenocytes without addition of MDSCs) as mean ± S.E.M from triplicates representative for three independent experiments with similar results. (B) PMN-MDSCs were sorted from PBMCs of patients with oropharynx or bladder cancer. FACS plots show the gating strategy. (C) FACS purified human PMN-MDSC were co-cultured with CPDye405-labeled autologous CD3+ T cells under control (Ctrl) or high salt conditions (+40 mM NaCl) for 4 days at a 1:2.5 ratio. FACS histograms from a representative patient are shown. (D) Graph shows proliferation index from five independent patients under control or high salt (+40 mM NaCl) conditions. Statistical significance was determined by unpaired t-test (*p < 0.05).

Similar articles

Cited by

References

    1. Kleinewietfeld M, Manzel A, Titze J, Kvakan H, Yosef N, Linker RA, et al. . Sodium chloride drives autoimmune disease by the induction of pathogenic TH17 cells. Nature. (2013) 496:518–22. 10.1038/nature11868 - DOI - PMC - PubMed
    1. Jantsch J, Schatz V, Friedrich D, Schroder A, Kopp C, Siegert I, et al. . Cutaneous Na+ storage strengthens the antimicrobial barrier function of the skin and boosts macrophage-driven host defense. Cell Metab. (2015) 21:493–501. 10.1016/j.cmet.2015.02.003 - DOI - PMC - PubMed
    1. Binger KJ, Gebhardt M, Heinig M, Rintisch C, Schroeder A, Neuhofer W, et al. . High salt reduces the activation of IL-4- and IL-13-stimulated macrophages. J Clin Invest. (2015) 125:4223–38. 10.1172/JCI80919 - DOI - PMC - PubMed
    1. Wilck N, Matus MG, Kearney SM, Olesen SW, Forslund K, Bartolomaeus H, et al. . Salt-responsive gut commensal modulates TH17 axis and disease. Nature. (2017) 551:585–9. 10.1038/nature24628 - DOI - PMC - PubMed
    1. Brown IJ, Tzoulaki I, Candeias V, Elliott P. Salt intakes around the world: implications for public health. Int J Epidemiol. (2009) 38:791–813. 10.1093/ije/dyp139 - DOI - PubMed

Publication types