. 2019 Jun 4:10:1235.
doi: 10.3389/fimmu.2019.01235. eCollection 2019.

Probiotics Lactobacillus reuteri Abrogates Immune Checkpoint Blockade-Associated Colitis by Inhibiting Group 3 Innate Lymphoid Cells

Affiliations

Probiotics Lactobacillus reuteri Abrogates Immune Checkpoint Blockade-Associated Colitis by Inhibiting Group 3 Innate Lymphoid Cells

Tingting Wang et al. Front Immunol. .

Abstract

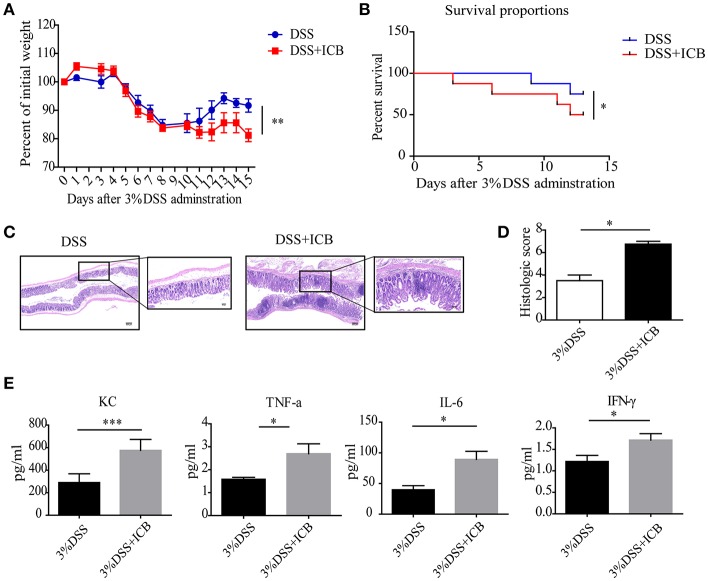
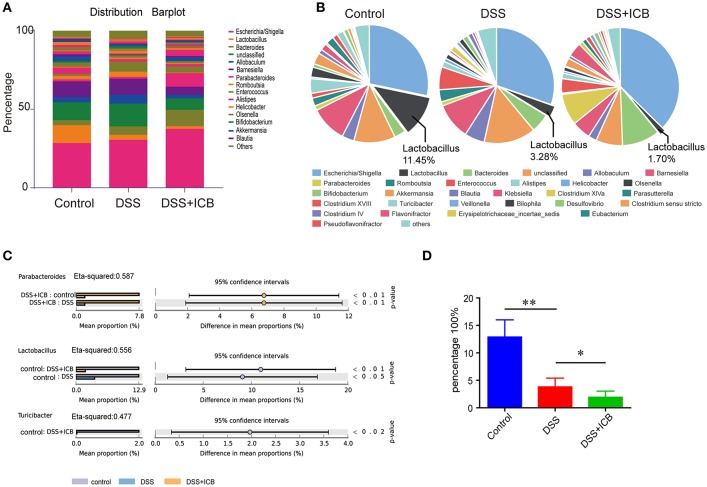
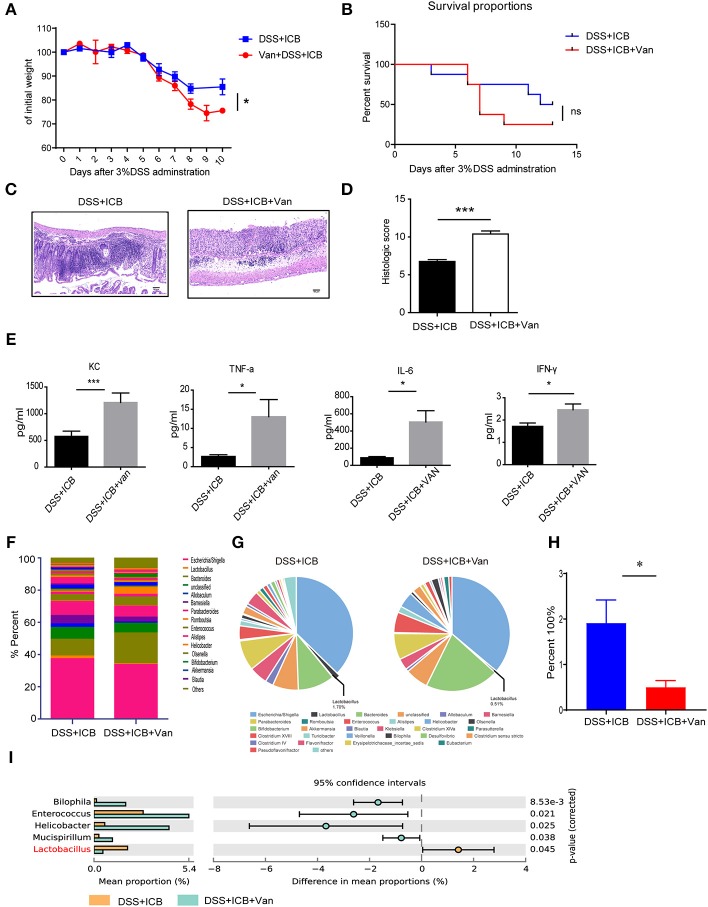
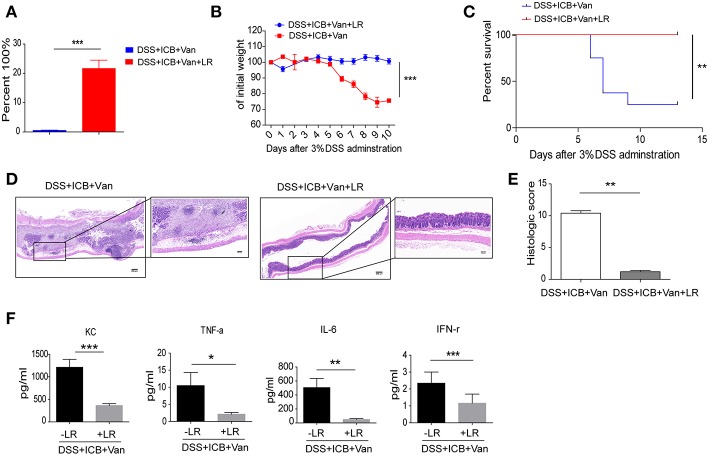
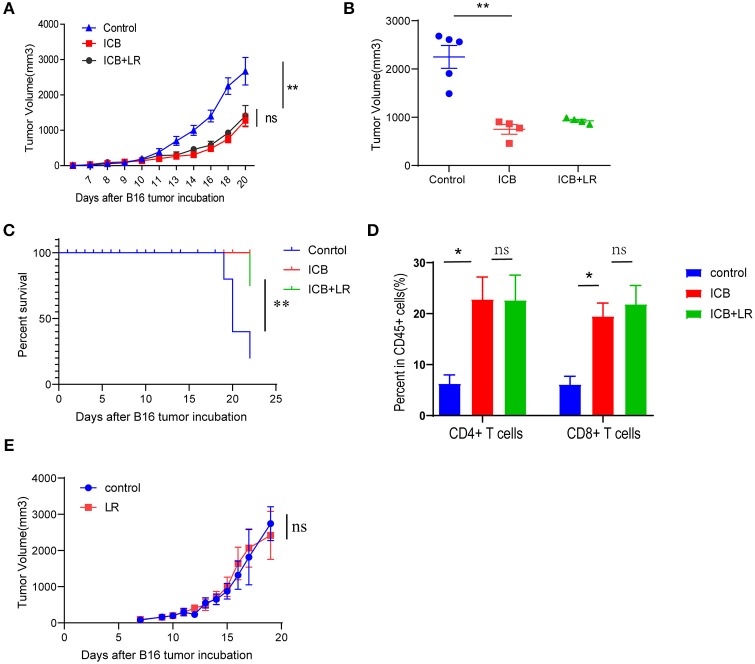
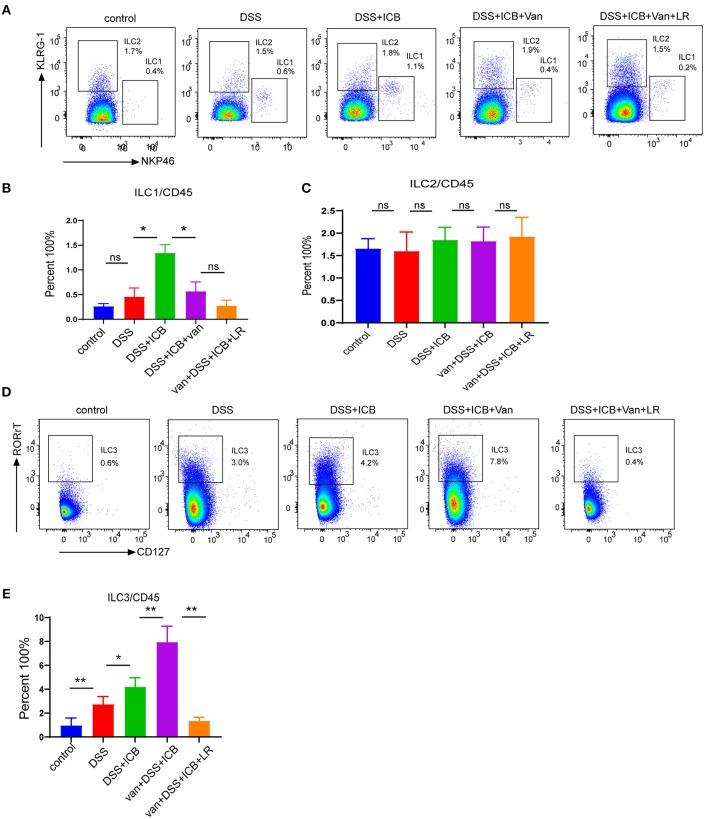
Immune checkpoint blockade (ICB) immunotherapy increases antitumor immunity by blocking cytotoxic-T-lymphocyte-associated protein 4 (CTLA-4) or programmed cell death protein 1 (PD-1)/programmed death-ligand 1 (PD-L1) and displays robust clinical responses in various cancers. However, ICB immunotherapy also triggers severe inflammatory side effects, known as immune-related adverse effects (irAEs). One of the most common toxicities is immune checkpoint blockade-associated colitis (ICB associated colitis). The exact mechanism of ICB associated colitis remains to be explored. Here, we combined ICB (anti-CTLA-4 and anti-PD-1) treatment with a standard colitis model, in which a more severe form of colitis is induced in mice, to recapitulate the clinical observations in patients receiving combined ipilimumab (anti-CTLA-4) and nivolumab (anti-PD-1) therapy, during which colitis is the most frequent complication encountered. We found that the composition of the gut microbiota changed in ICB associated colitis. Principal component analysis of the gut microbiome showed an obvious reduction in the abundance of Lactobacillus in severe ICB associated colitis. Lactobacillus depletion completely by vancomycin augmented the immunopathology of ICB. Furthermore, we found that the ICB toxicity could be totally eliminated via the administration of a widely available probiotic Lactobacillus reuteri (L.reuteri). Oral administration of L. reuteri therapeutically inhibited the development and progression of colitis, thus ameliorating the loss of body weight and inflammatory status induced by ICB treatment. Mechanistically, the protective effect of L. reuteri was associated with a decrease in the distribution of group 3 innate lymphocytes (ILC3s) induced by ICB associated colitis. In conclusion, our study highlights the immunomodulatory mechanism of the gut microbiota and suggests that manipulating the gut microbiota by administrating L. reuteri can mitigate the autoimmunity induced by ICB, thus allowing ICB immunotherapy to stimulate the desired immune response without an apparent immunopathology.

Keywords: colitis; gut microbiome; immune checkpoint blockade; inflammation; innate lymphoid cells.


Figures

Figure 1
Figure 1
Increased susceptibility to DSS-induced colitis in ICB-receiving mice. (A) Weight loss curves of mice treated with 3% DSS and receiving the ICB (ICB: αCTLA-4 mAb and αPD-1 mAb) or IgG isotype control (Iso Ctrl). Mice were given 3% DSS for 7 d. n = 10 per group. (B) Survival curves (in percent) of the mice receiving the IgG isotype control (Iso Ctrl) or the ICB treatment along with 3% DSS administration. Survival was monitored for 14 d, n = 10 per group. (C) Representative colon histological results from mice treated with an injection of the isotype control (left) or ICB treatment (right) along with 3% DSS administration. Colon samples were collected on day 15 and stained with H&E (Scale bar, 200 μm). (D) The colon histological scores of mice receiving the IgG isotype control (Iso Ctrl) or the ICB treatment along with 3% DSS administration, n = 5 per group. (E) The KC, TNF-α, IL-6, and IFN-γ concentrations in the sera of mice treated with isotype control (Iso Ctrl) or the ICB treatment along with 3% DSS administration, n = 5 per group. Means with SEM analyzed by unpaired Student's t-test. *P < 0.05, **P < 0.01, and ***P < 0.001.
Figure 2
Figure 2
Microbiome analysis of the intestinal bacteria in DSS-treated mice receiving ICB treatment as assessed via 16S rRNA gene amplicon sequencing. (A) Microbial community bar plot sorted by genus for the mice receiving the IgG isotype control (Iso Ctrl) or the ICB treatment along with 3% DSS administration. Relative abundances of the predominant bacteria (>1% in any sample) in the feces of mice receiving the IgG isotype control (Iso Ctrl) or the ICB treatment along with 3% DSS administration. n = 5 per group. (B) Pie chart showing the relative abundances of the predominant bacteria (>1% in any sample) in the feces of mice treated with an injection of isotype control (Left) or ICB treatment (Right) along with 3% DSS administration. n = 5 per group. (C) different abundance analysis of the top 3 enriched predominant bacteria in mice treated with an injection of isotype control (Left) or ICB treatment (Right) along with 3% DSS administration. (D) Relative abundance of Lactobacilli in the feces of mice receiving the IgG isotype control (Iso Ctrl) or the ICB treatment along with 3% DSS administration. n = 5 per group. *P < 0.05 and **P < 0.01.
Figure 3
Figure 3
Vancomycin augments the immunopathology of ICB in DSS-treated mice. (A) Weight loss curves of water- or vancomycin-treated mice receiving the ICB (ICB: αCTLA-4 mAb and αPD-1 mAb) along with the administration of 3% DSS. Mice were given 3% DSS for 7 d. n = 15 per group. (B), Percent survival curves of water- (left) or vancomycin-treated mice (right) receiving the ICB treatment along with 3% DSS administration. Survival was monitored for 14 d, n = 15 per group. (C), Representative colon histology results from water- (left) or vancomycin-treated mice treated with an injection of isotype control or ICB treatment (right) along with 3% DSS administration. Colon samples were collected on day 10 and H&E stained (Scale bar, 50 μm). (D) The colon histological scores of water- or vancomycin-treated mice receiving the ICB treatment along with 3% DSS administration, n = 5 per group. (E) The concentrations of KC, TNF-a, IL-6, and IFN-γ in the sera of water- or vancomycin-treated mice with the indicated treatments. n = 5 per group. (F) Microbial community bar plot sorted by the genus of the mice receiving ICB treatment and 3% DSS administration with or without vancomycin. The relative abundances of the predominant bacteria (>1% in any sample) in the feces of mice receiving the ICB treatment along with 3% DSS administration. n = 5 per group. (G) Pie chart shows the relative abundances of the predominant bacteria (>1% in any sample) in the feces of mice treated with ICB treatment and 3% DSS administration with or without vancomycin. n = 5 per group. (H) Relative abundances of Lactobacilli in the feces of mice receiving ICB treatment and 3% DSS administration with or without vancomycin. n = 5 per group. (I) the comparison of the top 3 enriched predominant bacteria in mice treated with an injection of ICB and 3% DSS administration with or without vancomycin. n = 5 per group. Means with SEM analyzed by unpaired Student's t-test. *P < 0.05 and ***P < 0.001.
Figure 4
Figure 4
L. reuteri therapeutically abrogates ICB-associated intestinal inflammation in DSS-treated mice. (A) The relative abundance of L. reuteri was quantified with 16s RNA sequencing. This value was normalized to the total bacteria, n = 5 per group. ***P < 0.001. (B) Weight loss curves of ICB-injected mice with 3% DSS-induced colitis treated either with vancomycin + PBS, or vancomycin + L. reuteri, n = 15 per group. (C) Percent survival curves of in ICB-injected mice with 3% DSS-induced colitis treated as described in A. Survival was monitored for 14 d, n = 15 per group. (D) Representative colonic histology results from ICB-injected mice with 3% DSS-induced colitis with the indicated treatments. Colon samples were collected on day 10 and H&E stained (Scale bar, 200 μm) (E) Quantification of the colon histological scores of ICB-injected mice with 3% DSS-induced colitis treated as described in A, n = 5 per group. (F) Serum concentrations of KC, TNF-α, IL-6, and IFN-γ in the serum of in ICB-injected mice with 3% DSS-induced colitis with the indicated treatments, n = 5 per group. Means with SEM analyzed by unpaired Student's t-test. *P < 0.05, **P < 0.01, and ***P < 0.001.
Figure 5
Figure 5
Biological affection of L. reuteri during anticancer ICB treatment. (A) B16 tumor growth kinetics in mice treated with PBS or L. reuteri by oral gavage, followed by treatment with Ctrl or ICB. The αCTLA-4 and αPD-1 mAb were injected at 7, 10, 13, and 16 d post-tumor implantation, n = 5 per group. The data are reported as the means and the error bars represent the SEMs. (B) Tumor sizes of the B16 tumors on day 19 post implantation in mice treated with PBS or L. reuteri by oral gavage, followed by treatment with Ctrl or ICB. (C) Percent survival curves of B16 tumor-bearing mice treated with PBS or L. reuteri by oral gavage, followed by treatment with Ctrl or ICB. (D) Quantification of intratumoral CD4+ T cells and CD8+ T cells in B16 melanoma tumor by flow cytometry (18 days of post tumor implantation; n = 5 per group). (E) tumor growth kinetics in mice bearing B16 melanoma treated with PBS or L. reuteri by oral gavage, n = 5 per group. Means with SEM analyzed by unpaired Student's t-test. *P < 0.05 and **P < 0.01. n.s., not significant.
Figure 6
Figure 6
Immunological infiltrate of innate lymphoid cells in ICB-associated intestinal inflammation of DSS-treated mice with or without L. reuteri administration. (A) Representative color plots showing the flow cytometric analysis of the canonical ILC subtypes (ILC1s and ILC2s) isolated from the large intestinal lamina propria of mice receiving the IgG isotype control (Iso Ctrl), ICB, ICB+Van, and ICB+Van+ L. reuteri (LR) treatment along with 3% DSS administration. (B) Quantification of the intestine-infiltrated RORrtNKp46+ ILC1 populations in the total CD45+ immune cells from the indicated groups, n = 10 per group. (C) Quantification of the intestine-infiltrated RORrtKLRG-1+ ILC2 populations in the total innate lymphoid cells from the indicated groups, n = 10 per group. (D) Representative color plots showing the flow cytometric analysis of the canonical ILC subtype (ILC3s) isolated from the large intestinal lamina propria of mice receiving the indicated treatment. (E) Quantification of the intestine-infiltrated RORrt+ILC3s cell population in the total CD45+ immune cells from the indicated groups, n = 10 per group. Means with SEM analyzed by unpaired Student's t-test. *P < 0.05, **P < 0.01 and ***P < 0.001.

Similar articles

Cited by

References

    1. Khalil DN, Smith EL, Brentjens RJ, Wolchok JD. The future of cancer treatment: immunomodulation, CARs and combination immunotherapy. Nat Rev Clin Oncol. (2016) 13:273–90. 10.1038/nrclinonc.2016.25 - DOI - PMC - PubMed
    1. Postow MA, Chesney J, Pavlick AC, Robert C, Grossmann K, McDermott D, et al. . Nivolumab and ipilimumab versus ipilimumab in untreated melanoma. N Engl J Med. (2015) 372:2006–17. 10.1056/NEJMoa1414428 - DOI - PMC - PubMed
    1. Postow MA, Sidlow R, Hellmann MD. Immune-related adverse events associated with immune checkpoint blockade. N Engl J Med. (2018) 378:158–68. 10.1056/NEJMra1703481 - DOI - PubMed
    1. Hodi FS, O'Day SJ, McDermott DF, Weber RW, Sosman JA, Haanen JB, et al. . Improved survival with ipilimumab in patients with metastatic melanoma. N Engl J Med. (2010) 363:711–23. 10.1056/NEJMoa1003466 - DOI - PMC - PubMed
    1. Brahmer JR, Tykodi SS, Chow LQ, Hwu WJ, Topalian SL, Hwu P, et al. . Safety and activity of anti-PD-L1 antibody in patients with advanced cancer. N Engl J Med. (2012) 366:2455–65. 10.1056/NEJMoa1200694 - DOI - PMC - PubMed

Publication types

MeSH terms