

Retained NK Cell Phenotype and Functionality in Non-alcoholic Fatty Liver Disease
- PMID: 31214196
- PMCID: PMC6558016
- DOI: 10.3389/fimmu.2019.01255
Retained NK Cell Phenotype and Functionality in Non-alcoholic Fatty Liver Disease
Abstract
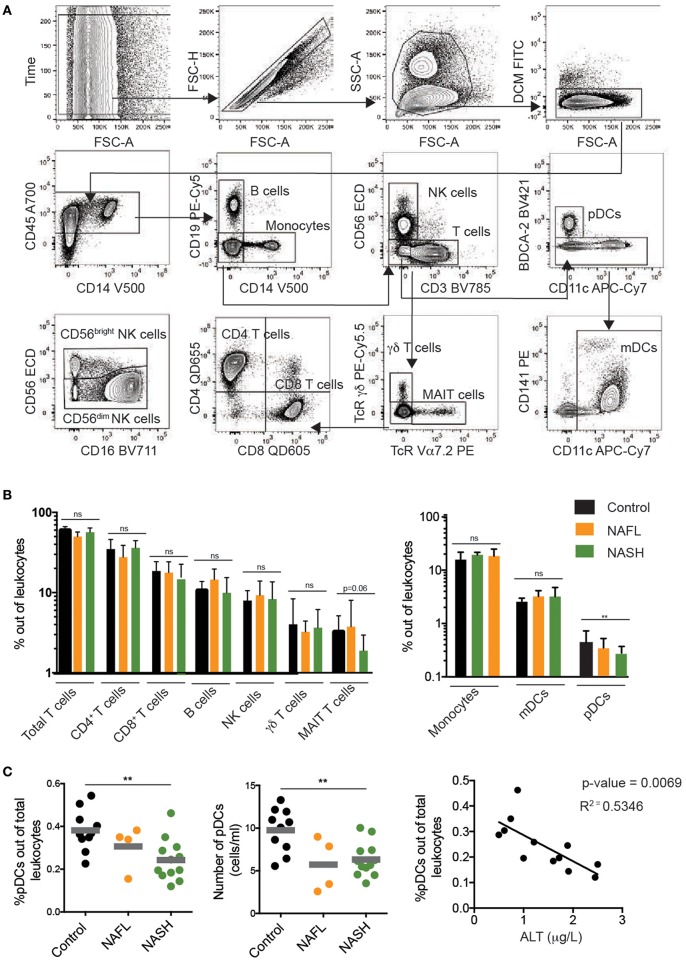
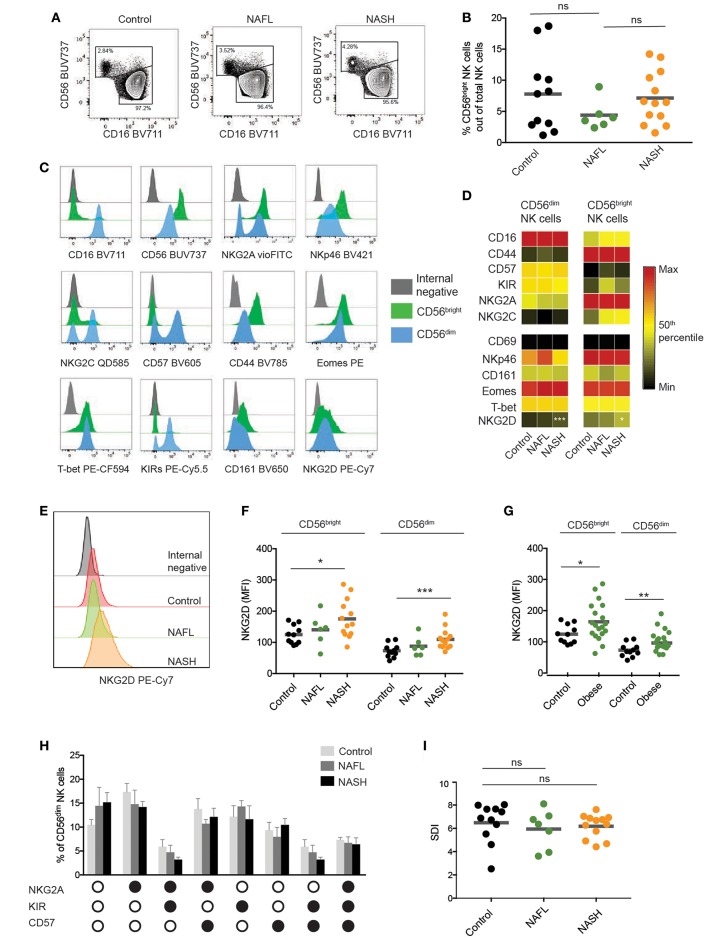
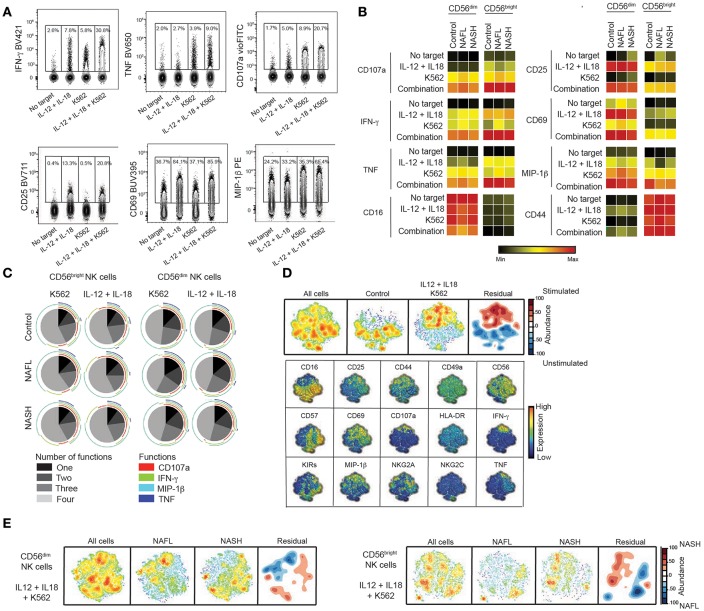
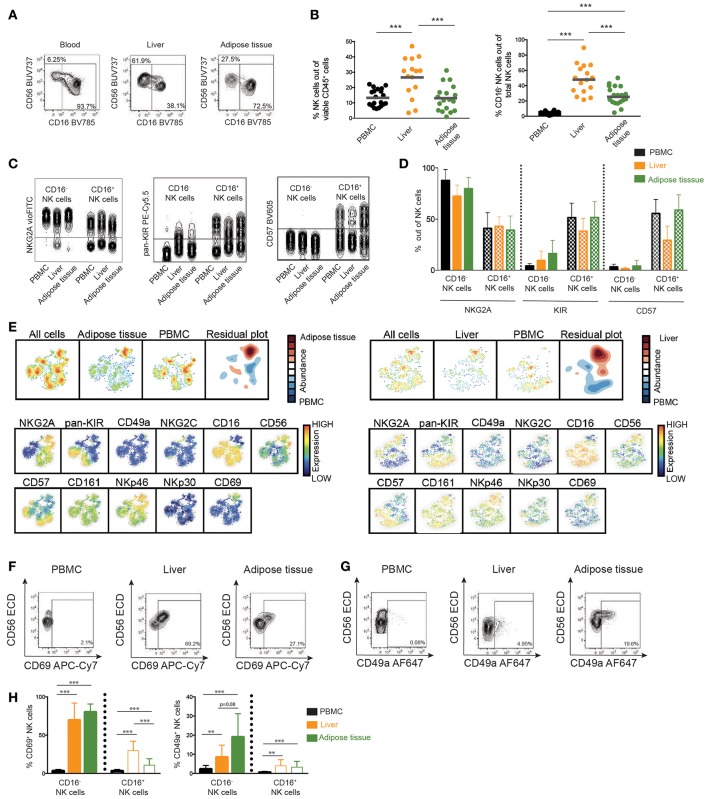
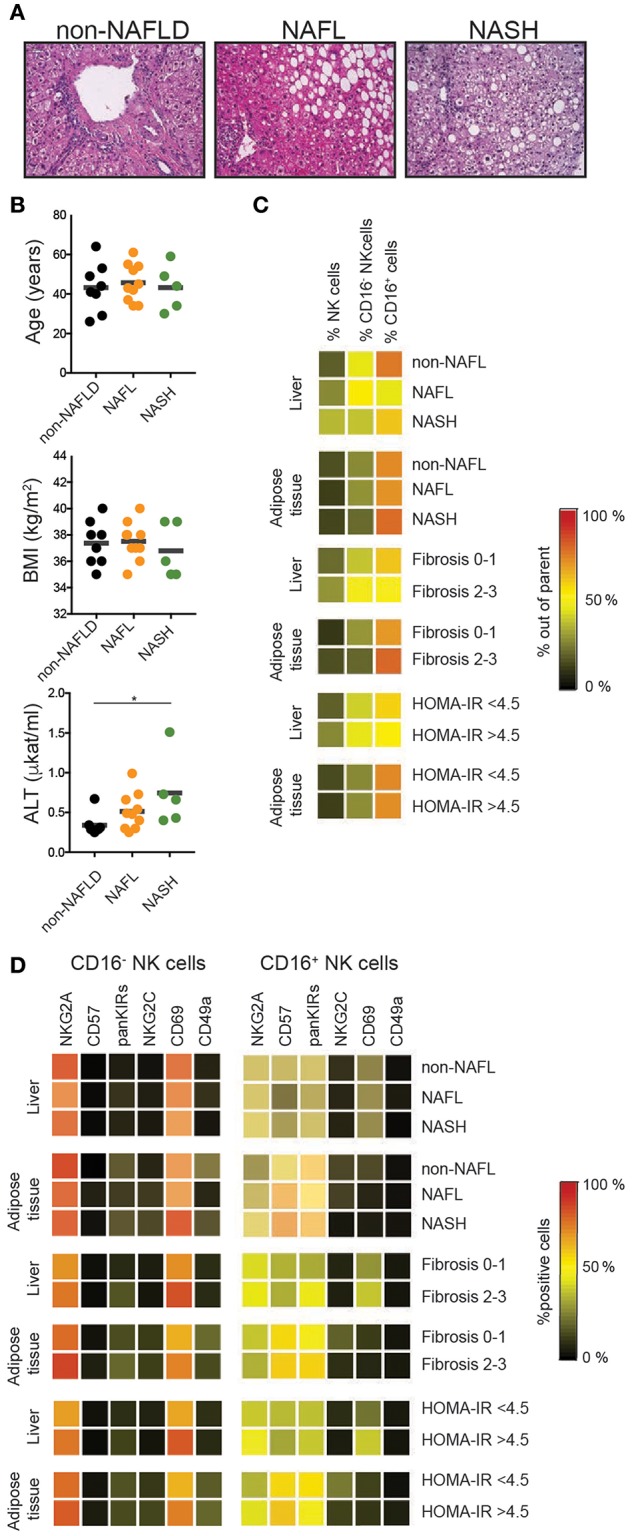
Non-alcoholic fatty liver disease (NAFLD), and the progressive stage non-alcoholic steatohepatitis (NASH), is the predominant cause of chronic liver disease globally. As part of the complex pathogenesis, natural killer (NK) cells have been implicated in the development of liver inflammation in experimental murine models of NASH. However, there is a lack of knowledge on how NK cells are affected in humans with this disease. Here, we explored the presence of disease-specific changes within circulating and tissue-resident NK cell populations, as well as within other major immune cell subsets, in patients with liver biopsy-confirmed NAFLD. Using 18-color-flow cytometry, substantial changes were observed in certain myeloid populations in patients as compared to controls. NK cell numbers, on the other hand, were not altered. Furthermore, only minor differences in expression of activating and inhibitory NK cell receptors were noted, with the exception of an increased expression of NKG2D on NK cells from patients with NASH. NK cell differentiation remained constant, and NK cells from these patients retain their ability to respond adequately upon stimulation. Instead, considerable alterations were observed between liver, adipose tissue, and peripheral blood NK cells, independently of disease status. Taken together, these results increase our understanding of the importance of the local microenvironment in shaping the NK cell compartment and stress the need for further studies exploring how NASH affects intrahepatic NK cells in humans.
Keywords: NAFLD; adipose tissue immunology; liver immunology; natural killer cells; obesity.
Figures
Similar articles
-
Natural Killer Cells and Type 1 Innate Lymphoid Cells Are New Actors in Non-alcoholic Fatty Liver Disease.Front Immunol. 2019 May 28;10:1192. doi: 10.3389/fimmu.2019.01192. eCollection 2019. Front Immunol. 2019. PMID: 31191550 Free PMC article. Review.
-
Characterization of the immune cell landscape of patients with NAFLD.PLoS One. 2020 Mar 13;15(3):e0230307. doi: 10.1371/journal.pone.0230307. eCollection 2020. PLoS One. 2020. PMID: 32168345 Free PMC article.
-
Increased Frequency of Dysfunctional Siglec-7-CD57+PD-1+ Natural Killer Cells in Patients With Non-alcoholic Fatty Liver Disease.Front Immunol. 2021 Feb 22;12:603133. doi: 10.3389/fimmu.2021.603133. eCollection 2021. Front Immunol. 2021. PMID: 33692781 Free PMC article. Clinical Trial.
-
Tissue-resident Eomes(hi) T-bet(lo) CD56(bright) NK cells with reduced proinflammatory potential are enriched in the adult human liver.Eur J Immunol. 2016 Sep;46(9):2111-20. doi: 10.1002/eji.201646559. Eur J Immunol. 2016. PMID: 27485474
-
Revisiting the Role of Natural Killer Cells in Non-Alcoholic Fatty Liver Disease.Front Immunol. 2021 Feb 18;12:640869. doi: 10.3389/fimmu.2021.640869. eCollection 2021. Front Immunol. 2021. PMID: 33679803 Free PMC article. Review.
Cited by
-
Apigenin Increases Natural Killer Cytotoxicity to Human Hepatocellular Carcinoma Expressing HIF-1α through High Interaction of CD95/CD95L.J Microbiol Biotechnol. 2022 Apr 28;32(4):397-404. doi: 10.4014/jmb.2201.01010. J Microbiol Biotechnol. 2022. PMID: 35283421 Free PMC article.
-
Adipose tissue aging is regulated by an altered immune system.Front Immunol. 2023 Feb 17;14:1125395. doi: 10.3389/fimmu.2023.1125395. eCollection 2023. Front Immunol. 2023. PMID: 36875140 Free PMC article. Review.
-
Diet and Gut Microbiota Interaction-Derived Metabolites and Intrahepatic Immune Response in NAFLD Development and Treatment.Biomedicines. 2021 Dec 13;9(12):1893. doi: 10.3390/biomedicines9121893. Biomedicines. 2021. PMID: 34944709 Free PMC article. Review.
-
Innate immunity and early liver inflammation.Front Immunol. 2023 May 2;14:1175147. doi: 10.3389/fimmu.2023.1175147. eCollection 2023. Front Immunol. 2023. PMID: 37205101 Free PMC article. Review.
-
The Important Roles of Natural Killer Cells in Liver Fibrosis.Biomedicines. 2023 May 8;11(5):1391. doi: 10.3390/biomedicines11051391. Biomedicines. 2023. PMID: 37239062 Free PMC article. Review.
References
Publication types
MeSH terms
Substances
LinkOut - more resources
Full Text Sources
Other Literature Sources
Medical
Research Materials