

Stomatal Development and Conductance of a Tropical Forage Legume Are Regulated by Elevated [CO2] Under Moderate Warming
- PMID: 31214207
- PMCID: PMC6554438
- DOI: 10.3389/fpls.2019.00609
Stomatal Development and Conductance of a Tropical Forage Legume Are Regulated by Elevated [CO2] Under Moderate Warming
Abstract
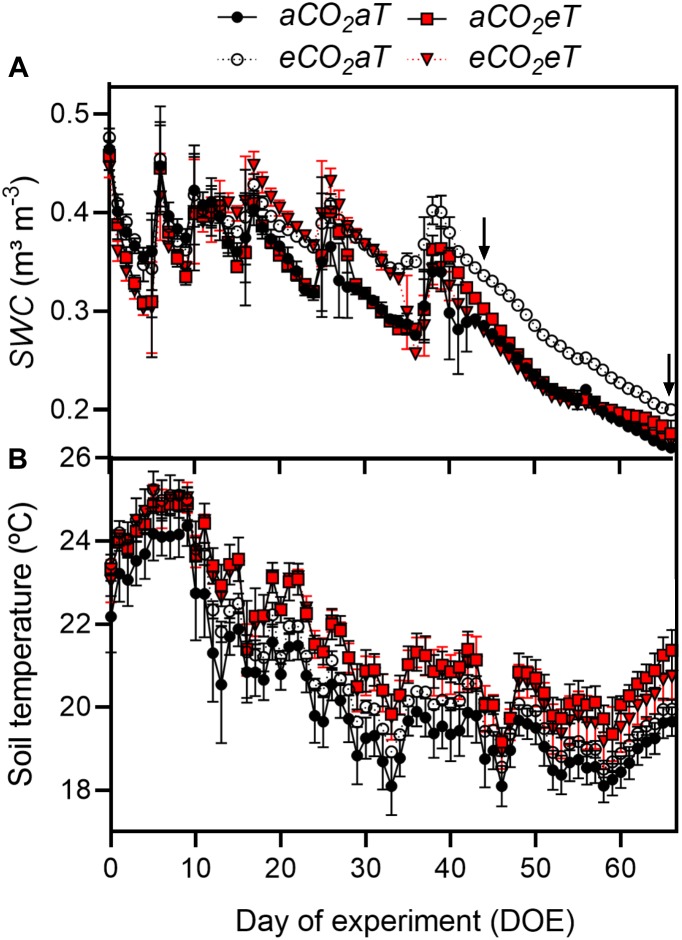
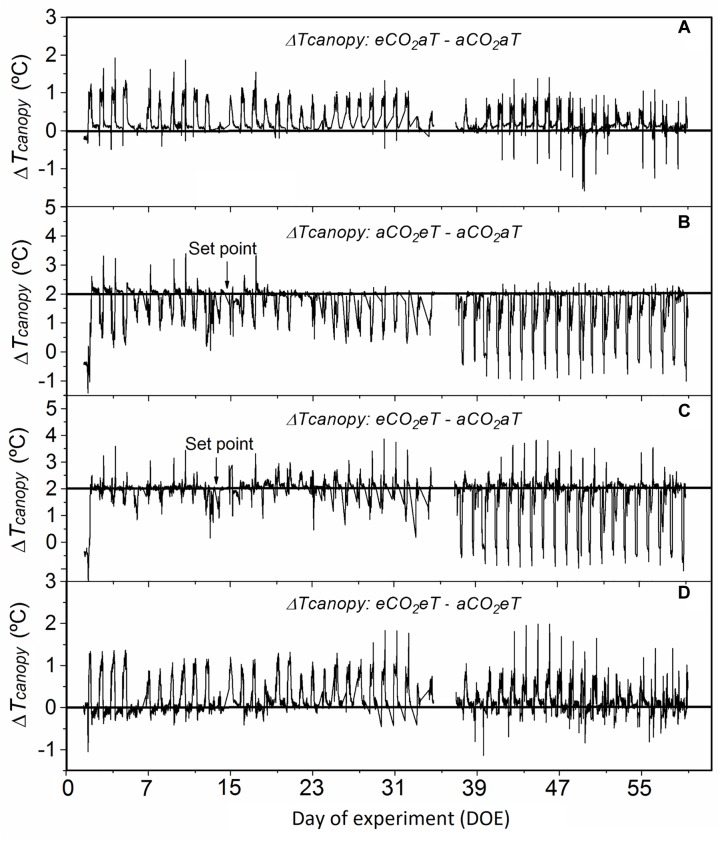
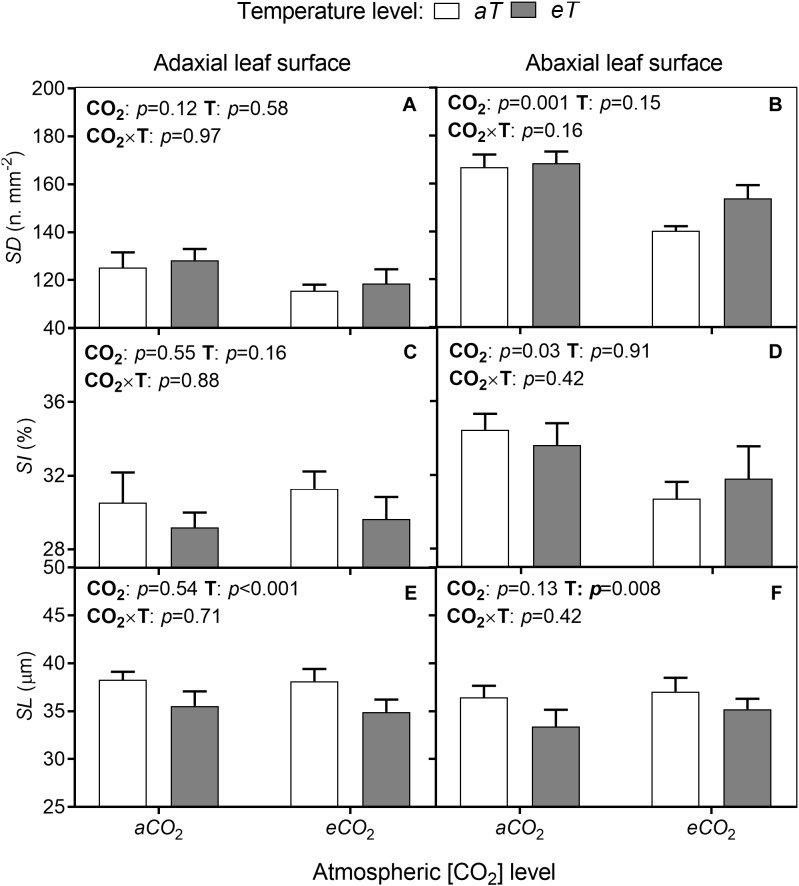
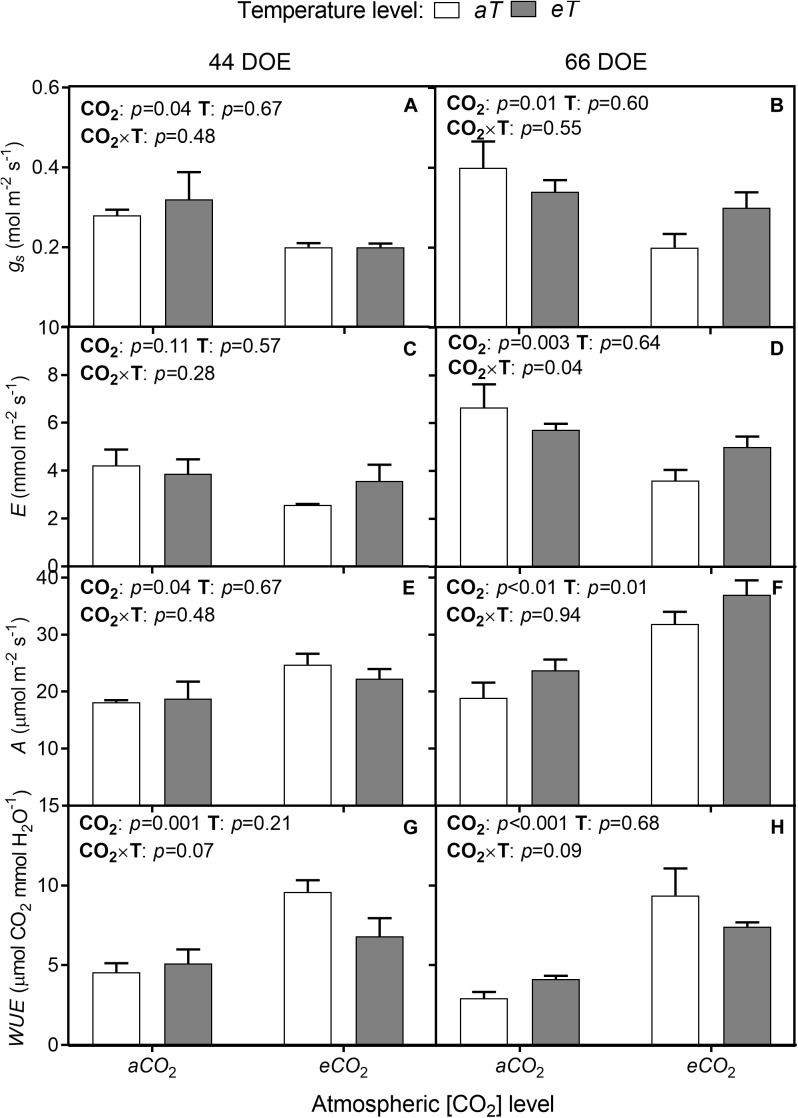
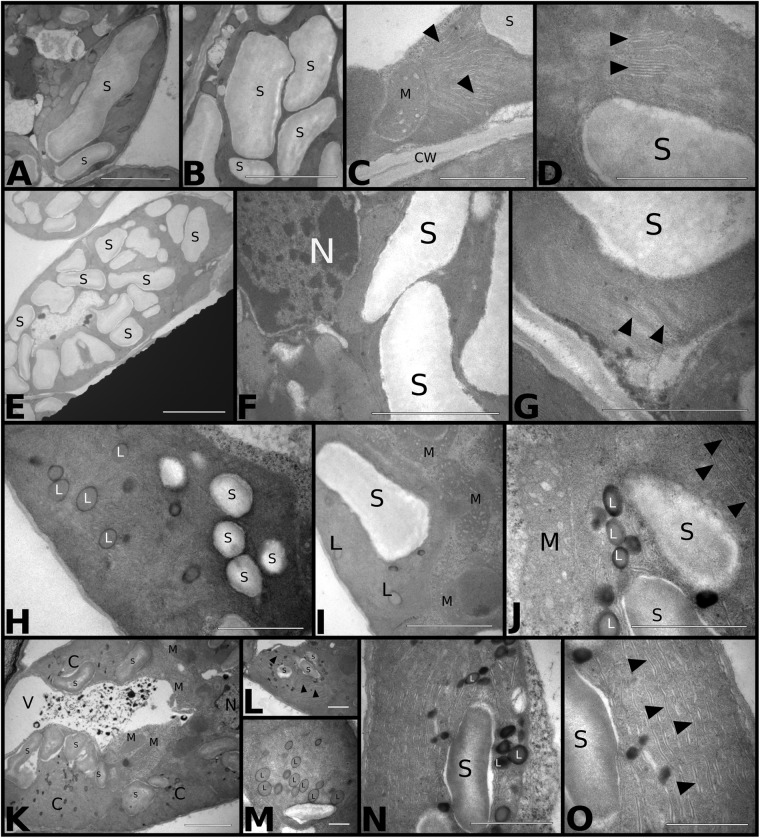
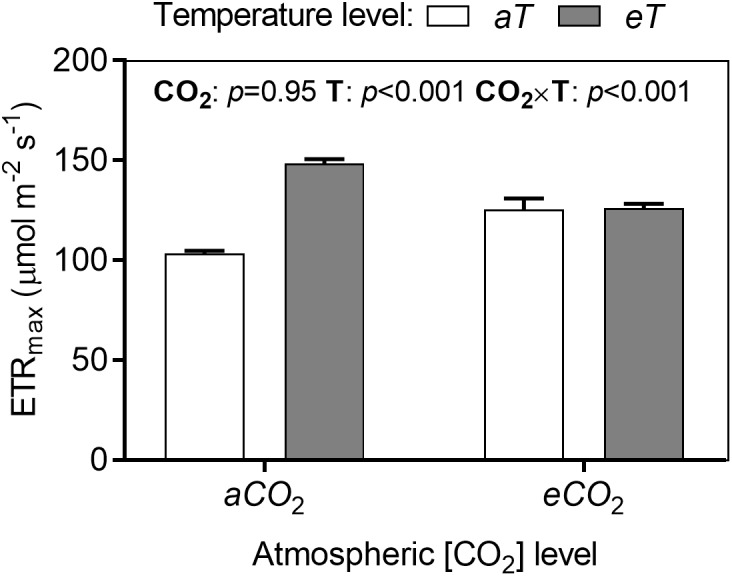
The opening and closing of stomata are controlled by the integration of environmental and endogenous signals. Here, we show the effects of combining elevated atmospheric carbon dioxide concentration (eCO 2; 600 μmol mol-1) and warming (+2°C) on stomatal properties and their consequence to plant function in a Stylosanthes capitata Vogel (C3) tropical pasture. The eCO 2 treatment alone reduced stomatal density, stomatal index, and stomatal conductance (gs ), resulting in reduced transpiration, increased leaf temperature, and leading to maintenance of soil moisture during the growing season. Increased CO2 concentration inside leaves stimulated photosynthesis, starch content levels, water use efficiency, and PSII photochemistry. Under warming, plants developed leaves with smaller stomata on both leaf surfaces; however, we did not see effects of warming on stomatal conductance, transpiration, or leaf water status. Warming alone enhanced PSII photochemistry and photosynthesis, and likely starch exports from chloroplasts. Under the combination of warming and eCO 2, leaf temperature was higher than that of leaves from the warming or eCO 2 treatments. Thus, warming counterbalanced the effects of CO2 on transpiration and soil water content but not on stomatal functioning, which was independent of temperature treatment. Under warming, and in combination with eCO 2, leaves also produced more carotenoids and a more efficient heat and fluorescence dissipation. Our combined results suggest that control on stomatal opening under eCO 2 was not changed by a warmer environment; however, their combination significantly improved whole-plant functioning.
Keywords: elevated CO2; gas exchange; global climate change; stomatal conductance regulation; tropical forage legume; warming.
Figures

Similar articles
-
How does leaf physiological acclimation impact forage production and quality of a warmed managed pasture of Stylosanthes capitata under different conditions of soil water availability?Sci Total Environ. 2021 Mar 10;759:143505. doi: 10.1016/j.scitotenv.2020.143505. Epub 2020 Nov 13. Sci Total Environ. 2021. PMID: 33223164
-
Increasing atmospheric CO2 and canopy temperature induces anatomical and physiological changes in leaves of the C4 forage species Panicum maximum.PLoS One. 2019 Feb 19;14(2):e0212506. doi: 10.1371/journal.pone.0212506. eCollection 2019. PLoS One. 2019. PMID: 30779815 Free PMC article.
-
Warming and water deficit impact leaf photosynthesis and decrease forage quality and digestibility of a C4 tropical grass.Physiol Plant. 2019 Feb;165(2):383-402. doi: 10.1111/ppl.12891. Physiol Plant. 2019. PMID: 30525220
-
Effect of elevated CO2 on the stomatal distribution and leaf physiology of Alnus glutinosa.New Phytol. 2000 Mar;145(3):511-521. doi: 10.1046/j.1469-8137.2000.00589.x. New Phytol. 2000. PMID: 33862906 Review.
-
Drought stress and carbon assimilation in a warming climate: Reversible and irreversible impacts.J Plant Physiol. 2016 Sep 20;203:84-94. doi: 10.1016/j.jplph.2016.04.002. Epub 2016 Apr 7. J Plant Physiol. 2016. PMID: 27083537 Review.
Cited by
-
Challenges of Biomass Utilization for Bioenergy in a Climate Change Scenario.Biology (Basel). 2021 Dec 6;10(12):1277. doi: 10.3390/biology10121277. Biology (Basel). 2021. PMID: 34943192 Free PMC article. Review.
-
Arbuscular Mycorrhization Enhances Nitrogen, Phosphorus and Potassium Accumulation in Vicia faba by Modulating Soil Nutrient Balance under Elevated CO2.J Fungi (Basel). 2021 May 5;7(5):361. doi: 10.3390/jof7050361. J Fungi (Basel). 2021. PMID: 34063150 Free PMC article.
-
Trading water for carbon in the future: Effects of elevated CO2 and warming on leaf hydraulic traits in a semiarid grassland.Glob Chang Biol. 2022 Oct;28(20):5991-6001. doi: 10.1111/gcb.16314. Epub 2022 Aug 4. Glob Chang Biol. 2022. PMID: 35751572 Free PMC article.
-
Climate change and land-use change impacts on future availability of forage grass species for Ethiopian dairy systems.Sci Rep. 2022 Nov 28;12(1):20512. doi: 10.1038/s41598-022-23461-w. Sci Rep. 2022. PMID: 36443389 Free PMC article.
-
Effects on Photosynthetic Response and Biomass Productivity of Acacia longifolia ssp. longifolia Under Elevated CO2 and Water-Limited Regimes.Front Plant Sci. 2022 Mar 31;13:817730. doi: 10.3389/fpls.2022.817730. eCollection 2022. Front Plant Sci. 2022. PMID: 35432396 Free PMC article.
References
-
- Asner G. P., Elmore A. J., Olander L. P., Martin R. E., Harris A. T. (2004). Grazing systems, ecosystem responses, and global changes. Annu. Rev. Environ. Res. 29 261–299. 10.1146/annurev.energy.29.062403.102142 - DOI
LinkOut - more resources
Full Text Sources
Miscellaneous