

Peach Fruit Development: A Comparative Proteomic Study Between Endocarp and Mesocarp at Very Early Stages Underpins the Main Differential Biochemical Processes Between These Tissues
- PMID: 31214229
- PMCID: PMC6558166
- DOI: 10.3389/fpls.2019.00715
Peach Fruit Development: A Comparative Proteomic Study Between Endocarp and Mesocarp at Very Early Stages Underpins the Main Differential Biochemical Processes Between These Tissues
Abstract
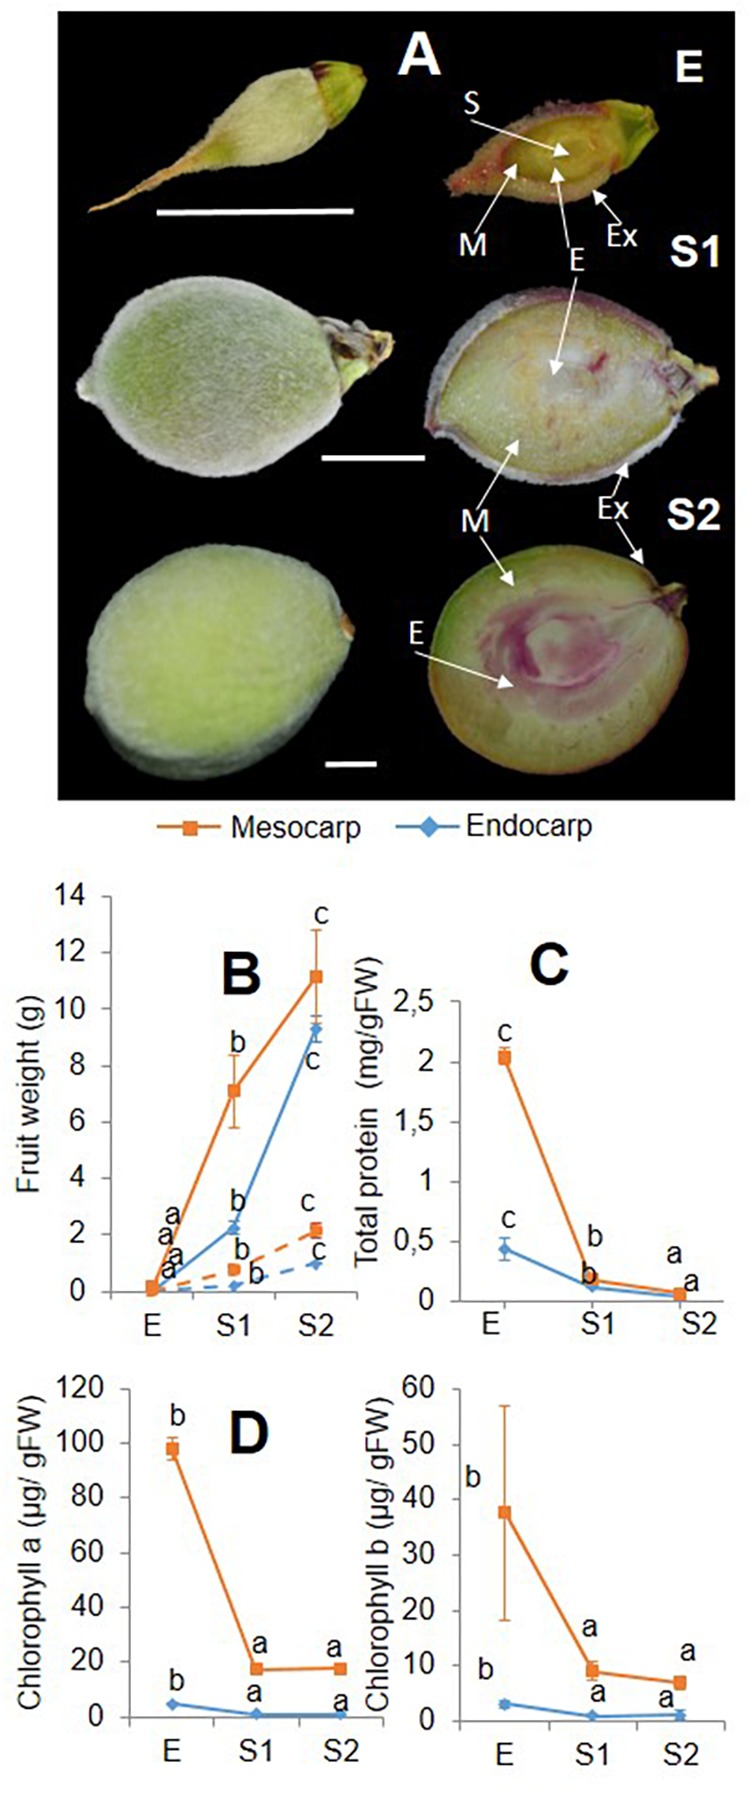
Peach (Prunus persica) is an important economically temperate fruit. The development follows double sigmoid curve with four phases (S1-S4). We centered our work in the early development. In addition to S1, we studied the very early stage (E) characterized by the lag zone of the exponential growing phase S1, and the second stage (S2) when the pit starts hardening. "Dixiland" peach fruit were collected at 9 (E), 29 (S1), and 53 (S2) days after flowering (DAF) and endocarp and mesocarp were separated. There was a pronounced decrease in total protein content along development in both tissues. Quantitative proteomic allowed the identification of changes in protein profiles across development and revealed the main biochemical pathways sustaining tissue differentiation. Protein metabolism was the category most represented among differentially proteins in all tissues and stages. The decrease in protein synthesis machinery observed during development would be responsible of the protein fall, rather than a proteolytic process; and reduced protein synthesis during early development would reroute cell resources to lignin biosynthesis. These changes were accompanied by net decrease in total amino acids in E1-S1 and increase in S1-S2 transitions. Amino acid profiling, showed Asn parallels this trend. Concerted changes in Asn and in enzymes involved in its metabolism reveal that increased synthesis and decreased catabolism of Asn may conduct to an Asn increase during very early development and that the β-Cyano-Alanine synthase/β-Cyano-Alanine hydratase could be the pathway for Asn synthesis in "Dixiland" peach fruit. Additionally, photosynthetic machinery decays during early development in mesocarp and endocarp. Proteins related to photosynthesis are found to a higher extent in mesocarp than in endocarp. We conclude mesocarpic photosynthesis is possible to occur early on the development, first providing both carbon and reductive power and latter only reductive power. Together with proteomic, histological tests and anatomical analysis help to provide information about changes and differences in cells and cell-walls in both tissues. Collectively, this work represents the first approach in building protein databases during peach fruit development focusing on endocarp and mesocarp tissues and provides novel insights into the biology of peach fruit development preceding pit hardening.
Keywords: Prunus persica; asparagine; endocarp; fruit development; lignification; mesocarp; β–cyanoalanine hydratase; β–cyanoalanine synthase.
Figures


Similar articles
-
Proteomic analysis of peach endocarp and mesocarp during early fruit development.Physiol Plant. 2011 Aug;142(4):390-406. doi: 10.1111/j.1399-3054.2011.01479.x. Epub 2011 Jun 8. Physiol Plant. 2011. PMID: 21496031
-
Stone formation in peach fruit exhibits spatial coordination of the lignin and flavonoid pathways and similarity to Arabidopsis dehiscence.BMC Biol. 2010 Feb 9;8:13. doi: 10.1186/1741-7007-8-13. BMC Biol. 2010. PMID: 20144217 Free PMC article.
-
Peach fruit ripening: A proteomic comparative analysis of the mesocarp of two cultivars with different flesh firmness at two ripening stages.Phytochemistry. 2011 Jul;72(10):1251-62. doi: 10.1016/j.phytochem.2011.01.012. Epub 2011 Feb 9. Phytochemistry. 2011. PMID: 21315381
-
Characterization of peroxidases in lignifying peach fruit endocarp.Plant Physiol. 1991 Jan;95(1):269-73. doi: 10.1104/pp.95.1.269. Plant Physiol. 1991. PMID: 16667963 Free PMC article.
-
Evolution of the fruit endocarp: molecular mechanisms underlying adaptations in seed protection and dispersal strategies.Front Plant Sci. 2014 Jun 25;5:284. doi: 10.3389/fpls.2014.00284. eCollection 2014. Front Plant Sci. 2014. PMID: 25009543 Free PMC article. Review.
Cited by
-
Regulation of Fruit Growth in a Peach Slow Ripening Phenotype.Genes (Basel). 2021 Mar 26;12(4):482. doi: 10.3390/genes12040482. Genes (Basel). 2021. PMID: 33810423 Free PMC article.
-
Identifying sources of metabolomic diversity and reconfiguration in peach fruit: taking notes for quality fruit improvement.FEBS Open Bio. 2021 Dec;11(12):3211-3217. doi: 10.1002/2211-5463.13233. Epub 2021 Jul 20. FEBS Open Bio. 2021. PMID: 34176215 Free PMC article. Review.
-
Almond diversity and homozygosity define structure, kinship, inbreeding, and linkage disequilibrium in cultivated germplasm, and reveal genomic associations with nut and seed weight.Hortic Res. 2021 Jan 10;8(1):15. doi: 10.1038/s41438-020-00447-1. Hortic Res. 2021. PMID: 33423037 Free PMC article.
-
Changes in Homogalacturonan Metabolism in Banana Peel during Fruit Development and Ripening.Int J Mol Sci. 2021 Dec 27;23(1):243. doi: 10.3390/ijms23010243. Int J Mol Sci. 2021. PMID: 35008668 Free PMC article.
-
Stone Fruits: Growth and Nitrogen and Organic Acid Metabolism in the Fruits and Seeds-A Review.Front Plant Sci. 2020 Sep 25;11:572601. doi: 10.3389/fpls.2020.572601. eCollection 2020. Front Plant Sci. 2020. PMID: 33101339 Free PMC article. Review.
References
-
- Alba C. M., de Forchetti S. M., Tigier H. A. (1995). Biochemical and histochemical lignin determination and related isoperoxidases in peach fruit endocarp. Biocell 19 35–41.
-
- Alba C. M., de Forchetti S. M., Tigier H. A. (2000). Phenoloxidase of peach (Prunus persica) endocarp: its relationship with peroxidases and lignification. Physiol. Plant 109 382–387. 10.1034/j.1399-3054.2000.100403.x - DOI
-
- Blumenthal S., Hendrickson H., Abrol Y., Conn E. (1968). Cyanide metabolism in higher plants: III. The biosynthesis of β-cyanoalanine. J. Biol. Chem. 243 5302–5307. - PubMed
LinkOut - more resources
Full Text Sources
Miscellaneous