. 2019 May 12:2019:1523140.
doi: 10.1155/2019/1523140. eCollection 2019.

5-Azacytidine and Resveratrol Enhance Chondrogenic Differentiation of Metabolic Syndrome-Derived Mesenchymal Stem Cells by Modulating Autophagy

Affiliations

5-Azacytidine and Resveratrol Enhance Chondrogenic Differentiation of Metabolic Syndrome-Derived Mesenchymal Stem Cells by Modulating Autophagy

K Marycz et al. Oxid Med Cell Longev. .

Abstract

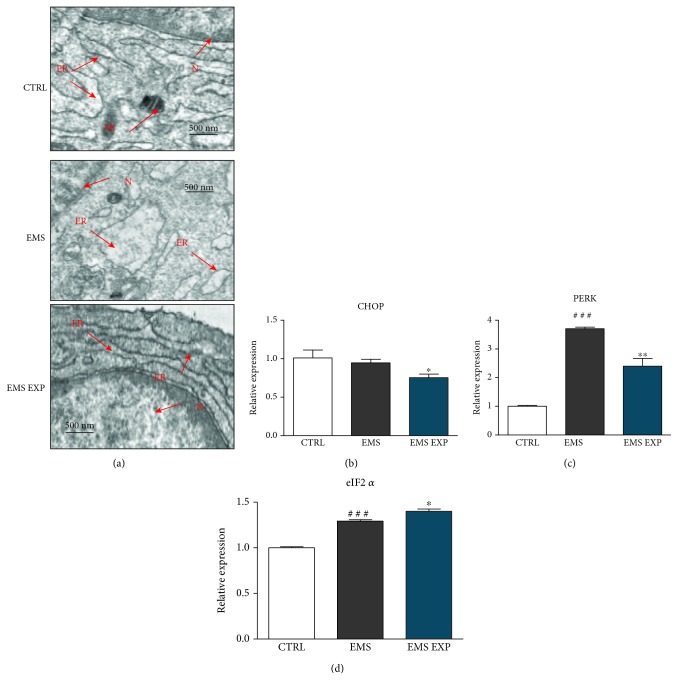
Recently, metabolic syndrome (MS) has gained attention in human and animal metabolic medicine. Insulin resistance, inflammation, hyperleptinemia, and hyperinsulinemia are critical to its definition. MS is a complex cluster of metabolic risk factors that together exert a wide range of effects on multiple organs, tissues, and cells in the body. Adipose stem cells (ASCs) are multipotent stem cell population residing within the adipose tissue that is inflamed during MS. Studies have indicated that these cells lose their stemness and multipotency during MS, which strongly reduces their therapeutic potential. They suffer from oxidative stress, apoptosis, and mitochondrial deterioration. Thus, the aim of this study was to rejuvenate these cells in vitro in order to improve their chondrogenic differentiation effectiveness. Pharmacotherapy of ASCs was based on resveratrol and 5-azacytidine pretreatment. We evaluated whether those substances are able to reverse aged phenotype of metabolic syndrome-derived ASCs and improve their chondrogenic differentiation at its early stage using immunofluorescence, transmission and scanning electron microscopy, real-time PCR, and flow cytometry. Obtained results indicated that 5-azacytidine and resveratrol modulated mitochondrial dynamics, autophagy, and ER stress, leading to the enhancement of chondrogenesis in metabolically impaired ASCs. Therefore, pretreatment of these cells with 5-azacytidine and resveratrol may become a necessary intervention before clinical application of these cells in order to strengthen their multipotency and therapeutic potential.


Figures

Figure 1
Figure 1
Immunophenotyping and multipotency assay. Expression of CD44, CD90, and CD 45 was investigated with flow cytometry (a). Effectiveness of differentiation was established by specific staining (b). Safranin stained proteoglycans formed during chondrogenic differentiation while Alizarin Red stained extracellular mineralized matrix formed in the course of osteogenic differentiation. Intracellular lipid droplets formed during adipogenesis were stained with Oil Red dye. Scale bar: 500 μM.
Figure 2
Figure 2
Effectiveness of chondrogenic differentiation. Prior to experiments, cells were pretreated with AZA/RES for 24 hours, then the experimental medium was replaced by osteogenic differentiation medium. Cells were cultured in that medium for five days and after were subjected to further analysis. In order to investigate proliferative activity of cells, BrdU assay was performed (a). Expression of chondrogenesis-related genes, including vimentin (b), decorin (c), COMP (d), and SOX-9 (e) was analyzed by RT-PCR. Cells in culture were visualized using light microscope, safranin staining, SEM, and confocal microscope (F-actin) (f). Scale bars: brightfield: 250 μM, confocal 500 μM. Results expressed as mean ± S.D. Statistical significance indicated as an asterisk () when comparing the result to ASCEMS and as a number sign (#) when comparing to ASCCTRL. # and p < 0.05; ## and ∗∗p < 0.01.
Figure 3
Figure 3
Evaluation of apoptosis. Prior to experiments, cells were pretreated with AZA/RES for 24 hours, then the experimental medium was replaced by osteogenic differentiation medium. Cells were cultured in that medium for five days and after were subjected to further analysis. In order to evaluate apoptosis in cells, expression of p53 (a), p21 (b), caspase-3 (c), Bcl-2 (d), and BAX (e) was analyzed by RT-PCR. Furthermore, Bcl-2/BAX ratio was calculated using relative expression values (f). Results expressed as mean ± S.D. Statistical significance indicated as an asterisk () when comparing the result to ASCEMS and as a number sign (#) when comparing to ASCCTRL. p < 0.05; ##p < 0.01; ###p < 0.001.
Figure 4
Figure 4
Investigation of oxidative stress factors. Prior to experiments, cells were pretreated with AZA/RES for 24 hours, then the experimental medium was replaced by osteogenic differentiation medium. Cells were cultured in that medium for five days and after were subjected to further analysis. MMP in cells was established by flow cytometry using JC-1 assay (a, b). AZA/RES treatment improved MMP in ASCEMS. Furthermore, extracellular levels of SOD (c), ROS (d), and NO (e) were investigated using commercially available assays based on spectrophotometric measurements. Increased values of SOD, ROS, and NO were noted in the experimental group. Results expressed as mean ± S.D. Statistical significance indicated as an asterisk () when comparing the result to ASCEMS and as a number sign (#) when comparing to ASCCTRL. p < 0.05; ## and ∗∗p < 0.01; ### and ∗∗∗p < 0.001.
Figure 5
Figure 5
Assessment of ER stress during differentiation. Prior to experiments, cells were pretreated with AZA/RES for 24 hours, then the experimental medium was replaced by osteogenic differentiation medium. Cells were cultured in that medium for five days and after were subjected to further analysis. ER structure in cells was visualized by TEM (a). ASCEMS were characterized by swallowed ER lumen, while in the experimental group, ER was properly developed. Expression of ER stress-related genes CHOP (b) and PERK (c) was diminished in cells pretreated with AZA/RES. Interestingly, expression of eIF2α (d) was enhanced in ASCEMS and EMSEXP. Abbreviations: ER: endoplasmic reticulum, N: nucleus, Mt: mitochondrion. Results expressed as mean ± S.D. Statistical significance indicated as an asterisk () when comparing the result to ASCEMS and as a number sign (#) when comparing to ASCCTRL. p < 0.05; ###p < 0.001.
Figure 6
Figure 6
Investigation of autophagy during early chondrogenesis. Prior to experiments, cells were pretreated with AZA/RES for 24 hours, then the experimental medium was replaced by osteogenic differentiation medium. Cells were cultured in that medium for five days and after were subjected to further analysis. Nuclei of cells were stained with DAPI. Mitochondria were stained with MitoRed dye while LAMP-2 was visualized using immunofluorescence. Mitochondrial net and LAMP-2 were visualized in cells using confocal microscopy (a). Expression of genes related to autophagy was investigated with RT-PCR. Expression of Beclin-3 (b) and LC3 (c) was diminished in EMS EXP; however, LAMP-2 (d) and p62 (e) mRNA levels were upregulated in that group. Similarly, mTOR expression was diminished (f). Results expressed as mean ± S.D. Statistical significance indicated as an asterisk () when comparing the result to ASCEMS and as a number sign (#) when comparing to ASCCTRL. p < 0.05; ### and ∗∗∗p < 0.001.
Figure 7
Figure 7
Evaluation of mitochondrial net types. Prior to experiments, cells were pretreated with AZA/RES for 24 hours, then the experimental medium was replaced by osteogenic differentiation medium. Cells were cultured in that medium for five days and after were subjected to further analysis. Mitochondrial net visualization was performed in the Mitochondrial Network Analysis (MiNA) toolset using the photographs from MitoRed staining (a). Obtained images were further quantified in the same software. The mean number of both individuals (b) and networks (c) was substantially greater in EMS than in EMSEXP. The number of mean branches per network was significantly increased in EMXEXP (d). The ratio of rod to branch was diminished in EMS cells; however, after treatment with AZA/RES, increased value of that parameter was noted (e). Results expressed as mean ± S.D. Statistical significance indicated as an asterisk () when comparing the result to ASCEMS and as a number sign (#) when comparing to ASCCTRL. # and p < 0.05; ∗∗p < 0.01; ### and ∗∗∗p < 0.001.
Figure 8
Figure 8
Evaluation of mitochondrial dynamics during chondrogenic differentiation. Prior to experiments, cells were pretreated with AZA/RES for 24 hours, then the experimental medium was replaced by osteogenic differentiation medium. Cells were cultured in that medium for five days and after were subjected to further analysis. Mitochondrial morphology was visualized using TEM (a). Mitochondria from ASCEMS were characterized by disarrayed cristae and vacuole formation. Furthermore, expression of FIS (b) and MFN (c) was evaluated using RT-PCR. Amount of MFF and MFN protein cell lysates was established with western blot (d). Abbreviations: Mt: mitochondria, ER: endoplasmic reticulum, V: vacuole. Results expressed as mean ± S.D. Statistical significance indicated as an asterisk () when comparing the result to ASCEMS and as a number sign (#) when comparing to ASCCTRL. p < 0.05; ### and ∗∗∗p < 0.001.
Figure 9
Figure 9
Evaluation of mitophagy during chondrogenic differentiation. Prior to experiments, cells were pretreated with AZA/RES for 24 hours, then the experimental medium was replaced by osteogenic differentiation medium. Cells were cultured in that medium for five days and after were subjected to further analysis. Using immunofluorescence, localization of PINK and PARKIN in chondrogenic nodules was visualized with confocal microscope (a). Nuclei of cells were stained with DAPI (a). PINK and PARKIN fluorescence was diminished in EMS cells as well as size of nodules. Furthermore, formation of mitophagosomes and lysosomes was established with TEM (b). Mitochondria in the EMS cells were packed into mitophagosomes while mitochondria from the EMS EXP groups did not display morphology abnormalities. Interestingly, mitochondria in the CTRL group frequently fused with lysosomes. Expression of PINK (c) and PARKIN (d) was investigated with RT-PCR. Abbreviations: LYS: lysosome, Mt: mitochondrion, MP: mitophagosome, ER: endoplasmic reticulum. Results expressed as mean ± S.D. Statistical significance indicated as an asterisk () when comparing the result to ASCEMS and as a number sign (#) when comparing to ASCCTRL. ##p < 0.01, ### and ∗∗∗p < 0.001.
Figure 10
Figure 10
Epigenetic alternations during chondrogenesis in control and experimental conditions. Prior to experiments, cells were pretreated with AZA/RES for 24 hours, then the experimental medium was replaced by osteogenic differentiation medium. Cells were cultured in that medium for five days and after were subjected to further analysis. Epigenetic alternations in cells were investigated with flow cytometry. Representative graphs show results of 5-mC and H3 accumulation in cells (a). Obtained results revealed decreased levels of 5-mC in EMS EXP (b). Increased H3 amount was noted in the EMS group (c). Expression of TET-2 (d) and TET-3 (e) was analyzed with RT-PCR. Results expressed as mean ± S.D. Statistical significance indicated as an asterisk () when comparing the result to ASCEMS and as a number sign (#) when comparing to ASCCTRL. #p < 0.05, ∗∗∗p < 0.001.
Figure 11
Figure 11
Evaluation of anti-inflammatory properties of prechondroblastic cells. The effect of AZA/RES on the activation status of RAW 264.7 macrophages. RAW 264.7 were seeded at a density of 1 × 10⁶ cells/mL, and after 18 hours, not-adherent cells were removed. Next, LPS was added to the culture media at a concentration of 1 μg/mL, and the experiment was continued for another 24 h. At the same time, ASCs after the fifth day of differentiation in the amount of 4 × 10⁴ were added to culture wells. After 24 hours of coculture, media were collected for analysis of the macrophages' secretory activity, and the cells were lysed by adding TRI Reagent. Arginase-1 (a), iNOS (b), TNF-α (c), and IL-6 (d) gene expression was evaluated in macrophages with RT-PCR. Results expressed as mean ± S.D. Statistical significance indicated as an asterisk () when comparing the result to ASCEMS and as a number sign (#) when comparing to ASCCTRL. ##p < 0.05, ### and ∗∗∗p < 0.001.

Similar articles

Cited by

References

    1. Kaur J. A comprehensive review on metabolic syndrome. Cardiology Research and Practice. 2014;2014:21. doi: 10.1155/2014/943162.943162 - DOI - PMC - PubMed
    1. Frank N. Equine metabolic syndrome. Journal of Equine Veterinary Science. 2009;29(5):259–267. doi: 10.1016/j.jevs.2009.04.183. - DOI
    1. Marycz K., Kornicka K., Szlapka-Kosarzewska J., Weiss C. Excessive endoplasmic reticulum stress correlates with impaired mitochondrial dynamics, mitophagy and apoptosis, in liver and adipose tissue, but not in muscles in EMS horses. International Journal of Molecular Sciences. 2018;19(1):p. 165. doi: 10.3390/ijms19010165. - DOI - PMC - PubMed
    1. Morgan R., Keen J., McGowan C. Equine metabolic syndrome. Veterinary Record. 2015;177(7):173–179. doi: 10.1136/vr.103226. - DOI - PMC - PubMed
    1. Mendes A. F., Rosa S. C., Rufino A. T., Ribeiro M., Judas F. Diabetes-induced osteoarthritis: role of hyperglycemia in joint destruction. BMC Musculoskeletal Disorders. 2015;16(S1) Supplement 1 doi: 10.1186/1471-2474-16-S1-S1. - DOI

MeSH terms