

Trends and Patterns of Disparities in Burden of Lung Cancer in the United States, 1974-2015
- PMID: 31214489
- PMCID: PMC6555199
- DOI: 10.3389/fonc.2019.00404
Trends and Patterns of Disparities in Burden of Lung Cancer in the United States, 1974-2015
Abstract
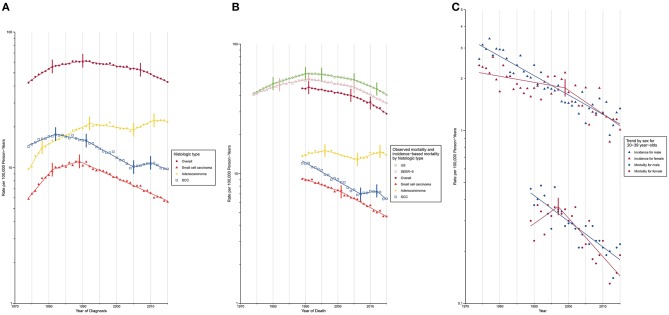
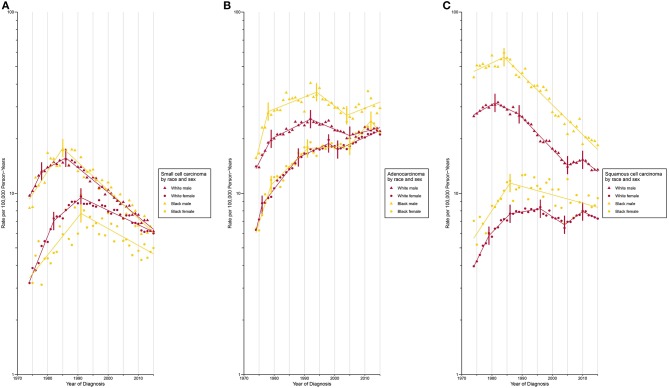
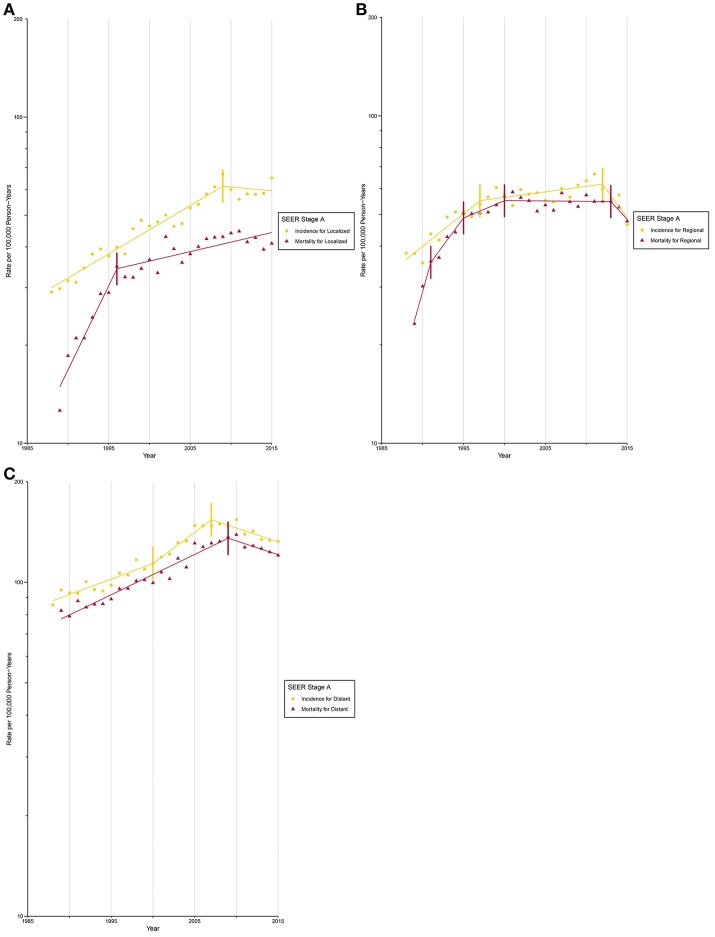
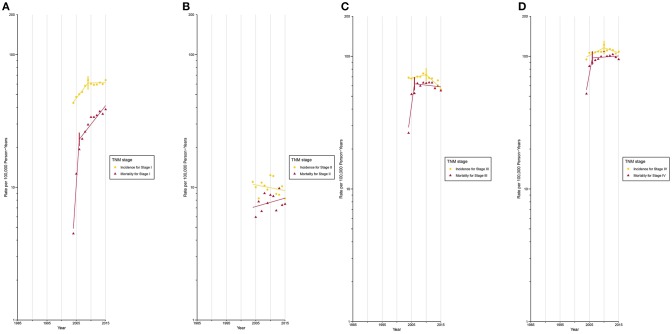
Background: Although lung cancer incidence and mortality have been declining since the 1990s, the extent to which such progress has been made is unequal across population segments. Updated epidemiologic data on trends and patterns of disparities are lacking. Methods: Data on lung cancer cases and deaths during 1974 to 2015 were extracted from the Surveillance, Epidemiology, and End Results program. Age-standardized lung cancer incidence and mortality and their annual percent changes were calculated by histologic types, demographic variables, and tumor characteristics. Results: Lung cancer incidence decreased since 1990 (1990 to 2007: annual percent change, -0.9 [95% CI, -1.0%, -0.8%]; 2007 to 2015: -2.6 [-2.9%, -2.2%]). Among adults aged between 20 and 39 years, a higher incidence was observed among females during 1995 to 2011, after which a faster decline in female lung cancer incidence (males: -2.5% [-2.8%, -2.2%]; females: -3.1% [-4.7%, -1.5%]) resulted in a lower incidence among females. The white population had a higher incidence than the Black population for small cell carcinoma since 1987. Black females were the only group whose adenocarcinoma incidence plateaued since 2012 (-5.0% [-13.0%, 3.7%]). A higher incidence for squamous cell carcinoma was observed among Black males and females than among white males and females during 1974 to 2015. After circa 2005, octogenarians and older patients constituted the group with the highest lung cancer incidence. Incidence for localized and AJCC/TNM stage I lung cancer among octogenarians and older patients plateaued since 2009, while mortality continued to rise (localized: 1.4% [0.6%, 2.1%]; stage I: 6.7% [4.5%, 9.0%]). Conclusions: Lung cancer disparities prevail across population segments. Our findings inform effective approaches to eliminate lung cancer disparities by targeting at-risk populations.
Keywords: disparity; incidence; lung cancer; mortality; trend.
Figures
Similar articles
-
United States lung carcinoma incidence trends: declining for most histologic types among males, increasing among females.Cancer. 1996 Jun 15;77(12):2464-70. doi: 10.1002/(SICI)1097-0142(19960615)77:12<2464::AID-CNCR8>3.0.CO;2-M. Cancer. 1996. PMID: 8640694
-
Pancreatic cancer incidence trends: evidence from the Surveillance, Epidemiology and End Results (SEER) population-based data.Int J Epidemiol. 2018 Apr 1;47(2):427-439. doi: 10.1093/ije/dyx232. Int J Epidemiol. 2018. PMID: 29149259 Free PMC article.
-
Recent Spatiotemporal Patterns of US Lung Cancer by Histologic Type.Front Public Health. 2017 May 19;5:82. doi: 10.3389/fpubh.2017.00082. eCollection 2017. Front Public Health. 2017. PMID: 28580352 Free PMC article.
-
20-Year Comparative Survival and Mortality of Cancer of the Stomach by Age, Sex, Race, Stage, Grade, Cohort Entry Time-Period, Disease Duration & Selected ICD-O-3 Oncologic Phenotypes: A Systematic Review of 157,258 Cases for Diagnosis Years 1973-2014: (SEER*Stat 8.3.4).J Insur Med. 2019;48(1):5-23. doi: 10.17849/insm-48-1-1-19.1. Epub 2019 Oct 14. J Insur Med. 2019. PMID: 31609640
-
Epidemiology of lung cancer.Semin Intervent Radiol. 2013 Jun;30(2):93-8. doi: 10.1055/s-0033-1342949. Semin Intervent Radiol. 2013. PMID: 24436524 Free PMC article. Review.
Cited by
-
Phase Ib/II study on the safety, tolerability, and preliminary efficacy of pegylated irinotecan (JK1201I) as second-line monotherapy for patients with small-cell lung cancer.Cancer Med. 2024 Sep;13(17):e70059. doi: 10.1002/cam4.70059. Cancer Med. 2024. PMID: 39225504 Free PMC article. Clinical Trial.
-
Bidirectional Mendelian randomization analysis investigating the genetic association between primary breast cancer and colorectal cancer.Front Immunol. 2024 Jan 12;14:1260941. doi: 10.3389/fimmu.2023.1260941. eCollection 2023. Front Immunol. 2024. PMID: 38283349 Free PMC article.
-
Clinical characteristics and risk of second primary lung cancer after cervical cancer: A population-based study.PLoS One. 2020 Aug 5;15(8):e0231807. doi: 10.1371/journal.pone.0231807. eCollection 2020. PLoS One. 2020. PMID: 32756555 Free PMC article.
-
Sex, racial/ethnic and socioeconomic disparities in patients with metastatic bone disease.J Surg Oncol. 2022 Mar;125(4):766-774. doi: 10.1002/jso.26765. Epub 2021 Dec 10. J Surg Oncol. 2022. PMID: 34889456 Free PMC article.
-
Changes in mortality and years of life lost due to lung cancer in Poland, 2000-2016.J Transl Med. 2020 May 6;18(1):188. doi: 10.1186/s12967-020-02354-4. J Transl Med. 2020. PMID: 32375807 Free PMC article.
References
Grants and funding
LinkOut - more resources
Full Text Sources