. 2019 May 31:9:434.
doi: 10.3389/fonc.2019.00434. eCollection 2019.

Integrating Clinical and Genetic Analysis of Perineural Invasion in Head and Neck Squamous Cell Carcinoma

Affiliations

Integrating Clinical and Genetic Analysis of Perineural Invasion in Head and Neck Squamous Cell Carcinoma

Ze Zhang et al. Front Oncol. .

Abstract

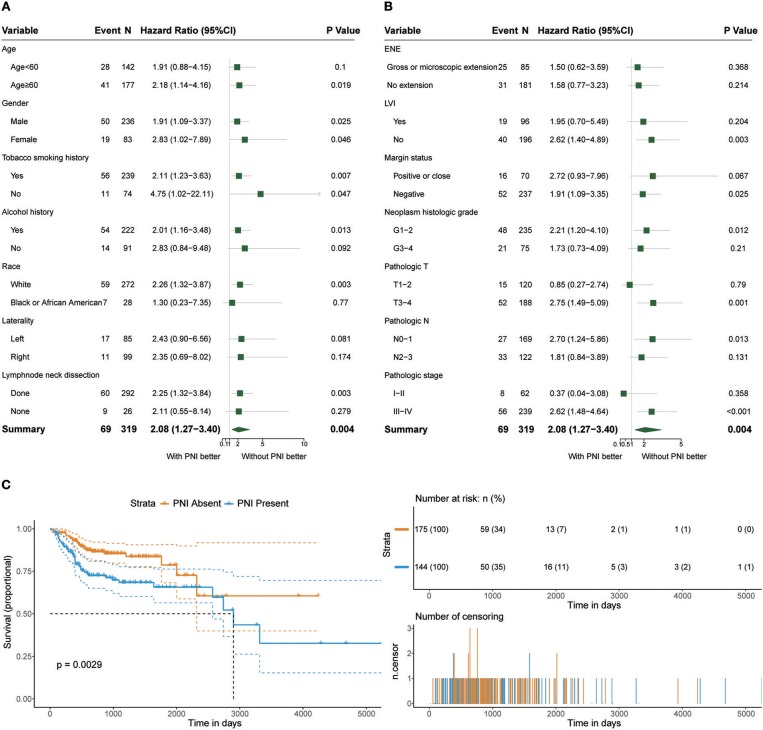
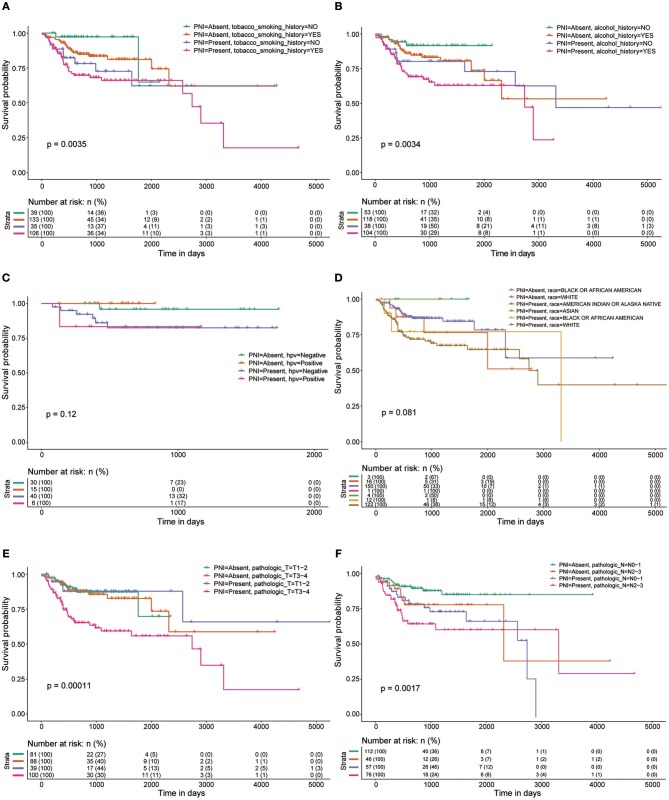
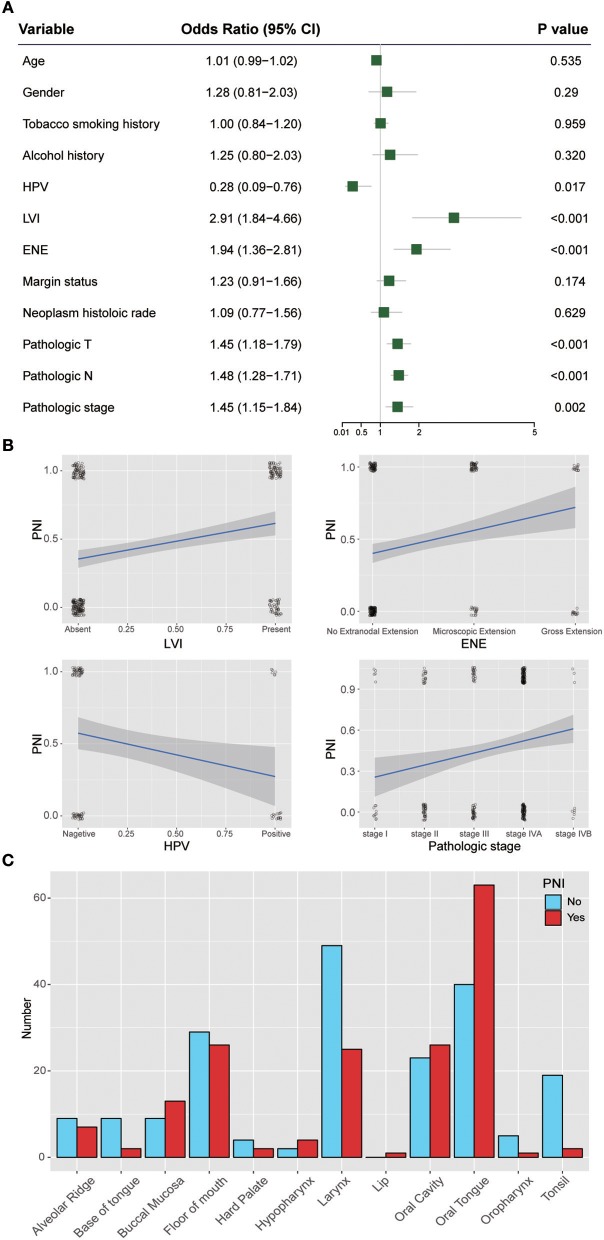
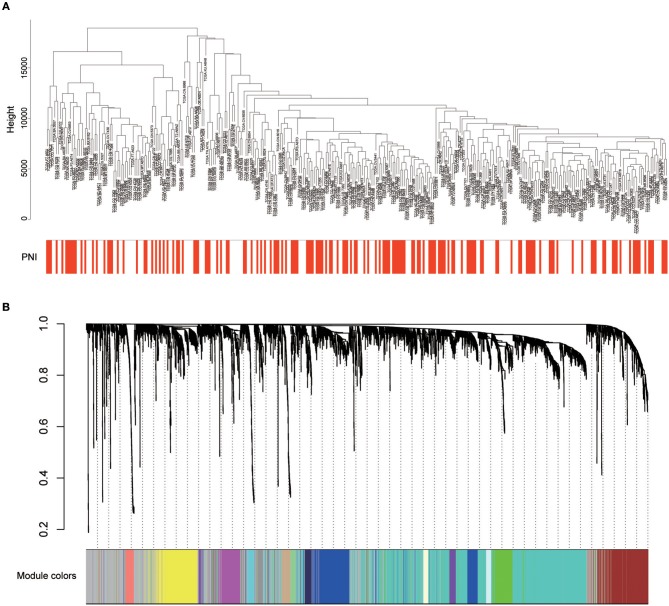
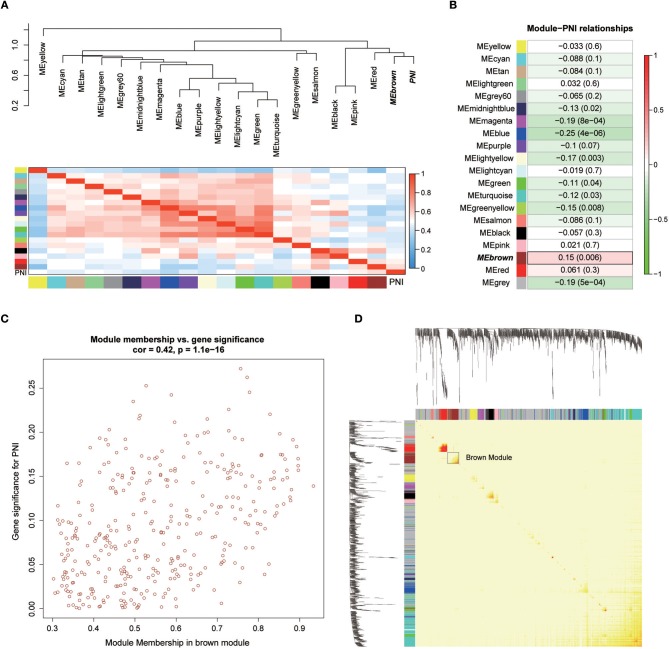
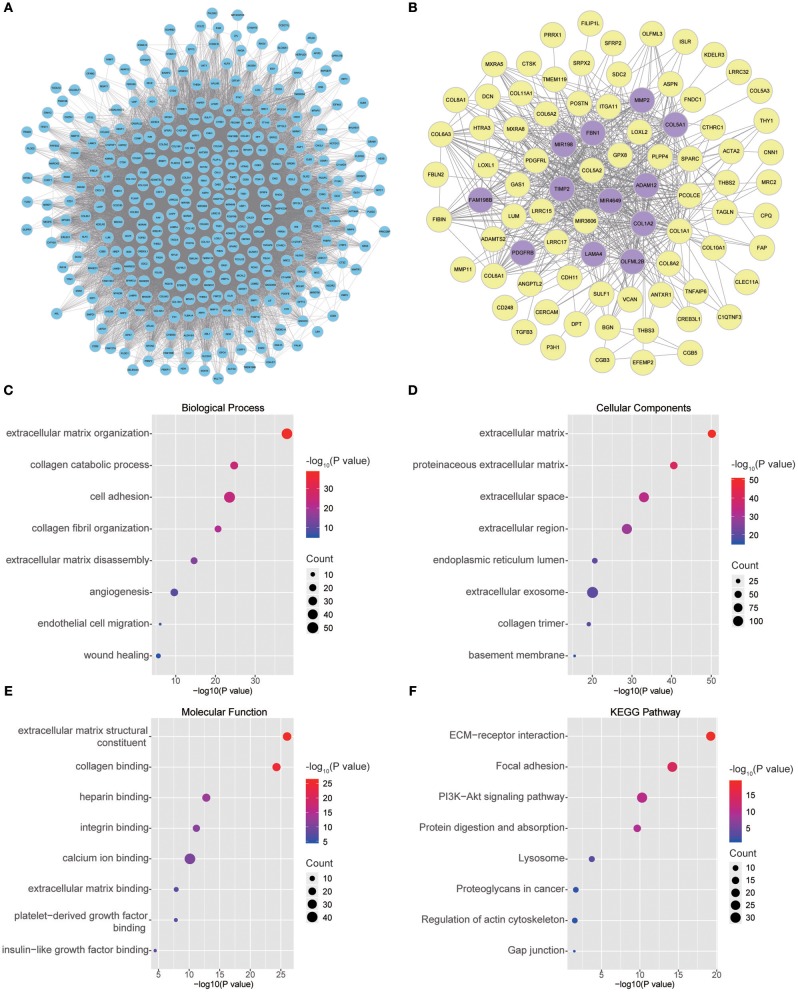
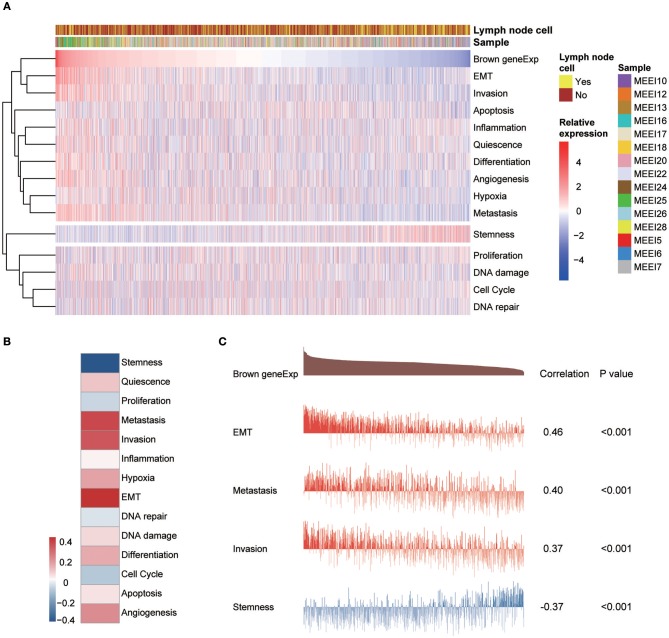
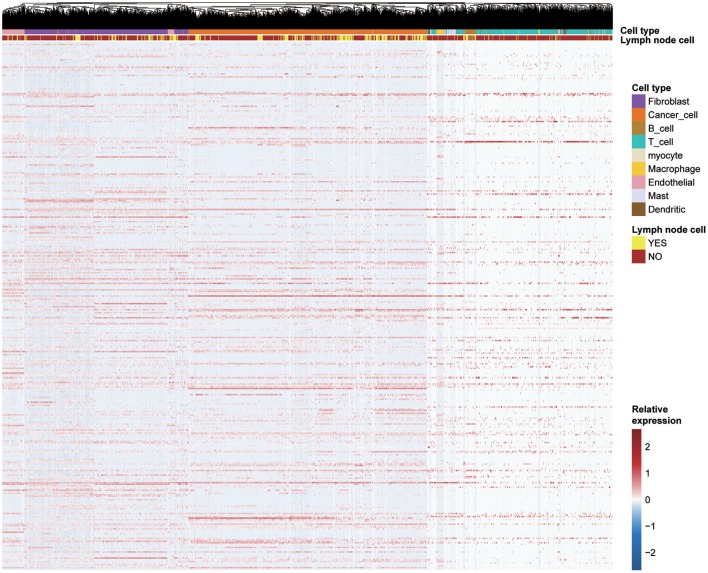
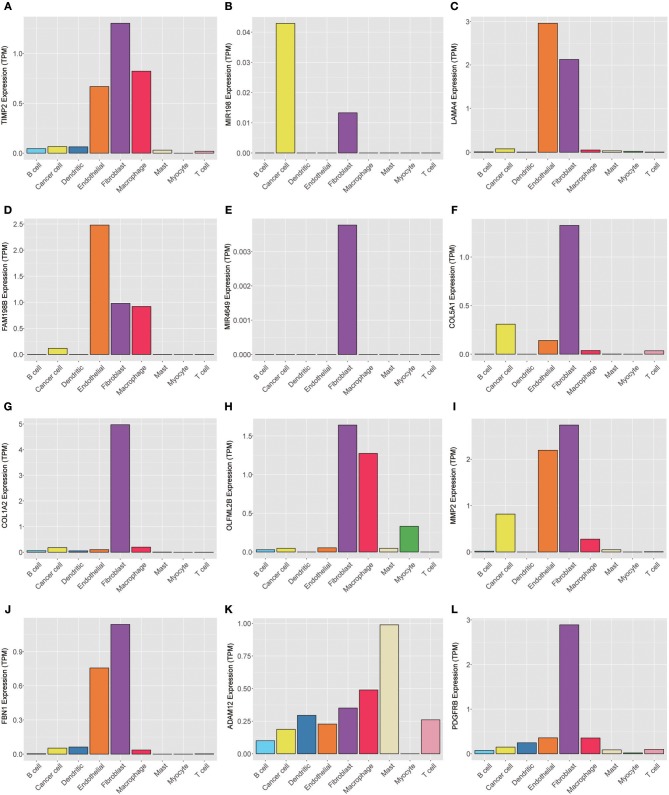
Introduction: Perineural invasion (PNI), a key pathological feature of head and neck squamous cell carcinoma (HNSCC), predicts poor survival. However, the associated clinical characteristics remain uncertain, and the molecular mechanisms are largely unknown. Materials and methods: HNSCC gene expression and corresponding clinical data were downloaded from The Cancer Genome Atlas (TCGA). Prognostic subgroup analysis was performed, and potential PNI risk factors were assessed with logistic regression. PNI-associated gene coexpression modules were identified with weighted gene coexpression network analysis (WGCNA), and key module gene functions and the roles of non-malignant cells in PNI were evaluated with a single-cell transcriptomic dataset (GSE103322). Results: PNI was significantly inversely associated with overall survival (HR, 2.08; 95% CI, 1.27 to 3.40; P = 0.004), especially in advanced patients (HR, 2.62; 95% CI, 1.48 to 4.64; P < 0.001). Age, gender, smoking history, and alcohol history were not risk factors. HPV-positive cases were less likely than HPV-negative cases to develop PNI (OR, 0.28; 95% CI, 0.09 to 0.76; P = 0.017). WGCNA identified a unique significantly PNI-associated coexpression module containing 357 genes, with 12 hub genes (TIMP2, MIR198, LAMA4, FAM198B, MIR4649, COL5A1, COL1A2, OLFML2B, MMP2, FBN1, ADAM12, and PDGFRB). Single-cell transcriptomic data analysis revealed that the genes in the PNI-associated module correlated with the signatures "EMT," "metastasis," and "invasion." Among non-malignant cells, fibroblasts had relatively high expression of the key genes. Conclusion: At the molecular and omic levels, we verified that PNI in HNSCC is a process of invasion rather than simple diffusion. Fibroblasts probably play an important role in PNI. Novelty & Impact Statements The study is a thorough analysis of PNI in HNSCC from the clinical level to the molecular level and presents the first description of cancer-related PNI from the omics perspective to date as far as we know. We verified that PNI in HNSCC is a process of invasion rather than simple diffusion, at the molecular and omic levels. Fibroblasts were found to probably play an important role in PNI by analyzing single-cell transcriptomic data.

Keywords: HNSCC; TCGA; WGCNA; perineural invasion; single-cell sequencing.


Figures

Figure 1
Figure 1
(A,B) Subgroup analysis of OS in patients with PNI and patients without PNI. (C) OS in patients with and without PNI.
Figure 2
Figure 2
OS rates of patients with and without PNI were compared with regards to (A) smoking history, (B) alcohol history, (C) HPV status, (D) race, (E) pathologic T category, and (F) pathologic N category.
Figure 3
Figure 3
(A) Relative risk for PNI with regards to age, gender, smoking history, alcohol history, HPV status, LVI, ENE, margin status, neoplasm histologic grade, pathologic T category, pathologic N category, and pathologic stage. (B) Regression curve for the relationships of PNI with LVI, ENE, HPV status, and pathologic stage. (C) Relationship between PNI and the anatomical distribution of the primary tumor. HPV, human papillomavirus; LVI, lymphovascular invasion; ENE, extranodal extension.
Figure 4
Figure 4
(A) Cluster analysis of HNSCC expression data after removing outliers. (B) Clustering dendrogram of genes. A hierarchical cluster analysis dendrogram was used to detect coexpression clusters. Each color is assigned to 1 module (gray represents unassigned genes).
Figure 5
Figure 5
(A) Correlations between the modules. (B) Correlation values for different module-PNI relationships. (C) Scatter plot of the correlation between gene MM in the brown module, which was associated with PNI, and gene significance for PNI. (D) Network heatmap plot showing genes sorted into rows and columns by the clustering tree. Lighter colors denote lower adjacency, and darker colors denote higher adjacency.
Figure 6
Figure 6
(A) Visual representation of the coexpression networks in the key module. (B) Coexpression networks when only a weight of more than 0.2, as calculated by WGCNA, was considered. The hub genes are highlighted. (C–F) GO and pathway enrichment analysis of brown module genes. (C) BP analysis. (D) CC analysis. (E) MF analysis. (F) KEGG pathway analysis.
Figure 7
Figure 7
(A) Heatmap showing the correlations between the expression of key module genes and functional state signatures from an analysis of 2,105 single cancer cells in the GSE103322 dataset. MEE5, MEE6, MEE7, MEE10, MEE12, MEE13, MEE16, MEE17, MEE18, MEE20, MEE22, MEE24, MEE25, MEE26, and MEE28 represent cells from different patients. The sources of the cells (primary lesion or metastatic lymph node) are noted. (B) Heatmap of the correlations between gene expression and 14 functional states. (C) Details of the relationships between brown module gene expression and “EMT,” “metastasis,” “invasion,” and “stemness”.
Figure 8
Figure 8
Expression levels of all genes (357 genes) in the key coexpression module among 5,902 malignant and non-malignant single cells.
Figure 9
Figure 9
Expression levels of the hub genes (A) TIMP2, (B) MIR198, (C) LAMA4, (D) FAM198B, (E) MIR4649, (F) COL5A1, (G) COL1A2, (H) OLFML2B, (I) MMP2, (J) FBN1, (K) ADAM12, and (L) PDGFRB among 5,902 malignant and non-malignant single cells.

Similar articles

Cited by

References

    1. Bray F, Ferlay J, Soerjomataram I, Siegel RL, Torre LA, Jemal A. Global cancer statistics 2018: GLOBOCAN estimates of incidence and mortality worldwide for 36 cancers in 185 countries. CA Cancer J Clin. (2018) 68:394–424. 10.3322/caac.21492 - DOI - PubMed
    1. Liu J, Lichtenberg T, Hoadley KA, Poisson LM, Lazar AJ, Cherniack AD, et al. . An integrated TCGA pan-cancer clinical data resource to drive high-quality survival outcome analytics. Cell. (2018) 173:400–16 e411. 10.1016/j.cell.2018.02.052 - DOI - PMC - PubMed
    1. Schmitd LB, Scanlon CS, D'Silva NJ. Perineural invasion in head and neck cancer. J Dent Res. (2018) 97:742–50. 10.1177/0022034518756297 - DOI - PMC - PubMed
    1. Roh J, Muelleman T, Tawfik O, Thomas SM. Perineural growth in head and neck squamous cell carcinoma: a review. Oral Oncol. (2015) 51:16–23. 10.1016/j.oraloncology.2014.10.004 - DOI - PMC - PubMed
    1. Amit M, Na'ara S, Gil Z. Mechanisms of cancer dissemination along nerves. Nat Rev Cancer. (2016) 16:399–408. 10.1038/nrc.2016.38 - DOI - PubMed